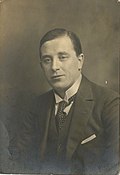
Barnsley | |
---|---|
Former county constituency for the House of Commons | |
County | South Yorkshire |
1885–1983 | |
Seats | One |
Created from | Southern West Riding of Yorkshire |
Replaced by | Barnsley Central, Barnsley East and Barnsley West & Penistone [1] |
Barnsley was a Parliamentary constituency covering the town of Barnsley in England. It returned one Member of Parliament (MP) to the House of Commons of the Parliament of the United Kingdom, elected by the first past the post voting system.
The constituency was created under the Redistribution of Seats Act 1885 for the 1885 general election and abolished in 1983. It was a Liberal seat in its early years, but by the time of its abolition it had become a Labour stronghold.
The area formerly covered by this constituency is now mostly in the Barnsley Central constituency and partly in the Barnsley East constituency.
Party | Candidate | Votes | % | ±% | |
---|---|---|---|---|---|
Liberal | Courtney Kenny | 6,705 | 71.1 | ||
Conservative | Bruce Vernon-Wentworth | 2,722 | 28.9 | ||
Majority | 3,983 | 42.2 | |||
Turnout | 9,427 | 85.4 | |||
Registered electors | 11,034 | ||||
Liberal win (new seat) |
Party | Candidate | Votes | % | ±% | |
---|---|---|---|---|---|
Liberal | Courtney Kenny | 5,425 | 65.0 | −6.1 | |
Conservative | Bruce Vernon-Wentworth | 2,917 | 35.0 | +6.1 | |
Majority | 2,508 | 30.0 | −12.2 | ||
Turnout | 8,342 | 75.6 | −9.8 | ||
Registered electors | 11,034 | ||||
Liberal hold | Swing | −6.1 |
Kenny resigned, causing a by-election.
Party | Candidate | Votes | % | ±% | |
---|---|---|---|---|---|
Liberal | William Compton | 6,232 | 62.2 | −2.8 | |
Conservative | Bruce Vernon-Wentworth | 3,781 | 37.8 | +2.8 | |
Majority | 2,451 | 24.4 | −5.6 | ||
Turnout | 10,013 | 79.5 | +3.9 | ||
Registered electors | 12,593 | ||||
Liberal hold | Swing | −2.8 |
Party | Candidate | Votes | % | ±% | |
---|---|---|---|---|---|
Liberal | William Compton | 6,739 | 65.8 | +0.8 | |
Liberal Unionist | Francis Foljambe | 3,498 | 34.2 | −0.8 | |
Majority | 3,241 | 31.6 | +1.6 | ||
Turnout | 10,237 | 75.0 | −0.6 | ||
Registered electors | 13,643 | ||||
Liberal hold | Swing | +0.8 |
Party | Candidate | Votes | % | ±% | |
---|---|---|---|---|---|
Liberal | William Compton | 6,820 | 59.4 | −6.4 | |
Conservative | Ronald Greville | 4,653 | 40.6 | +6.4 | |
Majority | 2,167 | 18.8 | −12.8 | ||
Turnout | 11,473 | 80.9 | +5.9 | ||
Registered electors | 14,181 | ||||
Liberal hold | Swing | −6.4 |
Party | Candidate | Votes | % | ±% | |
---|---|---|---|---|---|
Liberal | Joseph Walton | 6,744 | 59.7 | +0.3 | |
Conservative | James Blyth | 3,454 | 30.6 | −10.0 | |
Ind. Labour Party | Pete Curran | 1,091 | 9.7 | New | |
Majority | 3,290 | 29.1 | +10.3 | ||
Turnout | 11,289 | 76.3 | −4.6 | ||
Registered electors | 14,805 | ||||
Liberal hold | Swing | +5.2 |
Party | Candidate | Votes | % | ±% | |
---|---|---|---|---|---|
Liberal | Joseph Walton | 7,549 | 63.4 | +4.0 | |
Liberal Unionist | Arthur William Groser | 4,356 | 36.6 | −4.0 | |
Majority | 3,193 | 26.8 | +8.0 | ||
Turnout | 11,905 | 74.6 | −6.3 | ||
Registered electors | 15,948 | ||||
Liberal hold | Swing | +4.0 |
Party | Candidate | Votes | % | ±% | |
---|---|---|---|---|---|
Liberal | Joseph Walton | Unopposed | |||
Liberal hold |
Party | Candidate | Votes | % | ±% | |
---|---|---|---|---|---|
Liberal | Joseph Walton | 12,425 | 71.1 | N/A | |
Conservative | Arthur William Groser | 5,053 | 28.9 | New | |
Majority | 7,372 | 42.2 | N/A | ||
Turnout | 17,478 | 83.8 | N/A | ||
Liberal hold | Swing | N/A |
Party | Candidate | Votes | % | ±% | |
---|---|---|---|---|---|
Liberal | Joseph Walton | Unopposed | |||
Liberal hold |
Party | Candidate | Votes | % | ±% | |
---|---|---|---|---|---|
C | Liberal | Joseph Walton | Unopposed | ||
Liberal hold | |||||
Cindicates candidate endorsed by the coalition government. |
Party | Candidate | Votes | % | ±% | |
---|---|---|---|---|---|
Labour | John Potts | 14,728 | 55.1 | New | |
National Liberal | Maurice Moore | 12,011 | 44.9 | N/A | |
Majority | 2,717 | 10.2 | N/A | ||
Turnout | 26,739 | 75.7 | N/A | ||
Labour gain from National Liberal | Swing |
Party | Candidate | Votes | % | ±% | |
---|---|---|---|---|---|
Labour | John Potts | 12,674 | 48.0 | −7.1 | |
Unionist | William Craven-Ellis | 6,884 | 26.0 | N/A | |
Liberal | John Neal | 6,881 | 26.0 | −18.9 | |
Majority | 5,790 | 22.0 | +11.8 | ||
Turnout | 26,439 | 74.1 | −1.6 | ||
Labour hold | Swing |
Party | Candidate | Votes | % | ±% | |
---|---|---|---|---|---|
Labour | John Potts | 14,738 | 51.7 | +3.7 | |
Liberal | John Neal | 13,785 | 48.5 | +22.5 | |
Majority | 953 | 3.2 | −18.8 | ||
Turnout | 28,523 | 78.2 | +4.1 | ||
Labour hold | Swing |
Party | Candidate | Votes | % | ±% | |
---|---|---|---|---|---|
Labour | John Potts | 21,855 | 53.8 | +2.1 | |
Liberal | William Sutherland | 12,517 | 30.8 | −17.7 | |
Unionist | William Craven-Ellis | 6,265 | 15.4 | New | |
Majority | 9,388 | 23.0 | +19.8 | ||
Turnout | 40,637 | 82.3 | +4.1 | ||
Labour hold | Swing | +9.8 |
Party | Candidate | Votes | % | ±% | |
---|---|---|---|---|---|
National Liberal | Richard John Soper | 21,392 | 50.9 | +35.5 | |
Labour | John Potts | 20,622 | 49.1 | −4.7 | |
Majority | 770 | 1.8 | N/A | ||
Turnout | 42,014 | 84.2 | +1.9 | ||
National Liberal gain from Labour | Swing |
Party | Candidate | Votes | % | ±% | |
---|---|---|---|---|---|
Labour | John Potts | 25,318 | 58.9 | +9.8 | |
National Liberal | Richard John Soper | 17,683 | 41.1 | −9.8 | |
Majority | 7,635 | 17.8 | N/A | ||
Turnout | 43,001 | 82.6 | −1.6 | ||
Labour gain from National Liberal | Swing |
Party | Candidate | Votes | % | ±% | |
---|---|---|---|---|---|
Labour | Frank Collindridge | 23,566 | 64.4 | +5.5 | |
National Liberal | Seymour Howard | 13,052 | 35.6 | −5.5 | |
Majority | 10,514 | 28.8 | +11.0 | ||
Turnout | 36,618 | 72.7 | −9.9 | ||
Labour hold | Swing | +5.5 |
Party | Candidate | Votes | % | ±% | |
---|---|---|---|---|---|
Labour | Frank Collindridge | 30,614 | 72.9 | +14.0 | |
National Liberal | Richard John Soper | 11,382 | 27.1 | −14.0 | |
Majority | 19,232 | 45.8 | +28.0 | ||
Turnout | 41,996 | 80.4 | −2.2 | ||
Labour hold | Swing |
Party | Candidate | Votes | % | ±% | |
---|---|---|---|---|---|
Labour | Frank Collindridge | 42,008 | 68.6 | −4.3 | |
Liberal | Geoffrey Howard Walker | 10,779 | 17.6 | New | |
National Liberal | Charles Gordon-Spencer | 8,480 | 13.8 | −13.3 | |
Majority | 31,209 | 51.0 | +5.2 | ||
Turnout | 61,267 | 88.9 | +8.5 | ||
Labour hold | Swing |
Party | Candidate | Votes | % | ±% | |
---|---|---|---|---|---|
Labour | Sidney Schofield | 37,523 | 69.7 | +1.1 | |
National Liberal | Geoffrey Whittaker | 9,296 | 17.3 | +3.5 | |
Liberal | Geoffrey Howard Walker | 7,002 | 13.0 | −4.6 | |
Majority | 28,227 | 52.4 | +1.4 | ||
Turnout | 53,821 | 77.2 | −11.7 | ||
Labour hold | Swing |
Party | Candidate | Votes | % | ±% | |
---|---|---|---|---|---|
Labour | Roy Mason | 29,283 | 72.9 | +3.2 | |
Conservative | Geoffrey Whittaker | 10,905 | 27.1 | +9.8 | |
Majority | 18,378 | 45.8 | −6.6 | ||
Turnout | 40,188 | ||||
Labour hold | Swing | −3.3 |
Party | Candidate | Votes | % | ±% | |
---|---|---|---|---|---|
Labour | Roy Mason | 39,485 | 72.8 | +3.1 | |
National Liberal | R. Anthony Wilson | 14,776 | 27.2 | +9.9 | |
Majority | 24,709 | 45.6 | −6.8 | ||
Turnout | 54,261 | 78.6 | +1.6 | ||
Labour hold | Swing |
Party | Candidate | Votes | % | ±% | |
---|---|---|---|---|---|
Labour | Roy Mason | 42,565 | 73.7 | +0.9 | |
Conservative | John Philip Howard Bent | 15,189 | 26.3 | −0.9 | |
Majority | 27,376 | 47.4 | +1.9 | ||
Turnout | 57,754 | 82.7 | +4.1 | ||
Labour hold | Swing |
Party | Candidate | Votes | % | ±% | |
---|---|---|---|---|---|
Labour | Roy Mason | 37,250 | 66.8 | −6.9 | |
Conservative | Joan Hall | 9,417 | 16.9 | −9.4 | |
Liberal | John Herbert Dossett | 9,089 | 16.3 | New | |
Majority | 27,833 | 49.9 | +2.5 | ||
Turnout | 55,756 | 80.0 | −2.7 | ||
Labour hold | Swing |
Party | Candidate | Votes | % | ±% | |
---|---|---|---|---|---|
Labour | Roy Mason | 38,744 | 75.7 | +8.9 | |
Conservative | Joan Hall | 12,456 | 24.3 | +7.4 | |
Majority | 26,288 | 51.4 | +1.5 | ||
Turnout | 51,200 | 73.4 | −6.6 | ||
Labour hold | Swing |
Party | Candidate | Votes | % | ±% | |
---|---|---|---|---|---|
Labour | Roy Mason | 34,956 | 64.8 | −10.9 | |
Conservative | Robert Godber | 10,811 | 20.0 | −4.3 | |
Liberal | John Herbert Dossett | 8,186 | 15.2 | New | |
Majority | 24,145 | 44.8 | −6.6 | ||
Turnout | 53,953 | 71.2 | −2.2 | ||
Labour hold | Swing |
Party | Candidate | Votes | % | ±% | |
---|---|---|---|---|---|
Labour | Roy Mason | 40,595 | 71.8 | +7.0 | |
Conservative | George England | 15,969 | 28.2 | +8.2 | |
Majority | 24,626 | 43.6 | −1.2 | ||
Turnout | 56,564 | 74.6 | +3.4 | ||
Labour hold | Swing |
Party | Candidate | Votes | % | ±% | |
---|---|---|---|---|---|
Labour | Roy Mason | 34,212 | 65.3 | −6.5 | |
Conservative | George England | 9,400 | 18.0 | −10.2 | |
Liberal | Peter Tomlinson | 8,753 | 16.7 | New | |
Majority | 24,812 | 47.3 | +3.7 | ||
Turnout | 52,365 | 68.4 | −6.2 | ||
Labour hold | Swing |
Party | Candidate | Votes | % | ±% | |
---|---|---|---|---|---|
Labour | Roy Mason | 36,276 | 64.0 | −1.3 | |
Conservative | George England | 13,654 | 24.1 | +6.1 | |
Liberal | Wilfred Whitaker | 5,751 | 10.2 | −6.5 | |
Troops Out of Ireland | B. Gallagher | 638 | 1.1 | New | |
Workers Revolutionary | J. Davis | 348 | 0.6 | New | |
Majority | 22,622 | 39.9 | −7.4 | ||
Turnout | 56,667 | 72.9 | +4.5 | ||
Labour hold | Swing |
Caithness and Sutherland was a county constituency of the House of Commons of the Parliament of the United Kingdom from 1918 to 1997. It elected one Member of Parliament (MP) by the first past the post system of election.
Normanton was a county constituency represented in the House of Commons of the Parliament of the United Kingdom. It elected one Member of Parliament (MP) by the first past the post system of election.
Glasgow Govan was a parliamentary constituency in the Govan district of Glasgow. It was represented in the House of Commons of the Parliament of the United Kingdom for 120 years; from 1885 until 2005, returning one Member of Parliament (MP) elected by the first-past-the-post system.
East Grinstead was a parliamentary constituency in the Kingdom of England, the Kingdom of Great Britain, and the United Kingdom. It first existed as a Parliamentary borough from 1307, returning two Members of Parliament to the House of Commons elected by the bloc vote system. The borough was disfranchised under the Reform Act 1832, but the name was revived at the 1885 election when the Redistribution of Seats Act created a new single-member county division of the same name.
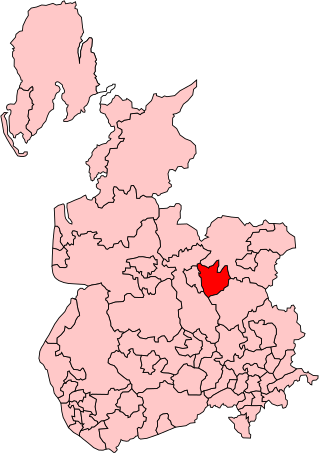
Accrington was a parliamentary constituency of the House of Commons of the Parliament of the United Kingdom from 1885 to 1983. It elected one Member of Parliament (MP) by the first-past-the-post system of election.
Birmingham Aston was a constituency of the House of Commons of the Parliament of the United Kingdom. From 1918 to 1974 it elected one Member of Parliament (MP) by the first-past-the-post system of election.
Barkston Ash was a parliamentary constituency centred on the village of Barkston Ash in the West Riding of Yorkshire. It was represented in the House of Commons of the Parliament of the United Kingdom from 1885 until 1983. It elected one Member of Parliament (MP) by the first past the post system of election.
Fulham was a borough constituency centred on the London district of Fulham. It was represented in the House of Commons of the Parliament of the United Kingdom from 1885 until 1918 and from 1955 to 1997.
Ilkeston is a former United Kingdom Parliamentary constituency. It was a constituency of the House of Commons of the Parliament of the United Kingdom. It was represented by one Member of Parliament. In 1983 it was abolished, together with South East Derbyshire, when the Derbyshire county constituencies were redrawn - the constituencies of Amber Valley and Erewash were created and the constituency of South Derbyshire was re-created.
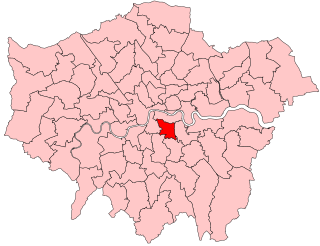
Peckham is a borough constituency in South London which returns one Member of Parliament (MP) to the House of Commons of the Parliament of the United Kingdom. Elections are held using the first-past-the-post voting system.
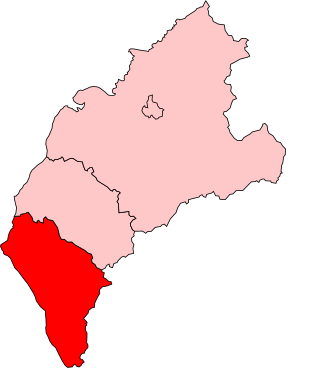
Whitehaven was a constituency centred on the town of Whitehaven in Cumberland, which returned one Member of Parliament (MP) to the House of Commons of the Parliament of the United Kingdom.
Salford West was a parliamentary constituency in the City of Salford in Greater Manchester from 1885 until 1983. It returned one Member of Parliament (MP) to the House of Commons of the Parliament of the United Kingdom.
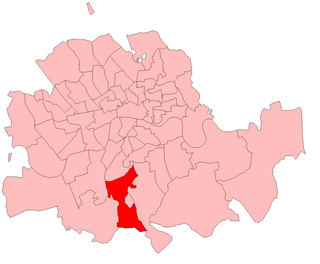
Norwood was a parliamentary constituency in south London which returned one Member of Parliament (MP) to the House of Commons of the Parliament of the United Kingdom by the first past the post system.
Hornsey was a constituency that returned one Member of Parliament (MP) to the House of Commons of the UK Parliament, 1885 — 1983. It was then largely replaced by Hornsey & Wood Green. Its voters using the first-past-the-post system elected the Conservative Party candidate at each election. Its closest result was a 1.29% majority at the 1966 election which saw the start of the Second Wilson Ministry. From 1945 onwards the runners-up in the seat were the Labour Party candidates.
Ebbw Vale was a constituency in the Parliament of the United Kingdom. It was created for the 1918 general election and returned one Member of Parliament (MP) by the first past the post system until it was abolished for the 1983 general election.
Holland with Boston was a county constituency represented in the House of Commons of the Parliament of the United Kingdom from 1918 to 1997. It elected one Member of Parliament (MP) by the first past the post system of election.
Mile End was a parliamentary constituency centred on the Mile End district of the East End of London. It returned one Member of Parliament (MP) to the House of Commons of the Parliament of the United Kingdom.
St Helens was a constituency in the county of Lancashire, England. It returned one Member of Parliament (MP) to the House of Commons of the UK Parliament.
East Dorset is a former United Kingdom Parliamentary constituency. It was formally known as the Eastern Division of Dorset. It was a constituency of the House of Commons of the Parliament of the United Kingdom. It was represented by one Knight of the Shire.
Bromley is a former constituency for the House of Commons of the Parliament of the United Kingdom. The most famous MP was Harold Macmillan, Prime Minister, 1957 to 1963.