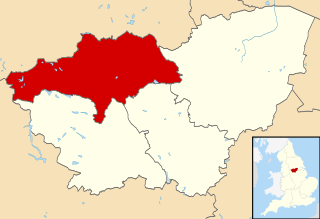
| |||||||||||||||||
All 63 seats to Barnsley Metropolitan Borough Council 32 seats needed for a majority | |||||||||||||||||
| |||||||||||||||||
Map of the 2004 Barnsley council election results. Labour in red, Independents in grey, Conservatives in blue and Lib Dems in yellow. | |||||||||||||||||
|
The 2004 Barnsley Metropolitan Borough Council election took place on 10 June 2004 to elect members of Barnsley Metropolitan Borough Council in South Yorkshire, England. The whole council was up for election with boundary changes since the last election in 2003 reducing the number of seats by 3. [1] The Labour party stayed in overall control of the council. [2]
The Metropolitan Borough of Barnsley is a metropolitan borough of South Yorkshire, England; its main town is Barnsley.
South Yorkshire is a metropolitan county in England. It is the southernmost county in the Yorkshire and the Humber region and had a population of 1.34 million in 2011. It has an area of 1,552 square kilometres (599 sq mi) and consists of four metropolitan boroughs, Barnsley, Doncaster, Rotherham and Sheffield. South Yorkshire was created on 1 April 1974 as a result of the Local Government Act 1972.Its largest settlement is Sheffield.
England is a country that is part of the United Kingdom. It shares land borders with Wales to the west and Scotland to the north-northwest. The Irish Sea lies west of England and the Celtic Sea lies to the southwest. England is separated from continental Europe by the North Sea to the east and the English Channel to the south. The country covers five-eighths of the island of Great Britain, which lies in the North Atlantic, and includes over 100 smaller islands, such as the Isles of Scilly and the Isle of Wight.
Party | Seats | Gains | Losses | Net gain/loss | Seats % | Votes % | Votes | +/− | |
---|---|---|---|---|---|---|---|---|---|
Labour | 33 | 0 | 0 | 0 | 52.4 | 36.4 | 26,756 | -13.7 | |
Independent | 22 | 0 | 0 | 0 | 34.9 | 29.1 | 21,429 | +6.9 | |
Conservative | 5 | 0 | 0 | 0 | 7.9 | 14.3 | 10,530 | -0.9 | |
Liberal Democrat | 3 | 0 | 0 | 0 | 4.8 | 13.2 | 9,719 | +2.4 | |
BNP | 0 | 0 | 0 | 0 | 0.0 | 6.9 | 5,092 | +5.9 | |
This resulted in the following composition of the council: [2] [4]
Party | Previous council | New council | |||
---|---|---|---|---|---|
Labour | 47 | 33 | |||
Independent | 10 | 22 | |||
Conservatives | 5 | 5 | |||
Liberal Democrats | 4 | 3 | |||
Total | 66 | 63 | |||
Working majority | 28 | 3 |
Party | Candidate | Votes | % | ± | |
---|---|---|---|---|---|
Liberal Democrat | Ian Guest | 1,154 | 41.3 | N/A | |
Labour | Michael Stokes | 984 | 35.2 | N/A | |
Liberal Democrat | Don Hutton | 951 | |||
Labour | Thomas Sheard | 939 | |||
Liberal Democrat | Peter Politano | 865 | |||
Labour | Margaret Bruff | 844 | |||
BNP | Marie Gardner | 401 | 14.3 | N/A | |
Conservative | Geoffrey Turvey | 256 | 9.2 | N/A | |
Majority | 170 | 6.1 | N/A | ||
Turnout | 6,394 | 34.3 | N/A | ||
Liberal Democrat win (new seat) | |||||
Labour win (new seat) | |||||
Liberal Democrat win (new seat) | |||||
Party | Candidate | Votes | % | ± | |
---|---|---|---|---|---|
Labour | Stephen Houghton CBE | 1,675 | 51.3 | N/A | |
Labour | Charlie Wraith | 1,634 | |||
Labour | Joseph Hayward | 1,615 | |||
Independent | Edgar Auckland | 716 | 21.9 | N/A | |
Independent | Alwyn Hodgson | 700 | |||
Independent | Ian Sanders | 490 | |||
Liberal Democrat | Pamela Kershaw | 370 | 11.3 | N/A | |
BNP | Paul Tibble | 314 | 9.6 | N/A | |
Conservative | Jean Rowley | 187 | 5.7 | N/A | |
Majority | 959 | 29.4 | N/A | ||
Turnout | 7,701 | 37.0 | N/A | ||
Labour win (new seat) | |||||
Party | Candidate | Votes | % | ± | |
---|---|---|---|---|---|
Independent | Ronald Fisher | 1,730 | 47.1 | N/A | |
Independent | David Wainwright | 1,416 | |||
Independent | Trevor Smith | 1,317 | |||
Labour | Gillian Bates | 1,113 | 30.3 | N/A | |
Labour | Brian Mathers | 756 | |||
Labour | Christopher Sykes | 681 | |||
Liberal Democrat | Sally Brook | 303 | 8.3 | N/A | |
BNP | David Highway | 272 | 7.4 | N/A | |
Conservative | Andrew Barr | 252 | 6.9 | N/A | |
Majority | 617 | 16.8 | N/A | ||
Turnout | 7,840 | 40.0 | N/A | ||
Independent win (new seat) | |||||
Party | Candidate | Votes | % | ± | |
---|---|---|---|---|---|
Labour | John Parkinson | 1,341 | 35.9 | N/A | |
Labour | Patrick Miller | 1,284 | |||
Labour | Thomas Cullum | 1,190 | |||
Independent | John Race | 850 | 22.8 | N/A | |
Conservative | Robert Barnard | 768 | 20.6 | N/A | |
Independent | Christopher Tummons | 496 | |||
Liberal Democrat | Patrick Logan | 471 | 12.6 | N/A | |
Conservative | Gordon Wilkinson | 470 | |||
Conservative | George Hill | 457 | |||
Independent | Edward Gouthwaite | 335 | |||
BNP | Jacqueline Hall | 305 | 8.2 | N/A | |
Majority | 491 | 13.1 | N/A | ||
Turnout | 7,967 | 47.4 | N/A | ||
Labour win (new seat) | |||||
Party | Candidate | Votes | % | ± | |
---|---|---|---|---|---|
Labour | Christopher Jenkinson | 1,102 | 30.7 | N/A | |
Labour | Linda Burgess | 1,073 | |||
Independent | Susan Simmons | 989 | 27.5 | N/A | |
Labour | Steve Redford | 963 | |||
Independent | Michael Walsh | 816 | |||
Independent | Mehdi Ghaffarian | 695 | |||
Conservative | Jack Orr | 596 | 16.6 | N/A | |
Liberal Democrat | Kenneth Smith | 546 | 15.2 | N/A | |
Conservative | Clive Watkinson | 545 | |||
Conservative | Tony Short | 539 | |||
BNP | Cheryl Saxton | 358 | 10.0 | N/A | |
Majority | 113 | 3.1 | N/A | ||
Turnout | 8,222 | 40.2 | N/A | ||
Labour win (new seat) | |||||
Independent win (new seat) | |||||
Party | Candidate | Votes | % | ± | |
---|---|---|---|---|---|
Labour | Alan Hancock | 1,319 | 48.7 | N/A | |
Labour | Alan Gardiner | 1,302 | |||
Labour | Janice Hancock | 1,271 | |||
Liberal Democrat | Sarah Gardiner | 1,065 | 39.4 | N/A | |
Conservative | Stuart Wilkinson | 322 | 11.9 | N/A | |
Majority | 254 | 9.4 | N/A | ||
Turnout | 5,279 | 32.2 | N/A | ||
Labour win (new seat) | |||||
Party | Candidate | Votes | % | ± | |
---|---|---|---|---|---|
Liberal Democrat | Sharron Brook | 1,687 | 46.5 | N/A | |
Labour | Kenneth Sanderson | 1,670 | 46.0 | N/A | |
Labour | John Thomson | 1,489 | |||
Labour | May Noble | 1,427 | |||
Conservative | Brent Wood | 272 | 7.5 | N/A | |
Majority | 17 | 0.5 | N/A | ||
Turnout | 6,545 | 36.2 | N/A | ||
Liberal Democrat win (new seat) | |||||
Labour win (new seat) | |||||
Party | Candidate | Votes | % | ± | |
---|---|---|---|---|---|
Independent | Phillip Birkinshaw | 2,013 | 59.8 | N/A | |
Independent | Brian Perrin | 1,920 | |||
Independent | Charles Parker | 1,761 | |||
Labour | Phillip Lofts | 904 | 26.8 | N/A | |
Labour | John Ryan | 848 | |||
Labour | Yvonne Saunder | 829 | |||
Conservative | Andrew Milner | 452 | 13.4 | N/A | |
Majority | 1,109 | 32.9 | N/A | ||
Turnout | 8,727 | 43.4 | N/A | ||
Independent win (new seat) | |||||
Party | Candidate | Votes | % | ± | |
---|---|---|---|---|---|
Independent | Michael Brankin | 1,852 | 55.5 | N/A | |
Independent | John Lipscombe | 1,599 | |||
Independent | Trevor Naylor | 1,520 | |||
Labour | Robin Franklin | 1,132 | 33.9 | N/A | |
Labour | Patricia Wordsworth | 956 | |||
Labour | Timothy Shepherd | 920 | |||
Conservative | Marjorie Cale-Morgan | 354 | 10.6 | N/A | |
Majority | 720 | 21.6 | N/A | ||
Turnout | 8,333 | 39.0 | N/A | ||
Independent win (new seat) | |||||
Party | Candidate | Votes | % | ± | |
---|---|---|---|---|---|
Independent | Malcolm Price | 1,259 | 52.2 | N/A | |
Independent | Malcolm Hall | 1,240 | |||
Independent | Donna Hollins | 1,152 | |||
Labour | Alice Cave | 937 | 38.8 | N/A | |
Labour | Peter Doyle | 863 | |||
Labour | Brian Swaine | 797 | |||
Conservative | Garry Needham | 217 | 9.0 | N/A | |
Majority | 322 | 13.3 | N/A | ||
Turnout | 6,465 | 33.1 | N/A | ||
Independent win (new seat) | |||||
Party | Candidate | Votes | % | ± | |
---|---|---|---|---|---|
Independent | Grace Brown | 1,299 | 41.7 | N/A | |
Labour | Margaret Sheard | 1,158 | 37.2 | N/A | |
Labour | Kenneth Richardson | 1,026 | |||
Labour | Beryl Oldroyd | 962 | |||
Independent | Steven Jones | 906 | |||
Independent | Michael Moore | 718 | |||
Conservative | Roger Hinchliff | 333 | 10.7 | N/A | |
BNP | Susan Harris | 326 | 10.5 | N/A | |
Majority | 141 | 4.5 | N/A | ||
Turnout | 6,728 | 35.2 | N/A | ||
Independent win (new seat) | |||||
Labour win (new seat) | |||||
Party | Candidate | Votes | % | ± | |
---|---|---|---|---|---|
Labour | Arthur Whittaker | 1,759 | 50.3 | N/A | |
Labour | Alex Vodden | 1,716 | |||
Labour | Leah Dorothy Higginbotton | 1,601 | |||
Independent | Frank Hardy | 1,020 | 29.1 | N/A | |
Independent | Antony Devoy | 709 | |||
Independent | Edward Devoy | 667 | |||
BNP | David Saxton | 411 | 11.7 | N/A | |
Conservative | Peter Murray | 310 | 8.9 | N/A | |
Majority | 739 | 21.1 | N/A | ||
Turnout | 8,193 | 37.8 | N/A | ||
Labour win (new seat) | |||||
Party | Candidate | Votes | % | ± | |
---|---|---|---|---|---|
Independent | Bill Gaunt | 1,551 | 43.1 | N/A | |
Independent | Sandra Birkinshaw | 1,531 | |||
Independent | Peter Middleton | 1,318 | |||
Labour | Philip Davies | 909 | 25.3 | N/A | |
Labour | Margaret Cawthorne | 862 | |||
Labour | William Denton | 759 | |||
Liberal Democrat | Tony Conway | 639 | 17.8 | N/A | |
BNP | John Lee | 273 | 7.6 | N/A | |
Conservative | Richard Morrell | 228 | 6.3 | N/A | |
Majority | 642 | 17.8 | N/A | ||
Turnout | 8,070 | 40.2 | N/A | ||
Independent win (new seat) | |||||
Party | Candidate | Votes | % | ± | |
---|---|---|---|---|---|
Conservative | Deborah Toon | 2,028 | 40.9 | N/A | |
Conservative | Alec Rowley | 1,940 | |||
Conservative | John Smith | 1,664 | |||
Labour | Jill Hayler | 1,341 | 27.0 | N/A | |
Liberal Democrat | Teresa Arundel | 1,147 | 23.1 | N/A | |
Labour | William Jones | 1,125 | |||
Labour | Robert Hannagan | 982 | |||
BNP | Geoffrey Broadley | 447 | 9.0 | N/A | |
Majority | 687 | 13.8 | N/A | ||
Turnout | 10,674 | 48.5 | N/A | ||
Conservative win (new seat) | |||||
Party | Candidate | Votes | % | ± | |
---|---|---|---|---|---|
Conservative | Brenda Hinchliff | 1,815 | 34.6 | N/A | |
Independent | George Punt | 1,779 | 33.9 | N/A | |
Conservative | Benedict Marsden | 1,391 | |||
Labour | Joseph Unsworth | 1,194 | 22.8 | N/A | |
Conservative | John Wilson | 797 | |||
Labour | Peter Keys | 597 | |||
Labour | John Clarke | 582 | |||
BNP | Kelly Thorpe | 456 | 8.7 | N/A | |
Majority | 36 | 0.7 | N/A | ||
Turnout | 8,611 | 43.8 | N/A | ||
Conservative win (new seat) | |||||
Independent win (new seat) | |||||
Conservative win (new seat) | |||||
Party | Candidate | Votes | % | ± | |
---|---|---|---|---|---|
Independent | Mary Brankin | 1,494 | 41.3 | N/A | |
Labour | Alan Schofield | 1,397 | 38.6 | N/A | |
Labour | James Andrews | 1,342 | |||
Independent | Alison Robinson | 1,330 | |||
Labour | Sharon Howard | 1,291 | |||
Independent | Geoffrey Howell | 1,242 | |||
BNP | Lorraine Lee | 383 | 10.6 | N/A | |
Conservative | Elizabeth Hill | 345 | 9.5 | N/A | |
Majority | 97 | 2.7 | N/A | ||
Turnout | 8,824 | 40.8 | N/A | ||
Independent win (new seat) | |||||
Labour win (new seat) | |||||
Party | Candidate | Votes | % | ± | |
---|---|---|---|---|---|
Labour | Graham Kyte | 1,510 | 43.7 | N/A | |
Labour | Bill Newman | 1,345 | |||
Labour | Howard Lavender | 1,266 | |||
Independent | Leslie Brooke | 952 | 27.6 | N/A | |
Conservative | Kathleen Leeds | 511 | 14.8 | N/A | |
BNP | Paul Harris | 480 | 13.9 | N/A | |
Majority | 558 | 16.2 | N/A | ||
Turnout | 6,064 | 34.9 | N/A | ||
Labour win (new seat) | |||||
Party | Candidate | Votes | % | ± | |
---|---|---|---|---|---|
Labour | Leonard Picken | 1,109 | 38.2 | N/A | |
Independent | Roy Butterwood | 1,055 | 36.3 | N/A | |
Labour | David Bostwick | 958 | |||
Labour | Pat Newman | 917 | |||
Independent | Jack Brown | 771 | |||
Liberal Democrat | Rhiannon Rees | 340 | 11.7 | N/A | |
BNP | June Gough | 245 | 8.4 | N/A | |
Conservative | Anne Campbell | 156 | 5.4 | N/A | |
Majority | 54 | 1.9 | N/A | ||
Turnout | 5,551 | 30.5 | N/A | ||
Labour win (new seat) | |||||
Independent win (new seat) | |||||
Labour win (new seat) | |||||
Party | Candidate | Votes | % | ± | |
---|---|---|---|---|---|
Independent | Fred Clowery | 1,163 | 41.0 | N/A | |
Labour | Karen Dyson | 1,162 | 41.0 | N/A | |
Independent | Jim Smith | 1,064 | |||
Labour | Geoffrey Hill | 974 | |||
Labour | Mick Dunlavey | 941 | |||
Independent | Peter Pleasants | 927 | |||
Independent | Brian Cookson | 583 | |||
Liberal Democrat | Jacqueline Walker | 345 | 12.2 | N/A | |
Independent | Frank Watson | 271 | |||
Conservative | Michael Toon | 165 | 5.8 | N/A | |
Majority | 1 | 0.0 | N/A | ||
Turnout | 7,595 | 36.9 | N/A | ||
Independent win (new seat) | |||||
Labour win (new seat) | |||||
Independent win (new seat) | |||||
Party | Candidate | Votes | % | ± | |
---|---|---|---|---|---|
Labour | Margaret Morgan | 1,431 | 36.5 | N/A | |
Labour | Richard Wraith | 1,324 | |||
Labour | Denise Wilde | 1,233 | |||
Independent | Arthur O'Loughlin | 890 | 22.7 | N/A | |
Liberal Democrat | Christopher Harding | 786 | 20.0 | N/A | |
BNP | Victoria Seeviour | 421 | 10.7 | N/A | |
Conservative | Angus Toon | 393 | 10.0 | N/A | |
Majority | 541 | 13.8 | N/A | ||
Turnout | 6,478 | 36.4 | N/A | ||
Labour win (new seat) | |||||
Party | Candidate | Votes | % | ± | |
---|---|---|---|---|---|
Labour | Terry Bristowe | 1,609 | 41.7 | N/A | |
Labour | James Rae | 1,526 | |||
Labour | Eunice Taylor | 1,284 | |||
Liberal Democrat | Patricia Durie | 866 | 22.4 | N/A | |
Independent | Stephen Hart | 817 | 21.2 | N/A | |
Conservative | Elizabeth Elders | 570 | 14.8 | N/A | |
Majority | 743 | 19.2 | N/A | ||
Turnout | 6,672 | 38.19 | N/A | ||
Labour win (new seat) | |||||
Elections to Barnsley Metropolitan Borough Council were held on 7 May 1998. One third of the council was up for election and the Labour party kept overall control of the council.
The 2008 Barnsley Metropolitan Borough Council election took place on 1 May 2008 to elect members of Barnsley Metropolitan Borough Council in South Yorkshire, England. One third of the council, alongside an additional vacancy in Old Town was up for election. Prior to the election the defending councillor in Penistone West, having earlier defected from Conservative to the Barnsley Independent Group, fought the election as an Independent. The Labour party stayed in overall control of the council.
The 1999 Barnsley Metropolitan Borough Council election took place on 6 May 1999 to elect members of Barnsley Metropolitan Borough Council in South Yorkshire, England. Prior to the election, the Liberal Democrats had gained a seat in Wombwell North from Labour. One third of the council was up for election and the Labour party stayed in overall control of the council.
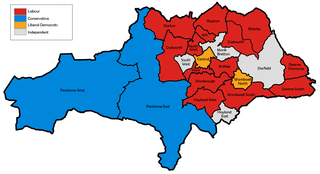
The 2000 Barnsley Metropolitan Borough Council election took place on 4 May 2000 to elect members of Barnsley Metropolitan Borough Council in South Yorkshire, England. Prior to the election, Labour has suffered a by-election loss in South West and two defections to Independent. One third of the council was up for election and the Labour party stayed in overall control of the council.
The 2002 Barnsley Metropolitan Borough Council election took place on 2 May 2002 to elect members of Barnsley Metropolitan Borough Council in South Yorkshire, England. One third of the council was up for election and the Labour party stayed in overall control of the council.
The 2003 Barnsley Metropolitan Borough Council election took place on 1 May 2003 to elect members of Barnsley Metropolitan Borough Council in South Yorkshire, England. One third of the council was up for election and the Labour party stayed in overall control of the council.
The 2006 Barnsley Metropolitan Borough Council election took place on 4 May 2006 to elect members of Barnsley Metropolitan Borough Council in South Yorkshire, England. One third of the council was up for election, with an extra vacancy in Penistone East caused by a resignation, and the Labour party stayed in overall control of the council.
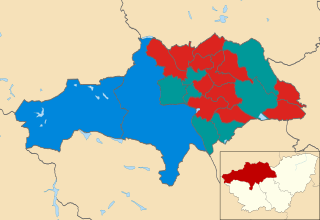
The 2007 Barnsley Metropolitan Borough Council election took place on 3 May 2007 to elect members of Barnsley Metropolitan Borough Council in South Yorkshire, England. One third of the council was up for election and the Labour party stayed in overall control of the council.
Elections to Barnsley Metropolitan Borough Council were held simultaneously with the general election on 3 May 1979. Following boundary changes that increased the number of wards by two to 22, with an additional 6 seats to 66 respectively), the entirety of the council was up for election. Labour retained control of the council.
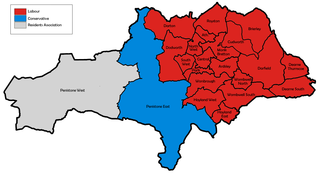
Elections to Barnsley Metropolitan Borough Council were held on 1 May 1980, with one third of the council up for election. Labour retained control of the council.
Elections to Barnsley Metropolitan Borough Council were held on 5 May 1983. One third of the council was up for election. Prior to the election the defending councillor in Darton had defected to Independent Labour from Residents. The election resulted in Labour retaining control of the council.
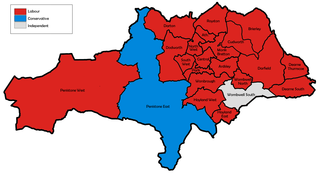
Elections to Barnsley Metropolitan Borough Council were held on 3 May 1984, with one third of the council up for election. Prior to the election, a Residents councillor in Dudsworth had defected to Labour. The election resulted in Labour retaining control of the council.
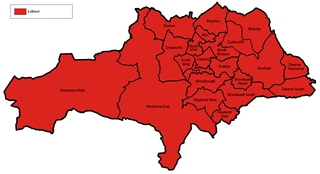
Elections to Barnsley Metropolitan Borough Council were held on 8 May 1986, with one third of the council up for election as well as vacancies in Athersley and South West wards. Prior to the election Labour gained a seat from Alliance in a Penistone East by-election. The election resulted in Labour retaining control of the council.
Elections to Barnsley Metropolitan Borough Council were held on 7 May 1987, with one third of the council up for election. Prior to the election, the defending councillor in Ardsley had won the seat for Labour in an uncontested by-election and subsequently defected to Independent Labour The election resulted in Labour retaining control of the council.
Elections to Barnsley Metropolitan Borough Council were held on 4 May 1990, with one third of the council up for election. The election resulted in Labour retaining control of the council.
Elections to Barnsley Metropolitan Borough Council were held on 2 May 1991, with one third of the council up for election. Prior to the election, the defending councillor in Penistone West had changed their affiliation from Residents to Independent, ending the Residents presence on the council that had endured since its creation in 1973. The election resulted in Labour retaining control of the council.
Elections to Barnsley Metropolitan Borough Council were held on 7 May 1992, with one third of the council up for election. The election resulted in Labour retaining control of the council.
Elections to Barnsley Metropolitan Borough Council were held on 5 May 1994, with one third of the council up for election. The election resulted in Labour retaining control of the council.
Elections to Barnsley Metropolitan Borough Council were held on 5 May 1995, with one third of the council up for election. The election resulted in Labour retaining control of the council.
Elections to Barnsley Metropolitan Borough Council were held on 3 May 1996, with one third of the council up for election. The election resulted in Labour retaining control of the council.