Cepstrum

Last updated • 7 min readFrom Wikipedia, The Free Encyclopedia

In Fourier analysis, the cepstrum ( /ˈkɛpstrʌm,ˈsɛp-,-strəm/ ; plural cepstra, adjective cepstral) is the result of computing the inverse Fourier transform (IFT) of the logarithm of the estimated signal spectrum. The method is a tool for investigating periodic structures in frequency spectra. The power cepstrum has applications in the analysis of human speech.

Contents

The term cepstrum was derived by reversing the first four letters of spectrum. Operations on cepstra are labelled quefrency analysis (or quefrency alanysis [1] ), liftering, or cepstral analysis. It may be pronounced in the two ways given, the second having the advantage of avoiding confusion with kepstrum.

Steps in forming cepstrum from time history Cepstrum signal analysis.png
Steps in forming cepstrum from time history

Origin

The concept of the cepstrum was introduced in 1963 by B. P. Bogert, M. J. Healy, and J. W. Tukey. [1] It serves as a tool to investigate periodic structures in frequency spectra. [2] Such effects are related to noticeable echos or reflections in the signal, or to the occurrence of harmonic frequencies (partials, overtones). Mathematically it deals with the problem of deconvolution of signals in the frequency space. [3]

References to the Bogert paper, in a bibliography, are often edited incorrectly.[ citation needed ] The terms "quefrency", "alanysis", "cepstrum" and "saphe" were invented by the authors by rearranging the letters in frequency, analysis, spectrum, and phase. The invented terms are defined in analogy to the older terms.

General definition

The cepstrum is the result of following sequence of mathematical operations:

Types

The cepstrum is used in many variants. Most important are:

The following abbreviations are used in the formulas to explain the cepstrum:

AbbreviationExplanation
Signal, which is a function of time
Cepstrum
Fourier transform: The abbreviation can stand i.e. for a continuous Fourier transform, a discrete Fourier transform (DFT) or even a z-transform, as the z-transform is a generalization of the DFT. [3]
Inverse of the fourier transform
Logarithm of x. The choice of the base b depends on the user. In some articles the base is not specified, others prefer base 10 or e. The choice of the base has no impact on the basic calculation rules, but sometimes base e leads to simplifications (see "complex cepstrum").
Absolute value, or magnitude of a complex value, which is calculated from real- and imaginary part using the Pythagorean theorem.
Absolute square
Phase angle of a complex value

Power cepstrum

The "cepstrum" was originally defined as power cepstrum by the following relationship: [1] [3]

The power cepstrum has main applications in analysis of sound and vibration signals. It is a complementary tool to spectral analysis. [2]

Sometimes it is also defined as: [2]

Due to this formula, the cepstrum is also sometimes called the spectrum of a spectrum. It can be shown that both formulas are consistent with each other as the frequency spectral distribution remains the same, the only difference being a scaling factor [2] which can be applied afterwards. Some articles prefer the second formula. [2] [4]

Other notations are possible due to the fact that the log of the power spectrum is equal to the log of the spectrum if a scaling factor 2 is applied: [5]

and therefore:

which provides a relationship to the real cepstrum (see below).

Further, it shall be noted, that the final squaring operation in the formula for the power spectrum is sometimes called unnecessary [3] and therefore sometimes omitted. [4] [2]

The real cepstrum is directly related to the power cepstrum:

It is derived from the complex cepstrum (defined below) by discarding the phase information (contained in the imaginary part of the complex logarithm). [4] It has a focus on periodic effects in the amplitudes of the spectrum: [6]

Complex cepstrum

The complex cepstrum was defined by Oppenheim in his development of homomorphic system theory. [7] [8] The formula is provided also in other literature. [2]

As is complex the log-term can be also written with as a product of magnitude and phase, and subsequently as a sum. Further simplification is obvious, if log is a natural logarithm with base e:

Therefore: The complex cepstrum can be also written as: [9]

The complex cepstrum retains the information about the phase. Thus it is always possible to return from the quefrency domain to the time domain by the inverse operation: [2] [3]

where b is the base of the used logarithm.

Main application is the modification of the signal in the quefrency domain (liftering) as an analog operation to filtering in the spectral frequency domain. [2] [3] An example is the suppression of echo effects by suppression of certain quefrencies. [2]

The phase cepstrum (after phase spectrum) is related to the complex cepstrum as

phase spectrum = (complex cepstrum − time reversal of complex cepstrum)2.

The independent variable of a cepstral graph is called the quefrency. [10] The quefrency is a measure of time, though not in the sense of a signal in the time domain. For example, if the sampling rate of an audio signal is 44100 Hz and there is a large peak in the cepstrum whose quefrency is 100 samples, the peak indicates the presence of a fundamental frequency that is 44100/100 = 441 Hz. This peak occurs in the cepstrum because the harmonics in the spectrum are periodic and the period corresponds to the fundamental frequency, since harmonics are integer multiples of the fundamental frequency. [11]

The kepstrum, which stands for "Kolmogorov-equation power-series time response", is similar to the cepstrum and has the same relation to it as expected value has to statistical average, i.e. cepstrum is the empirically measured quantity, while kepstrum is the theoretical quantity. It was in use before the cepstrum. [12] [13]

The autocepstrum is defined as the cepstrum of the autocorrelation. The autocepstrum is more accurate than the cepstrum in the analysis of data with echoes.

Playing further on the anagram theme, a filter that operates on a cepstrum might be called a lifter. A low-pass lifter is similar to a low-pass filter in the frequency domain. It can be implemented by multiplying by a window in the quefrency domain and then converting back to the frequency domain, resulting in a modified signal, i.e. with signal echo being reduced.

Interpretation

The cepstrum can be seen as information about the rate of change in the different spectrum bands. It was originally invented for characterizing the seismic echoes resulting from earthquakes and bomb explosions. It has also been used to determine the fundamental frequency of human speech and to analyze radar signal returns. Cepstrum pitch determination is particularly effective because the effects of the vocal excitation (pitch) and vocal tract (formants) are additive in the logarithm of the power spectrum and thus clearly separate. [14]

The cepstrum is a representation used in homomorphic signal processing, to convert signals combined by convolution (such as a source and filter) into sums of their cepstra, for linear separation. In particular, the power cepstrum is often used as a feature vector for representing the human voice and musical signals. For these applications, the spectrum is usually first transformed using the mel scale. The result is called the mel-frequency cepstrum or MFC (its coefficients are called mel-frequency cepstral coefficients, or MFCCs). It is used for voice identification, pitch detection and much more. The cepstrum is useful in these applications because the low-frequency periodic excitation from the vocal cords and the formant filtering of the vocal tract, which convolve in the time domain and multiply in the frequency domain, are additive and in different regions in the quefrency domain.

Note that a pure sine wave can not be used to test the cepstrum for its pitch determination from quefrency as a pure sine wave does not contain any harmonics and does not lead to quefrency peaks. Rather, a test signal containing harmonics should be used (such as the sum of at least two sines where the second sine is some harmonic (multiple) of the first sine, or better, a signal with a square or triangle waveform, as such signals provide many overtones in the spectrum.).

An important property of the cepstral domain is that the convolution of two signals can be expressed as the addition of their complex cepstra:

Applications

The concept of the cepstrum has led to numerous applications: [2] [3]

Recently, cepstrum-based deconvolution was used on surface electromyography signals, to remove the effect of the stochastic impulse train, which originates an sEMG signal, from the power spectrum of the sEMG signal itself. In this way, only information about the motor unit action potential (MUAP) shape and amplitude was maintained, which was then used to estimate the parameters of a time-domain model of the MUAP itself. [15]

A short-time cepstrum analysis was proposed by Schroeder and Noll in the 1960s for application to pitch determination of human speech. [16] [17] [14]

Related Research Articles

<span class="mw-page-title-main">Discrete Fourier transform</span> Type of Fourier transform in discrete mathematics

In mathematics, the discrete Fourier transform (DFT) converts a finite sequence of equally-spaced samples of a function into a same-length sequence of equally-spaced samples of the discrete-time Fourier transform (DTFT), which is a complex-valued function of frequency. The interval at which the DTFT is sampled is the reciprocal of the duration of the input sequence. An inverse DFT (IDFT) is a Fourier series, using the DTFT samples as coefficients of complex sinusoids at the corresponding DTFT frequencies. It has the same sample-values as the original input sequence. The DFT is therefore said to be a frequency domain representation of the original input sequence. If the original sequence spans all the non-zero values of a function, its DTFT is continuous, and the DFT provides discrete samples of one cycle. If the original sequence is one cycle of a periodic function, the DFT provides all the non-zero values of one DTFT cycle.

<span class="mw-page-title-main">Frequency modulation</span> Encoding of information in a carrier wave by varying the instantaneous frequency of the wave

Frequency modulation (FM) is the encoding of information in a carrier wave by varying the instantaneous frequency of the wave. The technology is used in telecommunications, radio broadcasting, signal processing, and computing.

<span class="mw-page-title-main">Fourier analysis</span> Branch of mathematics

In mathematics, Fourier analysis is the study of the way general functions may be represented or approximated by sums of simpler trigonometric functions. Fourier analysis grew from the study of Fourier series, and is named after Joseph Fourier, who showed that representing a function as a sum of trigonometric functions greatly simplifies the study of heat transfer.

<span class="mw-page-title-main">Phase noise</span> Frequency domain representation of random fluctuations in the phase of a waveform

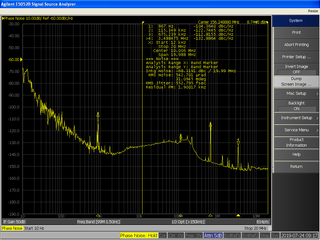
In signal processing, phase noise is the frequency-domain representation of random fluctuations in the phase of a waveform, corresponding to time-domain deviations from perfect periodicity (jitter). Generally speaking, radio-frequency engineers speak of the phase noise of an oscillator, whereas digital-system engineers work with the jitter of a clock.

<span class="mw-page-title-main">Fourier transform</span> Mathematical transform that expresses a function of time as a function of frequency

In physics, engineering and mathematics, the Fourier transform (FT) is an integral transform that takes as input a function and outputs another function that describes the extent to which various frequencies are present in the original function. The output of the transform is a complex-valued function of frequency. The term Fourier transform refers to both this complex-valued function and the mathematical operation. When a distinction needs to be made the Fourier transform is sometimes called the frequency domain representation of the original function. The Fourier transform is analogous to decomposing the sound of a musical chord into the intensities of its constituent pitches.

<span class="mw-page-title-main">Chirp</span> Frequency swept signal

A chirp is a signal in which the frequency increases (up-chirp) or decreases (down-chirp) with time. In some sources, the term chirp is used interchangeably with sweep signal. It is commonly applied to sonar, radar, and laser systems, and to other applications, such as in spread-spectrum communications. This signal type is biologically inspired and occurs as a phenomenon due to dispersion. It is usually compensated for by using a matched filter, which can be part of the propagation channel. Depending on the specific performance measure, however, there are better techniques both for radar and communication. Since it was used in radar and space, it has been adopted also for communication standards. For automotive radar applications, it is usually called linear frequency modulated waveform (LFMW).

<span class="mw-page-title-main">Spectral density</span> Relative importance of certain frequencies in a composite signal

In signal processing, the power spectrum of a continuous time signal describes the distribution of power into frequency components composing that signal. According to Fourier analysis, any physical signal can be decomposed into a number of discrete frequencies, or a spectrum of frequencies over a continuous range. The statistical average of any sort of signal as analyzed in terms of its frequency content, is called its spectrum.

<span class="mw-page-title-main">Ring modulation</span> Frequency mixing function in signal processing

In electronics, ring modulation is a signal processing function, an implementation of frequency mixing, in which two signals are combined to yield an output signal. One signal, called the carrier, is typically a sine wave or another simple waveform; the other signal is typically more complicated and is called the input or the modulator signal. A ring modulator is an electronic device for ring modulation. A ring modulator may be used in music synthesizers and as an effects unit.

In sound processing, the mel-frequency cepstrum (MFC) is a representation of the short-term power spectrum of a sound, based on a linear cosine transform of a log power spectrum on a nonlinear mel scale of frequency.

<span class="mw-page-title-main">Sine wave</span> Wave shaped like the sine function

A sine wave, sinusoidal wave, or sinusoid is a periodic wave whose waveform (shape) is the trigonometric sine function. In mechanics, as a linear motion over time, this is simple harmonic motion; as rotation, it corresponds to uniform circular motion. Sine waves occur often in physics, including wind waves, sound waves, and light waves, such as monochromatic radiation. In engineering, signal processing, and mathematics, Fourier analysis decomposes general functions into a sum of sine waves of various frequencies, relative phases, and magnitudes.

<span class="mw-page-title-main">Frequency domain</span> Signal representation

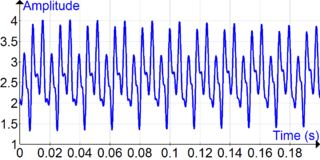
In mathematics, physics, electronics, control systems engineering, and statistics, the frequency domain refers to the analysis of mathematical functions or signals with respect to frequency, rather than time, as in time series. Put simply, a time-domain graph shows how a signal changes over time, whereas a frequency-domain graph shows how the signal is distributed within different frequency bands over a range of frequencies. A complex valued frequency-domain representation consists of both the magnitude and the phase of a set of sinusoids at the frequency components of the signal. Although it is common to refer to the magnitude portion as the frequency response of a signal, the phase portion is required to uniquely define the signal.

<span class="mw-page-title-main">Intermodulation</span> Non-linear effect in amplitude modulation

Intermodulation (IM) or intermodulation distortion (IMD) is the amplitude modulation of signals containing two or more different frequencies, caused by nonlinearities or time variance in a system. The intermodulation between frequency components will form additional components at frequencies that are not just at harmonic frequencies of either, like harmonic distortion, but also at the sum and difference frequencies of the original frequencies and at sums and differences of multiples of those frequencies.

Homomorphic filtering is a generalized technique for signal and image processing, involving a nonlinear mapping to a different domain in which linear filter techniques are applied, followed by mapping back to the original domain. This concept was developed in the 1960s by Thomas Stockham, Alan V. Oppenheim, and Ronald W. Schafer at MIT and independently by Bogert, Healy, and Tukey in their study of time series.

Stransform as a time–frequency distribution was developed in 1994 for analyzing geophysics data. In this way, the S transform is a generalization of the short-time Fourier transform (STFT), extending the continuous wavelet transform and overcoming some of its disadvantages. For one, modulation sinusoids are fixed with respect to the time axis; this localizes the scalable Gaussian window dilations and translations in S transform. Moreover, the S transform doesn't have a cross-term problem and yields a better signal clarity than Gabor transform. However, the S transform has its own disadvantages: the clarity is worse than Wigner distribution function and Cohen's class distribution function.

In mathematics, in the area of harmonic analysis, the fractional Fourier transform (FRFT) is a family of linear transformations generalizing the Fourier transform. It can be thought of as the Fourier transform to the n-th power, where n need not be an integer — thus, it can transform a function to any intermediate domain between time and frequency. Its applications range from filter design and signal analysis to phase retrieval and pattern recognition.

A pitch detection algorithm (PDA) is an algorithm designed to estimate the pitch or fundamental frequency of a quasiperiodic or oscillating signal, usually a digital recording of speech or a musical note or tone. This can be done in the time domain, the frequency domain, or both.

<span class="mw-page-title-main">Reassignment method</span>

The method of reassignment is a technique for sharpening a time-frequency representation by mapping the data to time-frequency coordinates that are nearer to the true region of support of the analyzed signal. The method has been independently introduced by several parties under various names, including method of reassignment, remapping, time-frequency reassignment, and modified moving-window method. The method of reassignment sharpens blurry time-frequency data by relocating the data according to local estimates of instantaneous frequency and group delay. This mapping to reassigned time-frequency coordinates is very precise for signals that are separable in time and frequency with respect to the analysis window.

In statistical signal processing, the goal of spectral density estimation (SDE) or simply spectral estimation is to estimate the spectral density of a signal from a sequence of time samples of the signal. Intuitively speaking, the spectral density characterizes the frequency content of the signal. One purpose of estimating the spectral density is to detect any periodicities in the data, by observing peaks at the frequencies corresponding to these periodicities.

In an electric power system, a harmonic of a voltage or current waveform is a sinusoidal wave whose frequency is an integer multiple of the fundamental frequency. Harmonic frequencies are produced by the action of non-linear loads such as rectifiers, discharge lighting, or saturated electric machines. They are a frequent cause of power quality problems and can result in increased equipment and conductor heating, misfiring in variable speed drives, and torque pulsations in motors and generators.

In signal processing it is useful to simultaneously analyze the space and frequency characteristics of a signal. While the Fourier transform gives the frequency information of the signal, it is not localized. This means that we cannot determine which part of a signal produced a particular frequency. It is possible to use a short time Fourier transform for this purpose, however the short time Fourier transform limits the basis functions to be sinusoidal. To provide a more flexible space-frequency signal decomposition several filters have been proposed. The Log-Gabor filter is one such filter that is an improvement upon the original Gabor filter. The advantage of this filter over the many alternatives is that it better fits the statistics of natural images compared with Gabor filters and other wavelet filters.

References

  1. 1 2 3 4 B. P. Bogert, M. J. R. Healy, and J. W. Tukey, The Quefrency Alanysis[sic] of Time Series for Echoes: Cepstrum, Pseudo Autocovariance, Cross-Cepstrum and Saphe Cracking, Proceedings of the Symposium on Time Series Analysis (M. Rosenblatt, Ed) Chapter 15, 209-243. New York: Wiley, 1963.
  2. 1 2 3 4 5 6 7 8 9 10 11 12 13 Norton, Michael Peter; Karczub, Denis (November 17, 2003). Fundamentals of Noise and Vibration Analysis for Engineers. Cambridge University Press. ISBN   0-521-49913-5.
  3. 1 2 3 4 5 6 7 8 D. G. Childers, D. P. Skinner, R. C. Kemerait, "The Cepstrum: A Guide to Processing", Proceedings of the IEEE, Vol. 65, No. 10, October 1977, pp. 1428–1443.
  4. 1 2 3 4 R.B. Randall: Cepstrum Analysis and Gearbox Fault Diagnosis, Brüel&Kjaer Application Notes 233-80, Edition 2. (PDF)
  5. 1 2 Beckhoff information system: TF3600 TC3 Condition Monitoring: Gearbox monitoring (online, 4.4.2020).
  6. "Real cepstrum and minimum-phase reconstruction - MATLAB rceps".
  7. A. V. Oppenheim, "Superposition in a class of nonlinear systems" Ph.D. diss., Res. Lab. Electronics, M.I.T. 1965.
  8. A. V. Oppenheim, R. W. Schafer, "Digital Signal Processing", 1975 (Prentice Hall).
  9. R.B. Randall:, "A history of cepstrum analysis and its application to mechanical problems", (PDF) in: Mechanical Systems and Signal Processing, Volume 97, December 2017 (Elsevier).
  10. Steinbuch, Karl W.; Weber, Wolfgang; Heinemann, Traute, eds. (1974) [1967]. Taschenbuch der Informatik – Band III – Anwendungen und spezielle Systeme der Nachrichtenverarbeitung (in German). Vol. 3 (3 ed.). Berlin, Germany: Springer Verlag. pp. 272–274. ISBN   3-540-06242-4. LCCN   73-80607.{{cite book}}: |work= ignored (help)
  11. "Introduction - Discrete Cepstrum". Support.ircam.fr. January 1, 1990. Retrieved September 16, 2022.
  12. "Predictive decomposition of time series with applications to seismic exploration", E. A. Robinson MIT report 1954; Geophysics 1967 vol. 32, pp. 418–484;
    "Use of the kepstrum in signal analysis", M. T. Silvia and E. A. Robinson, Geoexploration, volume 16, issues 1–2, April 1978, pages 55–73.
  13. "A kepstrum approach to filtering, smoothing and prediction with application to speech enhancement", T. J. Moir and J. F. Barrett, Proc. Royal Society A, vol. 459, 2003, pp. 2957–2976.
  14. 1 2 A. Michael Noll (1967), “Cepstrum Pitch Determination”, Journal of the Acoustical Society of America, Vol. 41, No. 2, pp. 293–309.
  15. G. Biagetti, P. Crippa, S. Orcioni, and C. Turchetti, “Homomorphic deconvolution for muap estimation from surface emg signals,” IEEE Journal of Biomedical and Health Informatics, vol. 21, no. 2, pp. 328– 338, March 2017.
  16. A. Michael Noll and Manfred R. Schroeder, "Short-Time 'Cepstrum' Pitch Detection," (abstract) Journal of the Acoustical Society of America, Vol. 36, No. 5, p. 1030
  17. A. Michael Noll (1964), “Short-Time Spectrum and Cepstrum Techniques for Vocal-Pitch Detection”, Journal of the Acoustical Society of America, Vol. 36, No. 2, pp. 296–302.

Further reading