Constant proportion portfolio insurance

Last updated
CPPI portfolios move more portfolio value to the risky asset as the distance between the portfolio value and the floor increases. As the total value of the portfolio decreases, less of the portfolio is allocated to the risky asset. Leverage may be employed by the investor depending on the multiplier value and the total portfolio value. CPPI Portfolio Percent in Risky Asset.jpg
CPPI portfolios move more portfolio value to the risky asset as the distance between the portfolio value and the floor increases. As the total value of the portfolio decreases, less of the portfolio is allocated to the risky asset. Leverage may be employed by the investor depending on the multiplier value and the total portfolio value.

Constant proportion portfolio investment (CPPI) is a trading strategy that allows an investor to maintain an exposure to the upside potential of a risky asset while providing a capital guarantee against downside risk. The outcome of the CPPI strategy is somewhat similar to that of buying a call option, but does not use option contracts. Thus CPPI is sometimes referred to as a convex strategy, as opposed to a "concave strategy" like constant mix.

Contents

CPPI products on a variety of risky assets have been sold by financial institutions, including equity indices and credit default swap indices. Constant proportion portfolio insurance (CPPI) was first studied by Perold (1986) [1] for fixed-income instruments and by Black and Jones (1987), [2] Black and Rouhani (1989), [3] and Black and Perold for equity instruments. [4]

In order to guarantee the capital invested, the seller of portfolio insurance maintains a position in a treasury bonds or liquid monetary instruments, together with a leveraged position in an "active asset", which constitutes the performance engine. Examples of risky assets are a basket of equity shares or a basket of mutual funds across various asset classes. While in the case of a bond+call, the client would only get the remaining proceeds (or initial cushion) invested in an option, bought once and for all, the CPPI provides leverage through a multiplier. This multiplier is set to 100 divided by the crash size (as a percentage) that is being insured against.

For example, say an investor has a $100 portfolio, a floor of $90 (price of the bond to guarantee his $100 at maturity) and a multiplier of 5 (ensuring protection against a drop of at most 20% before rebalancing the portfolio). Then on day one, the writer will allocate (5 * ($100 – $90)) = $50 to the risky asset and the remaining $50 to the riskless asset (the bond). The exposure will be revised as the portfolio value changes, i.e., when the risky asset performs and with leverage multiplies by 5 the performance (or vice versa). Same with the bond. These rules are predefined and agreed once and for all during the life of the product. The allocation to the risky asset may vary during the life of the product. In case the active asset performance is negative, the values of the active asset and the CPPI strategy will decrease, and as a result the allocation of the strategy to the active asset will decrease. Should the exposure to the risky asset drop to zero or a very low level, then the CPPI is said to be deleveraged or cashed out. The CPPI strategy will then be fully allocated to the low risk asset until the product matures.

CPPI strategies aim at offering a capital protection to its investors. Compared to a bond + call strategy, the drawback of the CPPI is that it follows a buy high sell low strategy. Volatility will hurt the performance of the investment, and once the strategy has deleveraged, it never recovers and the investors have to wait until maturity to receive their initial investments. The benefit is that CPPI protection is much cheaper and less impacted by market movements.

A variation of CPPI is the so-called Time Invariant Portfolio Protection Strategy (TIPP) where the capital is (partially) protected continuously (typically on a daily basis) as opposed to a protection at a fixed date in the future.

Some definitions

The bond floor is the value below which the value of the CPPI portfolio should never fall in order to be able to ensure the payment of all future due cash flows (including notional guarantee at maturity).

Unlike a regular bond + call strategy which only allocates the remaining dollar amount on top of the bond value (say the bond to pay 100 is worth 80, the remaining cash value is 20), the CPPI leverages the cash amount. The multiplier is usually 4 or 5, meaning you do not invest 80 in the bond and 20 in the equity, rather m*(100-bond) in the equity and the remainder in the zero coupon bond.

A measure of the proportion of the equity part compared to the cushion, or (CPPI-bond floor)/equity. Theoretically, this should equal 1/multiplier and the investor uses periodic rebalancing of the portfolio to attempt to maintain this.

Dynamic trading strategy

If the gap remains between an upper and a lower trigger band (resp. releverage and deleverage triggers), the strategy does not trade. It effectively reduces transaction costs, but the drawback is that whenever a trade event to reallocate the weights to the theoretical values happen, the prices have either shifted quite a bit high or low, resulting in the CPPI effectively buying (due to leverage) high and selling low.

As dynamic trading strategies assume that capital markets trade in a continuous fashion, gap risk is the main concern of CPPI writer, since a sudden drop in the risky underlying trading instrument(s) could reduce the overall CPPI net asset value below the value of the bond floor needed to guarantee the capital at maturity. In the models initially introduced by Black and Jones [2] Black & Rouhani, [3] this risk does not materialize: to measure it one needs to take into account sudden moves (jumps) in prices. [5] Such sudden price moves may make it impossible to shift the position from the risky assets to the bond, leading the structure to a state where it is impossible to guarantee principal at maturity. With this feature being ensured by contract with the buyer, the writer has to put up money of his own to cover for the difference (the issuer has effectively written a put option on the structure NAV). Banks generally charge a small "protection" or "gap" fee to cover this risk, usually as a function of the notional leveraged exposure.

Dynamics of a CPPI Portfolio

Fundamentally, the CPPI strategy can be understood as where is the value of assets in the risky portfolio, is the starting value of assets in the total portfolio, is the asset level below which the total portfolio should not fall, and is the multiplier. Because the percentage of the portfolio invested in the risky asset at any given time can vary, the dynamics of a CPPI strategy are complex. The average return and variance of a CPPI strategy across investment period are [6]

where and are the average return and variance of the risky asset, respectively, and .

Practical CPPI

In some CPPI structured products, the multipliers are constant. Say for a 3 asset CPPI, we have a ratio of x:y:100%-x-y as the third asset is the safe and riskless equivalent asset like cash or bonds. At the end of each period, the exposure is rebalanced. Say we have a note of $1 million, and the initial allocations are 100k, 200k, and 700k. After period one, the market value changes to 120k:80k:600k. We now rebalance to increase exposure on the outperforming asset and reduce exposure to the worst-performing asset. Asset A is the best performer, so its rebalanced to be left at 120k, B is the worst performer, to its rebalanced to 60k, and C is the remaining, 800k-120k-60k=620k. We are now back to the original fixed weights of 120:60:620 or ratio-wise 2:1:remaining.

Related Research Articles

In economics and finance, arbitrage is the practice of taking advantage of a difference in prices in two or more markets – striking a combination of matching deals to capitalise on the difference, the profit being the difference between the market prices at which the unit is traded. When used by academics, an arbitrage is a transaction that involves no negative cash flow at any probabilistic or temporal state and a positive cash flow in at least one state; in simple terms, it is the possibility of a risk-free profit after transaction costs. For example, an arbitrage opportunity is present when there is the possibility to instantaneously buy something for a low price and sell it for a higher price.

<span class="mw-page-title-main">Capital asset pricing model</span> Model used in finance

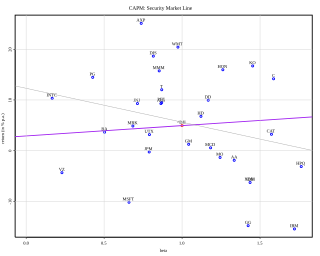
In finance, the capital asset pricing model (CAPM) is a model used to determine a theoretically appropriate required rate of return of an asset, to make decisions about adding assets to a well-diversified portfolio.

In financial mathematics, the put–call parity defines a relationship between the price of a European call option and European put option, both with the identical strike price and expiry, namely that a portfolio of a long call option and a short put option is equivalent to a single forward contract at this strike price and expiry. This is because if the price at expiry is above the strike price, the call will be exercised, while if it is below, the put will be exercised, and thus in either case one unit of the asset will be purchased for the strike price, exactly as in a forward contract.

<span class="mw-page-title-main">Risk premium</span> Measure of excess

A risk premium is a measure of excess return that is required by an individual to compensate being subjected to an increased level of risk. It is used widely in finance and economics, the general definition being the expected risky return less the risk-free return, as demonstrated by the formula below.

Rational pricing is the assumption in financial economics that asset prices – and hence asset pricing models – will reflect the arbitrage-free price of the asset as any deviation from this price will be "arbitraged away". This assumption is useful in pricing fixed income securities, particularly bonds, and is fundamental to the pricing of derivative instruments.

Modern portfolio theory (MPT), or mean-variance analysis, is a mathematical framework for assembling a portfolio of assets such that the expected return is maximized for a given level of risk. It is a formalization and extension of diversification in investing, the idea that owning different kinds of financial assets is less risky than owning only one type. Its key insight is that an asset's risk and return should not be assessed by itself, but by how it contributes to a portfolio's overall risk and return. The variance of return is used as a measure of risk, because it is tractable when assets are combined into portfolios. Often, the historical variance and covariance of returns is used as a proxy for the forward-looking versions of these quantities, but other, more sophisticated methods are available.

In finance, the beta is a statistic that measures the expected increase or decrease of an individual stock price in proportion to movements of the stock market as a whole. Beta can be used to indicate the contribution of an individual asset to the market risk of a portfolio when it is added in small quantity. It refers to an asset's non-diversifiable risk, systematic risk, or market risk. Beta is not a measure of idiosyncratic risk.

Floating rate notes (FRNs) are bonds that have a variable coupon, equal to a money market reference rate, like SOFR or federal funds rate, plus a quoted spread. The spread is a rate that remains constant. Almost all FRNs have quarterly coupons, i.e. they pay out interest every three months. At the beginning of each coupon period, the coupon is calculated by taking the fixing of the reference rate for that day and adding the spread. A typical coupon would look like 3 months USD SOFR +0.20%.

In finance, Jensen's alpha is used to determine the abnormal return of a security or portfolio of securities over the theoretical expected return. It is a version of the standard alpha based on a theoretical performance instead of a market index.

In finance, interest rate immunization is a portfolio management strategy designed to take advantage of the offsetting effects of interest rate risk and reinvestment risk.

In finance, leverage, also known as gearing, is any technique involving borrowing funds to buy an investment.

Alpha is a measure of the active return on an investment, the performance of that investment compared with a suitable market index. An alpha of 1% means the investment's return on investment over a selected period of time was 1% better than the market during that same period; a negative alpha means the investment underperformed the market. Alpha, along with beta, is one of two key coefficients in the capital asset pricing model used in modern portfolio theory and is closely related to other important quantities such as standard deviation, R-squared and the Sharpe ratio.

In finance and investing, rebalancing of investments is a strategy of bringing a portfolio that has deviated away from one's target asset allocation back into line. This can be implemented by transferring assets, that is, selling investments of an asset class that is overweight and using the money to buy investments in a class that is underweight, but it also applies to adding or removing money from a portfolio, that is, putting new money into an underweight class, or making withdrawals from an overweight class.

Dynamic asset allocation is a strategy used by investment products such as hedge funds, mutual funds, credit derivatives, index funds, principal protected notes and other structured investment products to achieve exposure to various investment opportunities and provide 100% principal protection.

In finance, diversification is the process of allocating capital in a way that reduces the exposure to any one particular asset or risk. A common path towards diversification is to reduce risk or volatility by investing in a variety of assets. If asset prices do not change in perfect synchrony, a diversified portfolio will have less variance than the weighted average variance of its constituent assets, and often less volatility than the least volatile of its constituents.

The following outline is provided as an overview of and topical guide to finance:

In corporate finance, Hamada’s equation is an equation used as a way to separate the financial risk of a levered firm from its business risk. The equation combines the Modigliani–Miller theorem with the capital asset pricing model. It is used to help determine the levered beta and, through this, the optimal capital structure of firms. It was named after Robert Hamada, the Professor of Finance behind the theory.

A fund derivative is a financial structured product related to a fund, normally using the underlying fund to determine the payoff. This may be a private equity fund, mutual fund or hedge fund. Purchasers obtain exposure to the underlying fund whilst improving their risk profile over a direct investment.

<span class="mw-page-title-main">Public–Private Investment Program for Legacy Assets</span>

On March 23, 2009, the United States Federal Deposit Insurance Corporation (FDIC), the Federal Reserve, and the United States Treasury Department announced the Public–Private Investment Program for Legacy Assets. The program is designed to provide liquidity for so-called "toxic assets" on the balance sheets of financial institutions. This program is one of the initiatives coming out of the implementation of the Troubled Asset Relief Program (TARP) as implemented by the U.S. Treasury under Secretary Timothy Geithner. The major stock market indexes in the United States rallied on the day of the announcement rising by over six percent with the shares of bank stocks leading the way. As of early June 2009, the program had not been implemented yet and was considered delayed. Yet, the Legacy Securities Program implemented by the Federal Reserve has begun by fall 2009 and the Legacy Loans Program is being tested by the FDIC. The proposed size of the program has been drastically reduced relative to its proposed size when it was rolled out.

Risk parity is an approach to investment management which focuses on allocation of risk, usually defined as volatility, rather than allocation of capital. The risk parity approach asserts that when asset allocations are adjusted to the same risk level, the risk parity portfolio can achieve a higher Sharpe ratio and can be more resistant to market downturns than the traditional portfolio. Risk parity is vulnerable to significant shifts in correlation regimes, such as observed in Q1 2020, which led to the significant underperformance of risk-parity funds in the Covid-19 sell-off.

References

Articles

  1. André F. Perold (August 1986). "Constant Proportion Portfolio Insurance", Harvard Business School.
  2. 1 2 Fischer Black; Robert W. Jones (Fall 1987). "Simplifying Portfolio Insurance". The Journal of Portfolio Management . 14 (1): 48–51. doi:10.3905/jpm.1987.409131. S2CID   154368130.
  3. 1 2 Fischer Black and Ramine Rouhani (1989). "Constant Proportion Portfolio Insurance and the Synthetic Put Option: A Comparison", Institutional Investor focus on Investment Management.
  4. Fischer Black and André F. Perold (1992), "Theory of Constant Proportion Portfolio Insurance", Journal of Economic Dynamics and Control, 16(3-4): 403-426.
  5. Rama Cont and Peter Tankov (July 2009), "Constant Proportion Portfolio Insurance in Presence of Jumps in Asset Prices", Mathematical Finance19(3): 379–401. doi:10.1111/j.1467-9965.2009.00377.x
  6. Zagst, Rudi; Kraus, Julia (2011-05-01). "Stochastic dominance of portfolio insurance strategies". Annals of Operations Research. 185 (1): 75–103. doi:10.1007/s10479-009-0549-9. hdl: 10.1007/s10479-009-0549-9 . ISSN   1572-9338. S2CID   5342800.

See also