Historical preview
The area of present-day Vojvodina had been inhabited since the Paleolithic period. Indo-European peoples moved into this area during three migration waves, which are dated in 4200 BC, 3300 BC, and 2800 BC, respectively. Before the Roman conquest in the 1st century BC, Indo-European peoples of Illyrian, Thracian, and Celtic origin inhabited the region.
During the Roman administration (which extended to Syrmia and Banat), the original inhabitants were heavily romanized, and would later be known as Vlachs. The region of Bačka, which did not belong to the Roman Empire, was populated by Iranian Sarmatians (Iazyges). After the end of Roman rule, the romanized inhabitants of the area escaped to the Balkan Mountains (where they mixed with South Slavs) as well as the Romanian Carpathians (later known as Romanians). [1]
The terriotroy of present-day Vojvodina was invaded by the Turanic nomads such as the Huns and Avars, as well as by the Germanic Goths, Gepids, and Lombards, but after their military defeat, they were quickly absorbed by the local (Slavic) population, without leaving much ethnic traces in the region's population.
During the early medieval migrations, Slavs (Severans, Abodrites, Braničevci, Timočani, and Serbs) settled in the territory of present-day Vojvodina in the 6th and 7th centuries. [2] Until the Hungarian conquest in the 10th century, the region had a dominant Slavic population. [3]
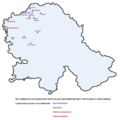
 Indo-Europeans in Vojvodina, antiquity
 Slavs in Vojvodina, 6th century
 Slavs in Vojvodina, 7th–8th century
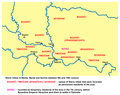 Slavs in Vojvodina, 9th century


The region was conquered by the Principality of Hungary in the 10th century, and Hungarians started to settle in the area. Hungarians mainly settled in the northern part of the region, where they lived mixed with Slavs. Until the late 12th and early 13th century, the region was mainly populated by Slavs, after which the proportions changed in favor of Hungarians. The larger number of Hungarians began settling in the region from the 13th century. The presence of Slavs in the area increased again in the 14th century with the arrival of Serbs from the south. During the Hungarian administration, much of the native local Slavs were Magyarization. [4] Initially, the Hungarian language was spoken only by the knights and nobility of the Kingdom of Hungary, but it was later adopted also by the rest of the population. [4] By the opinion of some researchers, the non-Magyarized descendants of these local Slavs are the present-day Šokci. [5]
Although Serbs were part of the aboriginal Slavic population in the territory of present-day Vojvodina, especially in Syrmia, an increasing number of Serbsbegan settling from the 14th century onwards. Because of the presence of the large Serb population, many historical records and maps from the 15th to the 18th century refer to the territory of present-day Vojvodina as Raška.
The Ottoman Empire took control of Vojvodina in the 16th century, and this caused a massive depopulation of the region. Most of the Hungarians and many local Slavs fled from the region and escaped to the north. The majority of those who left in the region were Serbs, mainly now engaging either in farming or in Ottoman military service.
Under Ottoman policy, many Serbs were newly settled in the region. During the Ottoman administration, Serbs comprised an absolute majority of region's population. [6] Villages were populated exclusively by Serbs, while towns were populated by various ethnic and religious groups, including mainly Muslims, but also some Serbs, Cincars, Greeks, Jews, and Roma. [7]
The Habsburg monarchy took control of Vojvodina by the Treaty of Karlowitz (1699) and Treaty of Passarowitz (1718). Following the establishment of the Habsburg administration, the Muslim population fled from the region. Some of these Muslim refugees were resettled in Bosnia and Herzegovina. During the Habsburg administration, many new Serb settlers from the Ottoman Empire immigrated to the region. In 1687, the northern parts of the region were settled by ethnic Bunjevci.
Many other non-Serb settlers were also settled in the territory of present-day Vojvodina during the 18th and 19th century. These settlers were mainly Germans and Hungarians, but also included Rusyns, Slovaks, Romanians, and others. Because of this immigration, Serbs were no longer the absolute ethnic majority in the region, and Vojvodina became one of the most ethnically diverse regions of Europe. Nevertheless, Serbs remained the largest ethnic group in the region. According to the 1910 census, Serbs comprised 33.8% of the population in the territory of present-day Vojvodina. After Serbs, the most numerous ethnic groups were Hungarians (comprising 28.1%) and Germans (comprising 21.4%).
In 1918, Vojvodina became part of the Kingdom of Serbs, Croats, and Slovenes and new Serb settlers came to the region. As a consequence of the World War II, most Vojvodina Germans (about 200,000) left Vojvodina together with the defeated German Army. [8] Those who remained in the region were confined to prison camps until 1948, when the camps were dissolved and Yugoslav citizenship was returned to the Germans. [9] Despite this, the remaining German population would leave Yugoslavia for economic reasons, moving to Germany, other European countries, or the United States. In their place, new South Slavic (Serb, Montenegrin, Macedonian, Croat, etc.) colonists would settle in the region. Serbs regained the absolute majority in Vojvodina with 51% of the population in 1948, rising to 68% nowadays.
 Ethnic map of Bačka, 1715
 Ethnic map of Bačka, 1720
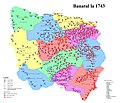 Ethnic map of Banat, 1743
 Ethnic map of Banat, 1774