Demographics of Tokyo Last updated December 06, 2025
Demographics of Tokyo Population Fertility rate
The demography of Tokyo is analysed by the Tokyo Metropolitan Government and data is produced for each of the Special wards of Tokyo , the Western Tokyo and the Tokyo Islands , and for all of Tokyo prefecture as a whole. [ 1] Statistical information is produced about the size and geographical breakdown of the population, the number of people entering and leaving country and the number of people in each demographic subgroup. As of 2025, the total population of Tokyo is 14,195,730 and had the largest population (11.5 percent of the total population). [ 2] [ 3]
History Population of South-Kanto Prefectures (Greater Tokyo area ) Historical population Year 1920 3,699,428 — 1925 4,485,144 +21.2% 1930 5,408,678 +20.6% 1935 6,369,919 +17.8% 1940 7,354,971 +15.5% 1945 3,488,284 −52.6% 1950 6,277,500 +80.0% 1955 8,037,084 +28.0% 1960 9,683,802 +20.5% 1965 10,869,244 +12.2% 1970 11,408,071 +5.0% 1975 11,673,554 +2.3% 1980 11,618,281 −0.5% 1985 11,829,363 +1.8% 1990 11,855,563 +0.2% 1995 11,773,605 −0.7% 2000 12,064,101 +2.5% 2005 12,576,601 +4.2% 2010 13,159,388 +4.6% 2015 13,515,271 +2.7% 2020 13,982,112 +3.5%
Emperor Meiji was brought from Kyoto to lead the Meiji Restoration , which formed a new imperial government. [ 4] The population reached two million in 1905. [ 5] Tokyo's population continued to grow from 3.7 million in 1920, when the first census was taken, to 4,48 million in 1925. In 1923, the Great Kanto earthquake caused 75% of all buildings suffered severe structural damage. Although 2% to 3% of the population were killed the population still grew. [ 6] [ 7] The Population reached 7.35 million in 1940, but fell during World War II to 3.49 million in 1945.
Migration boom In the postwar era and an increase in the number of births due to the first baby boom , the population rapidly increased from 3.49 million to 6.28 million between 1945 and 1950, and continued to grow thereafter, although the rate of increase slowed, until it reached 11.67 million in 1975. The population remained almost flat from 1975 to 1995, but then began to increase, reaching 13.16 million in 2010. [ 8]
Internal migration to Tokyo has steadily increased since 2022 following a brief slowdown during the COVID-19 pandemic . [ 9] The trend resumed after the pandemic. [ 10]
Vital statistics Population of Tokyo, 1872-2016 The number of births in Tokyo peaked in the post-war period at 240,000 in 1967, remaining at around 230,000 until 1973, after which it began to decline, remaining at around 100,000 since 1989. Meanwhile, the number of deaths has been on a gradual increase since 1956, reaching a post-war high of 110,000 in 2013. Looking at the trends in natural increase/decrease (births - deaths), with the exception of 1945, the number of births has consistently exceeded the number of deaths since 1920, but the natural increase has shrunk since peaking in 1967, and in 2012 the number of deaths exceeded the number of births for the first time since the war. [ 11] [ 12]
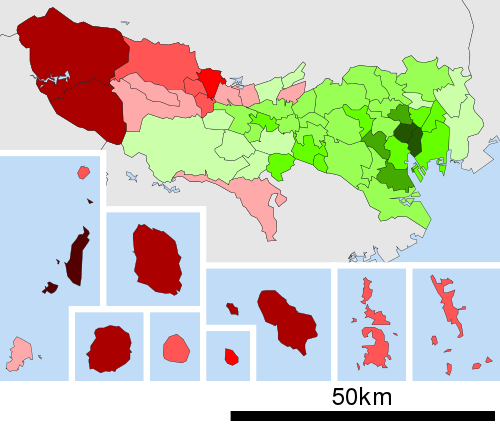
Migration Growth rate map of municipalities of Tokyo Metropolis, Japan 2005-2010 2015-2020Increase 10.0 % and over
7.5 - 9.99 %
5.0 - 7.49 %
2.5 - 4.99 %
0.0 - 2.49 %
Decrease 0.0 - 2.49 %
2.5 - 4.99 %
5.0 - 7.49 %
7.5 - 9.99 %
10.0 % and below
Domestic migration [ 17]
Inter-prefecture migration Year Net change In-migration Out-migration 1956 167,882 546,543 378,661 1957 198,726 586,610 387,884 1958 183,505 584,337 400,832 1959 184,074 607,219 423,145 1960 169,533 628,000 458,467 1961 146,975 640,883 493,908 1962 113,357 670,924 557,567 1963 94,163 687,226 593,063 1964 34,880 689,503 654,623 1965 33,121 703,747 670,626 1966 11,335 700,172 688,837 1967 - 20,648 682,510 703,158 1968 - 43,930 696,221 740,151 1969 - 67,456 680,411 747,867 1970 - 100,142 668,483 768,625 1971 - 91,200 668,594 759,794 1972 - 121,081 649,026 770,107 1973 - 166,029 627,156 793,185 1974 - 155,839 565,001 720,840 1975 - 125,956 541,685 667,641 1976 - 125,229 529,407 654,636 1977 - 104,261 528,011 632,272 1978 - 102,280 513,497 615,777 1979 - 99,738 510,541 610,279 1980 - 92,482 490,980 583,462 1981 - 61,105 488,051 549,156 1982 - 37,463 491,394 528,857 1983 - 8,358 495,198 503,556 1984 145 486,139 485,994 1985 4,851 485,208 480,357 1986 - 6,129 486,672 492,801 1987 - 55,491 474,706 530,197 1988 - 71,570 455,801 527,371 1989 - 61,055 454,815 515,870 1990 - 50,441 453,116 503,557 1991 - 36,917 447,461 484,378 1992 - 51,186 434,519 485,705 1993 - 68,433 424,367 492,800 1994 - 60,951 420,050 481,001 1995 - 33,692 430,369 464,061 1996 - 6,963 431,545 438,508 1997 16,184 435,693 419,509 1998 30,704 440,098 409,394 1999 36,624 436,805 400,181 2000 53,245 444,118 390,873 2001 68,457 449,888 381,431 2002 72,050 442,925 370,875 2003 64,859 441,013 376,154 2004 71,558 433,270 361,712 2005 78,847 436,245 357,398 2006 78,545 435,453 356,908 2007 79,973 440,944 360,971 2008 71,242 421,538 350,296 2009 54,537 412,219 357,682 2010 45,290 394,518 349,228 2011 39,334 392,991 353,657 2012 53,686 398,615 344,929 2013 68,312 429,785 361,473 2014 73,385 429,278 355,893 2015 82,479 454,043 371,564 2016 72,339 442,537 370,198 2017 71,041 451,124 380,083 2018 77,908 457,880 379,972 2019 80,741 463,761 383,020 2020 29,618 431,175 401,557 2021 3,897 418,957 415,060 2022 35,563 438,782 403,219 2023 65,781 453,424 387,643
Multiculturalism Pie chart of the population group breakdown of Tokyo (2024)
Japanese nationals (95.4%) Foreign nationals (4.60%) Foreign population in Tokyo (as of January 1 of each year) [ 18] [ 19]
Foreign residents by nationality Japanese and foreign nationals in Tokyo population pyramid in 2020 Total China South Korea Viet Nam Philippines Nepal Taiwan US Myanmar India Indonesia Others 2020 577,329 231,196 93,595 38,227 33,818 26,150 20,998 19,129 10,056 13,689 5,232 85,239 2021 546,436 219,636 87,590 36,636 33,214 24,572 18,675 18,173 9,345 13,378 5,331 79,886 2022 517,881 203,348 83,171 34,388 32,523 24,482 17,297 17,223 10,883 13,049 5,319 76,198 2023 581,112 230,294 85,595 37,055 33,817 28,325 19,522 19,575 13,884 15,996 7,214 89,835 2024 647,416 257,198 87,955 44,087 35,634 35,310 21,771 20,217 19,868 17,537 9,719 98,120
Foreign residents by district 1979 1984 1989 1994 1999 2004 2009 2010 2011 2012 2013 2014 2015 2016 2017 2018 2019 2020 2021 2022 Tokyo 110,862 128,046 203,677 269,889 273,978 355,289 408,284 418,116 422,226 406,096 390,674 394,410 417,442 449,042 486,346 521,500 551,683 577,329 546,436 517,881 Special Wards 93,328 108,683 178,372 228,277 228,557 295,819 340,130 348,857 353,219 339,448 327,266 330,586 350,863 378,642 410,650 439,959 465,191 485,967 456,873 430,444 Chiyoda 3,188 3,464 1,858 1,290 1,334 1,839 2,710 2,660 2,700 2,637 2,550 2,457 2,484 2,554 2,665 2,813 2,996 3,228 3,057 2,814 Chuo 459 618 703 1,085 1,442 2,715 4,877 4,909 5,031 4,977 4,947 4,916 5,153 5,547 6,176 6,991 7,651 8,474 8,291 8,062 Minato 7,563 9,739 11,315 12,068 14,017 17,154 22,354 21,826 21,706 20,620 18,853 18,104 18,420 18,486 18,992 19,522 20,057 20,314 18,718 16,929 Shinjuku 5,488 8,096 16,961 19,213 20,210 29,143 33,555 35,211 35,805 33,568 33,574 34,121 36,016 38,585 41,235 42,428 43,068 42,598 37,827 33,907 Bunkyo 2,669 3,265 5,079 5,512 5,305 6,506 7,179 7,276 7,508 7,352 6,935 7,087 7,696 8,333 9,174 9,887 10,808 11,635 10,333 9,746 Taito 3,098 3,230 5,116 5,329 6,348 9,882 11,817 12,411 12,863 12,662 12,503 12,802 13,248 14,034 14,600 14,862 15,433 15,757 14,788 13,896 Sumida 1,821 2,268 3,645 5,233 5,364 7,982 9,200 9,558 9,802 9,558 9,213 9,309 9,865 10,673 11,495 12,063 12,645 12,979 12,431 11,892 Koto 3,653 4,376 6,560 8,773 8,741 13,753 18,664 20,331 21,479 21,157 20,889 21,234 22,766 24,329 26,077 27,898 29,472 31,021 30,392 29,275 Shinagawa 3,841 4,753 7,280 9,041 8,322 9,995 11,833 11,872 11,604 11,274 10,566 10,446 10,663 11,020 11,742 12,234 13,042 13,900 13,342 12,538 Meguro 3,696 4,097 5,951 7,473 7,377 8,118 7,979 7,667 7,506 7,369 6,949 6,982 7,386 7,775 8,094 8,521 9,102 9,673 9,195 8,794 Ota 5,958 6,404 9,074 12,631 13,191 16,015 18,231 18,770 18,473 18,165 18,200 18,545 19,353 20,204 21,599 22,860 24,199 25,287 24,122 23,102 Setagaya 6,186 7,005 9,493 14,041 13,426 15,067 15,704 16,026 16,298 15,686 14,827 14,845 15,693 16,883 18,196 19,931 21,379 23,034 22,164 21,028 Shibuya 5,343 5,929 7,977 9,406 9,241 11,421 11,148 10,381 10,192 9,834 9,445 8,880 9,091 9,507 9,825 10,241 10,639 11,266 10,577 9,779 Nakano 2,991 3,611 8,473 12,088 10,346 11,484 11,656 12,185 12,636 11,418 10,610 10,949 12,283 13,872 15,693 17,956 19,326 20,095 17,809 15,759 Suginami 4,127 4,494 8,570 11,861 10,360 11,357 11,475 11,524 11,342 10,773 10,489 10,709 11,421 12,798 14,543 16,352 17,722 18,576 16,735 15,203 Toshima 3,619 5,049 14,654 15,386 13,452 16,833 17,163 18,575 19,868 19,324 19,065 19,533 21,616 24,540 27,060 29,010 30,223 29,672 26,458 24,200 Kita 2,592 3,152 7,950 10,035 10,069 13,743 15,530 16,176 16,063 15,451 14,248 14,558 16,005 17,609 19,552 20,954 22,621 23,550 22,271 21,470 Arakawa 5,985 5,892 7,705 9,486 9,604 13,026 15,709 15,508 15,869 15,667 15,313 15,559 16,188 16,885 17,831 18,564 19,131 19,298 18,264 17,570 Itabashi 2,884 3,363 7,949 12,140 11,842 15,364 17,625 18,471 18,355 17,337 16,234 16,714 18,022 20,147 22,667 24,719 26,759 28,782 27,254 25,663 Nerima 3,224 3,704 6,757 10,063 10,080 12,351 13,735 13,999 13,912 13,017 12,740 12,858 13,552 14,662 16,422 18,240 19,653 21,490 20,128 18,829 Adachi 7,998 8,553 12,048 16,117 17,039 21,431 23,222 23,291 23,443 23,059 22,282 22,516 23,679 25,541 27,417 29,726 31,706 34,040 33,606 33,138 Katsushika 3,799 3,885 5,659 7,717 8,244 11,297 14,175 14,527 14,832 14,163 13,719 13,966 14,969 16,545 18,768 20,730 21,849 23,126 22,363 21,630 Edogawa 3,146 3,736 7,595 12,289 13,203 19,343 24,589 25,703 25,932 24,380 23,115 23,496 25,294 28,113 30,827 33,457 35,710 38,172 36,748 35,220 Western Tokyo 17,376 19,148 25,016 41,046 44,758 58,539 67,237 68,334 68,079 65,745 62,590 62,957 65,657 69,386 74,633 80,364 85,300 90,092 88,306 86,138 Hachioji 1,136 1,334 1,870 3,925 4,801 7,610 8,939 9,292 9,162 9,072 8,983 9,020 9,475 10,060 11,113 12,219 12,936 13,210 13,137 12,821 Tachikawa 1,471 1,357 1,442 2,231 2,483 3,235 3,576 3,685 3,622 3,504 3,294 3,197 3,298 3,563 3,859 4,114 4,374 4,598 4,650 4,723 Musashino 858 934 1,377 2,260 2,176 2,439 2,396 2,397 2,330 2,297 2,180 2,277 2,480 2,583 2,817 3,038 3,240 3,364 3,223 3,083 Mitaka 1,099 1,179 1,758 2,585 2,693 2,871 3,204 3,103 3,107 2,976 2,844 2,794 2,958 3,013 3,376 3,635 3,813 3,943 3,673 3,516 Ome 257 235 438 1,348 1,114 1,310 1,553 1,551 1,626 1,592 1,445 1,421 1,454 1,566 1,646 1,775 1,877 1,955 1,986 2,037 Fuchu 1,145 1,202 1,664 2,550 3,058 3,836 4,403 4,544 4,475 4,279 4,106 4,110 4,277 4,468 4,676 4,940 5,302 5,604 5,312 5,106 Akishima 1,232 1,219 1,225 1,772 1,901 2,159 2,200 2,237 2,187 2,130 2,010 2,048 2,192 2,327 2,467 2,606 2,688 2,784 2,755 2,736 Chofu 1,991 2,100 2,454 3,004 3,159 3,543 3,952 4,018 4,062 3,853 3,550 3,534 3,633 3,799 4,037 4,348 4,629 4,824 4,550 4,385 Machida 847 1,217 1,625 2,304 2,790 4,052 5,410 5,342 5,303 5,076 4,747 4,780 4,902 5,144 5,505 5,852 6,228 6,862 7,090 7,259 Koganei 400 485 849 1,372 1,513 2,195 2,417 2,421 2,380 2,238 2,096 1,999 2,038 2,143 2,379 2,517 2,792 2,985 2,815 2,687 Kodaira 1,883 2,082 2,373 3,129 3,036 3,967 4,145 4,273 4,275 4,002 3,906 3,961 4,123 4,296 4,561 4,998 5,204 5,451 5,091 4,838 Hino 400 433 617 1,470 1,563 2,123 2,422 2,498 2,519 2,486 2,407 2,449 2,561 2,719 2,805 3,001 3,139 3,343 3,367 3,235 Higashimurayama 428 502 623 1,103 1,041 1,653 2,114 2,285 2,341 2,349 2,093 2,088 2,255 2,391 2,524 2,764 2,826 3,008 2,999 3,008 Kokubunji 302 351 581 1,005 1,149 1,535 1,705 1,707 1,749 1,667 1,635 1,675 1,731 1,838 1,910 2,088 2,365 2,572 2,567 2,526 Kunitachi 343 424 597 975 1,130 1,379 1,511 1,448 1,477 1,411 1,286 1,271 1,314 1,399 1,509 1,584 1,706 1,839 1,761 1,657 Fussa 739 716 821 1,443 1,788 2,256 2,376 2,427 2,398 2,443 2,400 2,533 2,712 3,025 3,359 3,662 3,816 3,809 3,621 3,382 Komae 276 281 397 630 608 799 926 973 960 933 909 975 1,018 1,088 1,168 1,282 1,312 1,408 1,359 1,302 Higashiyamato 277 364 486 691 692 829 1,014 1,057 1,045 1,038 1,011 1,046 1,074 1,087 1,090 1,130 1,157 1,185 1,201 1,208 Kiyose 156 171 248 482 554 784 978 1,044 1,039 1,004 967 993 1,077 1,112 1,136 1,216 1,262 1,308 1,335 1,308 Higashikurume 412 546 591 904 1,060 1,365 1,756 1,772 1,777 1,653 1,592 1,634 1,700 1,804 1,822 1,955 2,092 2,221 2,265 2,242 Musashimurayama 283 317 368 841 834 991 1,197 1,229 1,219 1,177 1,071 1,100 1,159 1,369 1,427 1,588 1,640 1,732 1,783 1,786 Tama 247 357 672 1,299 1,391 1,953 2,259 2,336 2,306 2,229 2,038 2,022 2,047 2,155 2,402 2,445 2,648 2,838 2,755 2,700 Inagi 211 245 329 524 731 865 1,123 1,088 1,108 1,087 1,082 1,082 1,115 1,110 1,183 1,231 1,321 1,448 1,451 1,506 Hamura 158 202 300 1,103 1,130 1,654 1,802 1,653 1,573 1,401 1,277 1,195 1,175 1,150 1,233 1,315 1,392 1,444 1,472 1,402 Akiruno 207 164 192 444 459 560 644 651 667 635 640 626 650 699 740 752 839 973 1,038 1,042 Nishitokyo 618 731 1,119 1,652 1,904 2,576 3,215 3,303 3,372 3,213 3,021 3,127 3,239 3,478 3,889 4,309 4,702 5,384 5,050 4,643
Social issues Marriage and divorce Marriage Divorce Average age at first marriage (husband) Average age at first marriage (wife) 1900 14,451 2,375 ... ... 1901 16,058 2,477 ... ... 1902 15,810 2,611 ... ... 1903 15,206 2,809 ... ... 1904 16,483 2,707 ... ... 1905 15,754 2,497 ... ... 1906 16,535 2,773 ... ... 1907 20,674 2,642 ... ... 1908 22,522 2,816 ... ... 1909 19,509 2,777 ... ... 1910 19,651 2,712 ... ... 1911 20,180 2,666 ... ... 1912 20,413 2,748 ... ... 1913 21,329 2,986 ... ... 1914 22,389 2,854 ... ... 1915 21,267 2,951 ... ... 1916 22,382 2,932 ... ... 1917 24,014 2,843 ... ... 1918 26,782 2,908 ... ... 1919 26,951 2,983 ... ... 1920 30,033 2,887 ... ... 1921 29,476 2,795 ... ... 1922 29,856 2,888 ... ... 1923 26,315 2,315 ... ... 1924 29,522 2,615 ... ... 1925 32,752 2,770 ... ... 1926 31,555 2,777 ... ... 1927 30,675 2,851 ... ... 1928 30,979 2,835 ... ... 1929 32,760 3,024 ... ... 1930 33,406 3,226 ... ... 1931 32,949 3,218 ... ... 1932 34,772 3,548 ... ... 1933 34,220 3,520 ... ... 1934 37,672 3,523 ... ... 1935 41,313 3,656 ... ... 1936 41,056 3,525 ... ... 1937 51,330 3,668 ... ... 1938 42,307 3,496 ... ... 1939 47,492 3,803 ... ... 1940 56,996 3,963 ... ... 1941 64,049 3,983 ... ... 1942 55,610 3,533 ... ... 1943 58,438 3,464 ... ... 1944 ... ... ... ... 1945 ... ... ... ... 1946 ... ... ... ... 1947 49,800 4,661 27.8 24.1 1948 59,128 5,386 27.8 24.2 1949 51,595 6,066 27.7 24.2 1950 51,362 6,646 27.7 24.3 1951 54,200 7,007 27.6 24.3 1952 57,118 7,005 27.7 24.4 1953 63,736 6,904 27.8 24.6 1954 69,486 7,573 27.9 24.7 1955 74,447 7,429 28.1 24.9 1956 76,970 7,285 28.1 25.0 1957 91,370 7,426 28.1 25.1 1958 101,297 7,705 28.1 25.1 1959 111,265 7,834 28.1 25.2 1960 119,495 7,719 28.1 25.2 1961 127,862 7,952 28.0 25.2 1962 137,106 8,449 27.9 25.2 1963 141,450 8,736 27.9 25.2 1964 145,117 8,989 27.9 25.1 1965 147,407 9,834 27.8 25.1 1966 141,049 10,302 27.8 25.1 1967 137,769 10,961 27.8 25.1 1968 137,597 10,993 27.8 25.1 1969 138,540 11,761 27.7 25.0 1970 140,748 12,297 27.5 24.9 1971 147,155 13,188 27.4 24.9 1972 145,712 13,999 27.3 24.9 1973 135,323 13,807 27.3 25.1 1974 121,513 14,053 27.4 25.3 1975 111,176 14,503 27.6 25.5 1976 101,939 15,002 27.9 25.7 1977 94,425 15,114 28.1 25.9 1978 90,222 15,394 28.3 26.0 1979 89,599 15,473 28.5 26.0 1980 87,922 15,969 28.6 26.1 1981 87,401 17,396 28.7 26.2 1982 87,699 18,077 28.8 26.2 1983 86,121 19,548 28.8 26.3 1984 83,139 19,239 28.9 26.3 1985 83,021 17,955 29.0 26.3 1986 79,960 18,271 29.1 26.5 1987 78,532 17,152 29.2 26.6 1988 79,276 16,884 29.2 26.6 1989 80,883 17,593 29.3 26.7 1990 81,920 17,935 29.3 26.7 1991 83,171 19,400 29.3 26.7 1992 82,371 20,211 29.3 26.9 1993 85,518 21,114 29.4 27.0 1994 83,563 21,372 29.5 27.1 1995 84,286 21,548 29.6 27.3 1996 84,007 22,273 29.7 27.4 1997 81,002 23,690 29.7 27.6 1998 82,589 25,685 29.9 27.7 1999 81,287 26,375 30.0 27.9 2000 87,360 27,032 30.1 28.0 2001 88,538 28,593 30.4 28.3 2002 84,623 28,780 30.5 28.4 2003 84,755 28,211 30.7 28.7 2004 84,618 27,123 30.9 28.9 2005 85,382 26,984 31.2 29.2 2006 89,413 26,347 31.3 29.3 2007 89,243 26,627 31.5 29.5 2008 91,196 26,300 31.5 29.6 2009 91,028 26,803 31.6 29.7 2010 91,197 26,335 31.8 29.9 2011 86,888 24,927 31.9 30.1 2012 89,301 25,329 32.1 30.3 2013 88,067 24,855 32.2 30.4 2014 87,000 23,653 32.3 30.5 2015 87,169 24,135 32.4 30.5 2016 86,010 23,470 32.3 30.5 2017 84,993 23,055 32.3 30.4 2018 82,716 22,706 32.3 30.4 2019 86,059 22,707 32.3 30.5 2020 73,931 20,783 32.1 30.4 2021 69,813 19,605 2022 75,179 19,255 2023 71,774 20,016
Health [ 1]
Infant mortality Infant mortality Year Number Rate 1906 10,214 180.0 1907 12,576 163.3 1908 14,160 189.4 1909 14,690 189.4 1910 14,138 173.8 1911 14,462 175.0 1912 13,507 157.6 1913 14,360 163.0 1914 14,467 155.8 1915 16,722 178.5 1916 16,327 178.9 1917 17,485 179.8 1918 17,878 187.8 1919 17,784 168.5 1920 18,456 167.6 1921 19,745 163.5 1922 19,144 158.6 1923 20,679 175.7 1924 17,166 139.0 1925 19,188 133.0 1926 17,301 125.5 1927 17,754 121.9 1928 19,658 129.1 1929 19,256 130.2 1930 14,768 97.5 1931 16,739 105.8 1932 14,640 90.8 1933 15,651 95.4 1934 14,505 94.2 1935 13,970 79.4 1936 13,442 78.8 1937 13,725 79.7 1938 13,343 84.7 1939 12,652 76.4 1940 11,462 59.5 1941 13,882 62.2 1942 14,047 62.8 1943 15,385 64.6 1944 ... ... 1945 ... ... 1946 ... ... 1947 9,813 62.4 1948 7,680 47.6 1949 7,874 47.0 1950 6,363 42.9 1951 5,809 42.3 1952 4,580 34.3 1953 4,681 37.2 1954 3,832 30.3 1955 3,408 26.7 1956 3,270 25.7 1957 3,441 26.2 1958 3,425 23.4 1959 3,491 22.8 1960 3,358 20.4 1961 3,458 20.1 1962 3,374 18.4 1963 3,006 15.5 1964 3,174 15.3 1965 3,053 13.5 1966 2,468 13.9 1967 2,786 11.8 1968 2,848 12.4 1969 2,741 12.0 1970 2,630 11.5 1971 2,551 11.0 1972 2,360 10.2 1973 2,218 9.8 1974 1,891 9.0 1975 1,654 8.9 1976 1,438 8.3 1977 1,236 7.5 1978 1,200 7.6 1979 1,075 7.2 1980 934 6.7 1981 836 6.1 1982 792 5.9 1983 718 5.4 1984 671 5.1 1985 622 4.9 1986 591 4.9 1987 559 4.7 1988 474 4.1 1989 474 4.5 1990 438 4.2 1991 400 3.9 1992 430 4.3 1993 467 4.8 1994 433 4.2 1995 423 4.4 1996 368 3.8 1997 384 3.9 1998 358 3.6 1999 325 3.3 2000 354 3.5 2001 298 3.0 2002 295 2.9 2003 293 3.0 2004 260 2.6 2005 257 2.7 2006 290 2.9 2007 278 2.7 2008 261 2.5 2009 246 2.3 2010 212 2.0 2011 216 2.0 2012 236 2.2 2013 215 2.0 2014 205 1.9 2015 189 1.7 2016 222 2.0 2017 169 1.6 2018 183 1.7 2019 146 1.4 2020 135 1.4 2021 160 1.7 2022 148 1.6 2023 135 1.6
Percentage surviving The percentage surviving, is the percent of the population that would survive to certain age, if their life conditions in a given year, were extrapolated to their whole life.
Data for 2020 . The values are rounded. Difference and ratio were calculated with raw data.
The percent of people in Tokyo surviving to certain ages by gender, 2020 Data source: National Institute of Population and Social Security Research [ 20]
References 1 2 "TOKYO STATISTICAL YEARBOOK|Statistics of Tokyo" . www.toukei.metro.tokyo.lg.jp . Retrieved 27 May 2025 . ↑ "Tokyo area's net population inflow accelerates in 2024" . The Japan Times . 31 January 2025. Retrieved 25 May 2025 . ↑ "Statistics Bureau Home Page/Population Estimates/Current Population Estimates as of October 1, 2024" . www.stat.go.jp . Retrieved 25 May 2025 . ↑ Steele, William (1990). "Edo in 1868: The View from Below". Monumenta Nipponica . 45 (2): 127– 155. doi :10.2307/2384846 . JSTOR 2384846 . ↑ David Peter Phillips, "Intersections of Modernity and Tradition: An Urban Planning History of Tokyo in the Early Meiji Period (1868–1888)." (PhD U. of Pennsylvania 1996; Dissertation Abstracts International (1996) 57#4 pp. 1879–1879.) ↑ Joshua Hammer, "Aftershocks," Smithsonian, (2001) 42#2 pp. 50–53 ↑ Joshua Hammer, Yokohama Burning: The Deadly 1923 Earthquake and Fire that Helped Forge the Path to World War II (2006) excerpt and text search ↑ "TOKYO City Profile and Government -TMG" . 都庁総合英語サイト . Retrieved 25 May 2025 . ↑ "Population Flow: People Moving to Tokyo in Greater Numbers" . nippon.com . 14 February 2025. Retrieved 25 May 2025 . ↑ Writer, Maki Sanbuichi / Yomiuri Shimbun Staff (18 February 2025). "Tokyo Population Inflow Rises Again, Mostly Young People and Women; Govt Promotes "Dual Residency" in Regional Areas" . japannews.yomiuri.co.jp . Retrieved 25 May 2025 . ↑ "8. 人 口 の 推 移 (明治9-昭和42年)" (PDF) . Retrieved 25 May 2025 . ↑ "2.13 東京都 Tokyo-to" (PDF) . Retrieved 25 May 2025 . ↑ 年次推移(東京都全体) 東京都福祉保健局 Bureau of Public Health . Retrieved 22 July 2022 . ↑ "Influx of single women drives Tokyo birth rate to lowest in Japan" . Nikkei Asia . Retrieved 25 May 2025 . ↑ Nakamura, Shoki (22 October 2024). "Tokyo Dream: Young Women's Migration and Japan's Population Challenge | JAPAN Forward" . japan-forward.com . Retrieved 25 May 2025 . ↑ "Tokyo finds itself alone in Japan with fertility rate under 1.00" . The Asahi Shimbun . 6 June 2024. ↑ "TOKYO STATISTICAL YEARBOOK TOKYO STATISTICAL YEARBOOK 2023 Population and Households|Statistics of Tokyo" . www.toukei.metro.tokyo.lg.jp . Retrieved 27 May 2025 . ↑ 東京都の人口(推計)トップページ Statistics of Tokyo . Retrieved 22 July 2022 . ↑ "Life in Tokyo:Your Guide" . 東京都生活文化スポーツ局 . 2024. 1 2 3 "The Japanese Mortality Database: Tokyo" . National Institute of Population and Social Security Research . 30 March 2025. Retrieved 29 May 2025 . This page is based on this
Wikipedia article Text is available under the
CC BY-SA 4.0 license; additional terms may apply.
Images, videos and audio are available under their respective licenses.