| |||||||||||||||||||||||||||||
One third (21 of 63) seats to Doncaster Metropolitan Borough Council 32 seats needed for a majority | |||||||||||||||||||||||||||||
---|---|---|---|---|---|---|---|---|---|---|---|---|---|---|---|---|---|---|---|---|---|---|---|---|---|---|---|---|---|
| |||||||||||||||||||||||||||||
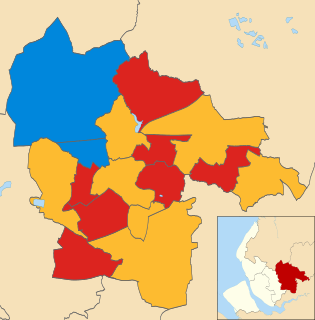
Map showing the results of the 2012 Doncaster Council elections. | |||||||||||||||||||||||||||||
|
The 2012 Doncaster Metropolitan Borough Council election took place on 3 May 2012 to elect one third of Doncaster Metropolitan Borough Council in South Yorkshire, England. [1] This was on the same day as other United Kingdom local elections, 2012.
Doncaster Metropolitan Borough Council is the local authority of the Metropolitan Borough of Doncaster in South Yorkshire, England. It is a metropolitan district council, one of four in South Yorkshire and one of 36 in the metropolitan counties of England, and provides the majority of local government services in Doncaster.
South Yorkshire is a metropolitan county in England. It is the southernmost county in the Yorkshire and the Humber region and had a population of 1.34 million in 2011. It has an area of 1,552 square kilometres (599 sq mi) and consists of four metropolitan boroughs, Barnsley, Doncaster, Rotherham and Sheffield. South Yorkshire was created on 1 April 1974 as a result of the Local Government Act 1972.Its largest settlement is Sheffield.
England is a country that is part of the United Kingdom. It shares land borders with Wales to the west and Scotland to the north-northwest. The Irish Sea lies west of England and the Celtic Sea lies to the southwest. England is separated from continental Europe by the North Sea to the east and the English Channel to the south. The country covers five-eighths of the island of Great Britain, which lies in the North Atlantic, and includes over 100 smaller islands, such as the Isles of Scilly and the Isle of Wight.
The Labour Party retained its control of the council with an increased majority after increasing its vote share by 21.7% and gaining three seats from the Liberal Democrats and five from various independents. The Conservatives held the three seats it was defending with a reduced vote share. After the election, the composition of the council was: [2]
The Labour Party is a centre-left political party in the United Kingdom which has been described as an alliance of social democrats, democratic socialists and trade unionists. The party's platform emphasises greater state intervention, social justice and strengthening workers' rights.
The Liberal Democrats are a liberal political party in the United Kingdom. They presently have 11 Members of Parliament in the House of Commons, 96 members of the House of Lords, and one member of the European Parliament. They also have five Members of the Scottish Parliament and a member each in the Welsh Assembly and London Assembly. The party reached the height of its influence in the early 2010s, forming a junior partner in a coalition government from 2010 to 2015. It is presently led by Vince Cable.
The Conservative Party, officially the Conservative and Unionist Party, is a centre-right political party in the United Kingdom. Presently led by Theresa May, it has been the governing party since 2010. It presently has 314 Members of Parliament in the House of Commons, 249 members of the House of Lords, and 18 members of the European Parliament. It also has 31 Members of the Scottish Parliament, 12 members of the Welsh Assembly, eight members of the London Assembly and 9,008 local councillors. One of the major parties of UK politics, it has formed the government on 45 occasions, more than any other party.
Party | Seats | Gains | Losses | Net gain/loss | Seats % | Votes % | Votes | +/− | |
---|---|---|---|---|---|---|---|---|---|
Labour | 16 | 8 | 0 | +8 | 50.9 | 34,603 | |||
Conservative | 3 | 0 | 0 | 0 | 18 | 12,247 | |||
Liberal Democrat | 1 | 0 | 3 | -3 | 8.3 | 5,621 | |||
Community Group | 1 | 0 | 0 | 0 | 2.4 | 1,618 | |||
Independent | 0 | 0 | 5 | -5 | 10.2 | 6,949 | |||
English Democrat | 0 | 0 | 0 | 0 | 7.8 | 5,276 | |||
UKIP | 0 | 0 | 0 | 0 | 0.9 | 643 | |||
Green | 0 | 0 | 0 | 0 | 0.8 | 575 | |||
Democratic Nationalists | 0 | 0 | 0 | 0 | 0.6 | 410 | |||
The results in each ward are shown below. Changes are compared with the previous election in 2008. Spoilt ballots are not included in the below results. [3]
Party | Candidate | Votes | % | ± | |
---|---|---|---|---|---|
Labour | Ted Kitchen | 2,058 | 76.2 | +24.8 | |
Liberal Democrat | Dave Farrell | 358 | 13.2 | −12.6 | |
Conservative | Kerry Wood | 286 | 10.6 | −5.2 | |
Majority | 1,700 | 62.9 | |||
Turnout | 2,702 | 25.3 | −4.0 | ||
Labour hold | Swing | ||||
Party | Candidate | Votes | % | ± | |
---|---|---|---|---|---|
Labour | Sue McGuinness | 1,677 | 52.5 | +23.3 | |
Independent | Scott Pickles | 1,289 | 40.4 | N/A | |
Conservative | Chris Allen | 226 | 7.1 | −5.9 | |
Majority | 388 | 12.2 | |||
Turnout | 3,192 | 29.2 | −2.1 | ||
Labour gain from Independent | Swing | ||||
Party | Candidate | Votes | % | ± | |
---|---|---|---|---|---|
Labour | Austen White | 2,269 | 70.4 | +38.3 | |
Conservative | Martin Greenhalgh | 954 | 29.6 | −0.7 | |
Majority | 1,315 | 40.8 | |||
Turnout | 3,223 | 33.3 | −4.6 | ||
Labour hold | Swing | ||||
Party | Candidate | Votes | % | ± | |
---|---|---|---|---|---|
Labour | Nuala Fennelly | 1,436 | 45.7 | +17.3 | |
Independent | Mark Thompson | 1,136 | 36.2 | −7.5 | |
Conservative | Richard Eaton | 435 | 13.8 | −2.0 | |
Liberal Democrat | Edwin Simpson | 135 | 4.3 | N/A | |
Majority | 300 | 9.5 | |||
Turnout | 3,142 | 28.3 | −3.7 | ||
Labour gain from Independent | Swing | ||||
Party | Candidate | Votes | % | ± | |
---|---|---|---|---|---|
Labour | Jane Nightingale | 1,750 | 64.5 | +26.4 | |
English Democrat | Barbara Hewitt | 681 | 25.1 | N/A | |
Conservative | Alexandra Allen | 282 | 10.4 | −6.4 | |
Majority | 1,069 | 39.4 | |||
Turnout | 2,713 | 27.4 | −4.1 | ||
Labour hold | Swing | ||||
Party | Candidate | Votes | % | ± | |
---|---|---|---|---|---|
Liberal Democrat | Monty Cuthbert | 1,764 | 42.5 | −9.9 | |
Labour | Paul Bissett | 1,230 | 29.6 | +15.2 | |
Conservative | Mark Wells | 623 | 15.0 | −13.5 | |
English Democrat | Glenn Bluff | 535 | 12.9 | N/A | |
Majority | 534 | 12.9 | |||
Turnout | 4,152 | 36.8 | −4.9 | ||
Liberal Democrat hold | Swing | ||||
Party | Candidate | Votes | % | ± | |
---|---|---|---|---|---|
Labour | Glyn Jones | 1,957 | 64.5 | +21.6 | |
English Democrat | Howard Dove | 533 | 17.6 | N/A | |
Conservative | Ian Hutchinson | 297 | 9.8 | −4.5 | |
Liberal Democrat | Barbara Bell | 226 | 7.5 | −25.9 | |
Majority | 1,424 | 47.0 | |||
Turnout | 3,033 | 26.0 | −6.5 | ||
Labour hold | Swing | ||||
Party | Candidate | Votes | % | ± | |
---|---|---|---|---|---|
Labour | Christine Mills | 2,420 | 87.3 | +26.9 | |
Conservative | Jonathan Broughton | 352 | 12.7 | −7.0 | |
Majority | 2,068 | 74.6 | |||
Turnout | 2,772 | 26.8 | −3.1 | ||
Labour hold | Swing | ||||
Party | Candidate | Votes | % | ± | |
---|---|---|---|---|---|
Labour | Pat Hall | 1,409 | 38.4 | +16.4 | |
English Democrat | Keith Hewitt | 731 | 19.9 | N/A | |
Liberal Democrat | Karen Hampson | 579 | 15.8 | −39.2 | |
Conservative | Barbara Fletcher | 518 | 14.1 | −9.0 | |
Independent | Karl Goodman | 437 | 11.9 | N/A | |
Majority | 678 | 18.5 | |||
Turnout | 3,674 | 34.6 | −2.9 | ||
Labour gain from Liberal Democrat | Swing | ||||
Party | Candidate | Votes | % | ± | |
---|---|---|---|---|---|
Labour | Phil Cole | 1,830 | 53.1 | +12.7 | |
Independent | Ray Mullis | 1,356 | 39.3 | −4.4 | |
Conservative | Liz Jones | 261 | 7.6 | −8.3 | |
Majority | 474 | 13.8 | |||
Turnout | 3,447 | 33.2 | −1.2 | ||
Labour gain from Independent | Swing | ||||
Party | Candidate | Votes | % | ± | |
---|---|---|---|---|---|
Conservative | Yvonne Woodcock | 1,803 | 40.3 | −8.4 | |
Labour | Thomas Scott-Chambers | 1,237 | 27.7 | +15.9 | |
English Democrat | Nigel Berry | 1,163 | 26.0 | +4.4 | |
Liberal Democrat | John Brown | 270 | 6.0 | −1.9 | |
Majority | 566 | 12.7 | |||
Turnout | 4,473 | 37.3 | −4.4 | ||
Conservative hold | Swing | ||||
Party | Candidate | Votes | % | ± | |
---|---|---|---|---|---|
Labour | Debbie Hutchinson | 2,378 | 62.2 | +34.5 | |
Conservative | Frank Calladine | 643 | 16.8 | −3.8 | |
Green | Stephen Platt | 575 | 15.0 | +3.4 | |
Liberal Democrat | John Butterfield | 227 | 5.9 | N/A | |
Majority | 1,735 | 45.4 | |||
Turnout | 3,823 | 32.8 | −3.6 | ||
Labour gain from Independent | Swing | ||||
Party | Candidate | Votes | % | ± | |
---|---|---|---|---|---|
Labour | Pat Haith | 1,049 | 32.9 | ? | |
English Democrat | Mick Glynn | 827 | 26.0 | N/A | |
Independent | Jessie Credland | 791 | 24.8 | −1.4 | |
Conservative | James Hart | 343 | 10.8 | −17.6 | |
Community Group | Stewart Rayner | 176 | 5.5 | −9.1 | |
Majority | 222 | +7.0 | |||
Turnout | 3,186 | 37.7 | +2.6 | ||
Labour hold | Swing | ||||
Party | Candidate | Votes | % | ± | |
---|---|---|---|---|---|
Labour | Tracey Leyland-Jepson | 1,577 | 55.6 | +23.1 | |
Independent | Andrew Pickering | 687 | 24.2 | N/A | |
Liberal Democrat | Malcolm Jevons | 472 | 16.7 | −38.8 | |
Conservative | Phyllis Calladine | 98 | 3.5 | −8.5 | |
Majority | 890 | 31.4 | |||
Turnout | 2,834 | 24.6 | −5.9 | ||
Labour gain from Liberal Democrat | Swing | ||||
Party | Candidate | Votes | % | ± | |
---|---|---|---|---|---|
Labour | Richard Cooper-Holmes | 1,581 | 56.3 | +30.5 | |
Independent | Terry Wilde | 880 | 31.3 | N/A | |
Conservative | Kathleen Beard | 240 | 8.5 | −5.3 | |
Liberal Democrat | Richard Johnson | 108 | 3.8 | N/A | |
Majority | 701 | 25.0 | |||
Turnout | 2,809 | 28.5 | −4.9 | ||
Labour gain from Independent | Swing | ||||
Party | Candidate | Votes | % | ± | |
---|---|---|---|---|---|
Conservative | Jonathan Wood | 1,637 | 46.6 | −7.8 | |
Labour | Peter Millar | 1,565 | 44.5 | +26.0 | |
Liberal Democrat | Diana Simpson | 312 | 8.9 | N/A | |
Majority | 72 | 2.0 | |||
Turnout | 3,514 | 37.9 | −2.2 | ||
Conservative hold | Swing | ||||
Party | Candidate | Votes | % | ± | |
---|---|---|---|---|---|
Labour | Ken Keegan | 1,627 | 65.8 | +30.1 | |
Conservative | Martin Drake | 436 | 17.6 | −4.6 | |
Democratic Nationalists | Dave Owen | 410 | 16.6 | N/A | |
Majority | 1,191 | +48.2 | |||
Turnout | 2,473 | 25.4 | −3.4 | ||
Labour hold | Swing | ||||
Party | Candidate | Votes | % | ± | |
---|---|---|---|---|---|
Community Group | Martin Williams | 1,442 | 46.7 | −3.6 | |
Labour | Susan Durant | 1,176 | 38.1 | +24.8 | |
Conservative | Richard Walker | 467 | 15.1 | +1.1 | |
Majority | 266 | 8.6 | |||
Turnout | 3,085 | 28.8 | −5.7 | ||
Community Group hold | Swing | ||||
Party | Candidate | Votes | % | ± | |
---|---|---|---|---|---|
Conservative | Bob Ford | 1,563 | 42.7 | −8.8 | |
Labour | Shane McAleavey | 1,112 | 30.4 | +16.0 | |
UKIP | Rebecca Walters | 643 | 17.6 | +10.9 | |
Liberal Democrat | David Adgar | 339 | 9.3 | −3.7 | |
Majority | 451 | 12.3 | |||
Turnout | 3,657 | 37.1 | −5.5 | ||
Conservative hold | Swing | ||||
Party | Candidate | Votes | % | ± | |
---|---|---|---|---|---|
Labour | Paul Wray | 1,569 | 49.0 | +20.5 | |
Liberal Democrat | Cliff Hampson | 831 | 25.9 | −12.5 | |
Conservative | Stephen Cox | 432 | 13.5 | −5.6 | |
Independent | Michelle Goodman | 373 | 11.6 | N/A | |
Majority | 738 | 23.0 | |||
Turnout | 3,205 | 31.4 | −3.3 | ||
Labour gain from Liberal Democrat | Swing | ||||
Party | Candidate | Votes | % | ± | |
---|---|---|---|---|---|
Labour | Eva Hughes | 1,696 | 59.4 | +22.0 | |
English Democrat | Roy Penketh | 806 | 28.3 | N/A | |
Conservative | Malcolm Knight | 351 | 12.3 | −7.6 | |
Majority | 890 | 31.2 | |||
Turnout | 2,853 | 29.1 | −4.4 | ||
Labour hold | Swing | ||||
Alongside the council election, and election took place to decide whether to have an elected mayor in Doncaster. Doncaster was one of the two cities on the night to vote 'Yes'.
Choice | Votes | % |
---|---|---|
42,196 | 61.7 | |
No | 25,879 | 37.8 |
Total votes | 68,075 | 100.00 |
Local government elections took place in England (only) on Thursday 4 May 2006. Polling stations were open between 7:00 and 22:00.
The 2000 St Helens Metropolitan Borough Council election took place on 4 May 2000 to elect members of St Helens Metropolitan Borough Council in Merseyside, England. One third of the council was up for election and the Labour party stayed in overall control of the council.
The 2006 St Helens Metropolitan Borough Council election took place on 4 May 2006 to elect members of St Helens Metropolitan Borough Council in Merseyside, England. One third of the council was up for election and the council stayed under no overall control.
The 2011 United Kingdom local elections were held on Thursday 5 May 2011. In England, direct elections were held in all 36 Metropolitan boroughs, 194 Second-tier district authorities, 49 unitary authorities and various mayoral posts, meaning local elections took place in all parts of England with the exception of seven unitary authorities, and seven districts and boroughs. For the majority of English districts and the 25 unitary authorities that are elected "all out" these were the first elections since 2007. In Northern Ireland, there were elections to all 26 local councils. Elections also took place to most English parish councils.
Elections to Broxtowe Borough Council were held on 5 May 2011 to elect all 44 members to the Council.
The 2010 Doncaster Metropolitan Borough Council election took place on 6 May 2010 to elect on third of Doncaster Metropolitan Borough Council in South Yorkshire, England as part of the 2010 United Kingdom local elections. The 2010 General Election also took place on the same day.
The 1999 Sandwell Metropolitan Borough Council election took place on 6 May 1999 to elect members of Sandwell Metropolitan Borough Council in the West Midlands, England. One third of the council was up for election and the Labour party stayed in overall control of the council.
The 2004 Basingstoke and Deane Council election took place on 10 June 2004 to elect members of Basingstoke and Deane Borough Council in Hampshire, England. One third of the council was up for election and the council stayed under no overall control.
The 2007 Walsall Metropolitan Borough Council election took place on 3 May 2007 to elect members of Walsall Metropolitan Borough Council in the West Midlands, England. One third of the council was up for election and the Conservative party stayed in overall control of the council.
The 2012 Rochdale Council election took place on 3 May 2012 to elect members of Rochdale Metropolitan Borough Council in the North West, England. This was on the same day as other United Kingdom local elections, 2012. The Labour Party won 17 of the 20 seats with 53% of the vote, with the other three going to the Conservative Party with 27% of the vote. The Liberal Democrats lost all 11 of their seats up for re-election with 15% of the vote. This election marked the return to the council of former Leaders Richard Farnell and Allen Brett. It also produced Rochdale's youngest ever councillor in Liam O'Rourke.
The 2013 United Kingdom local elections took place on Thursday 2 May 2013. Elections were held in 35 English councils: all 27 non-metropolitan county councils and eight unitary authorities, and in one Welsh unitary authority. Direct mayoral elections took place in Doncaster and North Tyneside. These elections last took place on the 4 June 2009 at the same time as the 2009 European Parliament Elections, except for County Durham, Northumberland and the Anglesey where elections last took place in 2008.
The 2003 Colchester Borough Council election took place on 1 May 2003 to elect members of Colchester Borough Council in Essex, England. This was the same day as the other 2003 United Kingdom local elections. One third of the seats were up for election and the council stayed under no overall control.
The 2014 Calderdale Metropolitan Borough Council election took place on 22 May 2014 to elect members of Calderdale Metropolitan Borough Council in England. This was on the same day as local elections across the United Kingdom and a European election. One councillor was elected in each of the 17 wards for a four-year term. There are three councillors representing each ward elected on a staggered basis so one third of the councillor seats were up for re-election. The seats had previously been contested in 2010 which was held in conjunction with a general election. The turnout was significantly lower in 2014 than in 2010 which is not unusual when comparing local elections that coincide with general elections to ones that do not. Prior to the election Labour was the largest party in the council with 21 out of 51 seats, 5 seats short of an overall majority. After the election there was no overall control of the council. Labour had 25 seats, only one short of a majority and so Labour continued to operate a minority administration.
The 2014 Doncaster Metropolitan Borough Council election took place on 22 May 2014 as part of the 2014 local elections in the United Kingdom. One third of 63 seats were up for election. The 2014 European Parliament Elections were also held on the same day.
The 2011 St Helens Metropolitan Borough Council election took place on 5 May 2011 to elect members of St Helens Metropolitan Borough Council in Merseyside, England. One third of the council was up for election and the Labour party stayed in overall control of the council.
The 2014 St Helens Metropolitan Borough Council election took place on 22 May 2014 to elect members of St Helens Metropolitan Borough Council in Merseyside, England. One third of the council was up for election and the Labour party stayed in overall control of the council.
The 2016 Calderdale Metropolitan Borough Council election took place on 5 May 2016 to elect members of Calderdale Metropolitan Borough Council in England. This was on the same day as other local elections. One councillor was elected in each ward for a four-year term so the councillors elected in 2016 last stood for election in 2012. Each ward is represented by three councillors, the election of which is staggered, so only one third of the councillors was elected in this election. Before the election there was no overall control with a minority Labour administration. After the election there was still no overall control so the minority Labour administration continued.
The 2017 United Kingdom local elections were held on Thursday 4 May 2017. Local elections were held across Great Britain, with elections to 35 English local authorities and all councils in Scotland and Wales.
Council elections in England were held on Thursday 3 May 2018. Elections were held in all 32 London boroughs, 34 metropolitan boroughs, 67 district and borough councils and 17 unitary authorities. There were also direct elections for the mayoralties of Hackney, Lewisham, Newham, Tower Hamlets and Watford.
The 2011 Doncaster Metropolitan Borough Council election took place on 5 May 2011 to elect one third of Doncaster Metropolitan Borough Council as part of the 2011 local elections in the United Kingdom.