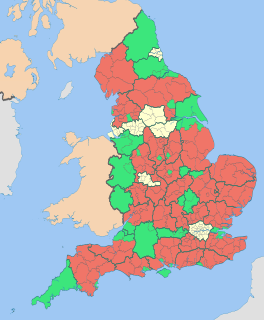
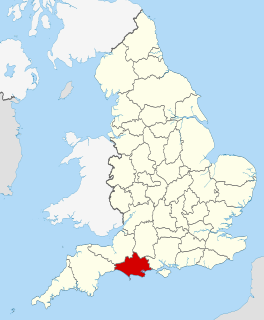
The 2003 East Dorset District Council election took place on 1 May 2003 to elect members of East Dorset District Council in Dorset, England. The whole council was up for election after boundary changes and the Conservative party stayed in overall control of the council. [1]
East Dorset is a local government district in Dorset, England. Its council is based in Wimborne Minster since 2016.
Non-metropolitan districts, or colloquially "shire districts", are a type of local government district in England. As created, they are sub-divisions of non-metropolitan counties in a two-tier arrangement.
Dorset is a county in South West England on the English Channel coast. The ceremonial county comprises the non-metropolitan county, which is governed by Dorset County Council, and the unitary authority areas of Poole and Bournemouth. Covering an area of 2,653 square kilometres (1,024 sq mi), Dorset borders Devon to the west, Somerset to the north-west, Wiltshire to the north-east, and Hampshire to the east. The county town is Dorchester which is in the south. After the reorganisation of local government in 1974 the county's border was extended eastward to incorporate the Hampshire towns of Bournemouth and Christchurch. Around half of the population lives in the South East Dorset conurbation, while the rest of the county is largely rural with a low population density.
Party | Seats | Gains | Losses | Net gain/loss | Seats % | Votes % | Votes | +/− | |
---|---|---|---|---|---|---|---|---|---|
Conservative | 24 | -2 | 66.7 | 59.9 | 24,753 | ||||
Liberal Democrat | 11 | +2 | 30.6 | 36.1 | 14,921 | ||||
Independent | 1 | 0 | 2.8 | 1.1 | 435 | ||||
Labour | 0 | 0 | 0 | 1.7 | 723 | ||||
Dorset Stop The War | 0 | 0 | 0 | 0.7 | 310 | ||||
UKIP | 0 | 0 | 0 | 0.5 | 195 |
Party | Candidate | Votes | % | ± | |
---|---|---|---|---|---|
Conservative | David Cozier | 530 | 75.8 | ||
Liberal Democrat | Benjamin Haynes | 169 | 24.2 | ||
Majority | 361 | 51.6 | |||
Turnout | 699 | 32.2 |
Party | Candidate | Votes | % | ± | |
---|---|---|---|---|---|
Conservative | Pauline Reynolds | 500 | 73.6 | ||
Liberal Democrat | David Roberts | 179 | 26.4 | ||
Majority | 321 | 47.3 | |||
Turnout | 679 | 32.6 |
Party | Candidate | Votes | % | ± | |
---|---|---|---|---|---|
Liberal Democrat | Janet Dover | 799 | |||
Liberal Democrat | Donald Wallace | 709 | |||
Conservative | Kevin Johnson | 480 | |||
Conservative | Peter Finney | 459 | |||
Independent | John Bell | 132 | |||
Labour | Kathryn Parish | 92 | |||
Turnout | 2,671 | 36.8 |
Party | Candidate | Votes | % | ± | |
---|---|---|---|---|---|
Conservative | David Packer | 456 | 58.4 | ||
Liberal Democrat | Elena Pujol | 325 | 41.6 | ||
Majority | 131 | 16.8 | |||
Turnout | 781 | 40.5 |
Party | Candidate | Votes | % | ± | |
---|---|---|---|---|---|
Liberal Democrat | John Holland | 707 | |||
Liberal Democrat | Byron Kimber | 652 | |||
Conservative | John Harrington | 442 | |||
Conservative | Peter Haward | 405 | |||
Turnout | 2,206 | 28.8 |
Party | Candidate | Votes | % | ± | |
---|---|---|---|---|---|
Liberal Democrat | Anne Holland | 456 | 71.3 | ||
Conservative | Andrew Russell | 184 | 28.8 | ||
Majority | 272 | 42.5 | |||
Turnout | 640 | 32.8 |
Party | Candidate | Votes | % | ± | |
---|---|---|---|---|---|
Liberal Democrat | Stewart Hearn | 441 | 63.3 | ||
Conservative | Michael Soper | 256 | 36.7 | ||
Majority | 185 | 26.5 | |||
Turnout | 697 | 35.1 |
Party | Candidate | Votes | % | ± | |
---|---|---|---|---|---|
Conservative | Timothy Palmer | 483 | 74.0 | ||
Liberal Democrat | Dora Aburrow | 170 | 26.0 | ||
Majority | 313 | 47.9 | |||
Turnout | 653 | 38.6 |
Party | Candidate | Votes | % | ± | |
---|---|---|---|---|---|
Conservative | Queenie Comfort | 1,035 | |||
Conservative | Derek Burt | 999 | |||
Liberal Democrat | Mary Angus | 337 | |||
Liberal Democrat | Percival Bartlett | 269 | |||
Turnout | 2,640 | 37.5 |
Party | Candidate | Votes | % | ± | |
---|---|---|---|---|---|
Conservative | Maureen Godfrey | 889 | |||
Conservative | John Little | 837 | |||
Liberal Democrat | Roger Angus | 303 | |||
Liberal Democrat | Philip Harknett | 240 | |||
Turnout | 2,269 | 29.5 |
Party | Candidate | Votes | % | ± | |
---|---|---|---|---|---|
Liberal Democrat | Pauline Bailey-Wright | 415 | 57.5 | ||
Conservative | Phyllis Packer | 307 | 42.5 | ||
Majority | 108 | 15.0 | |||
Turnout | 722 | 36.5 |
Party | Candidate | Votes | % | ± | |
---|---|---|---|---|---|
Conservative | Spencer Flower | 572 | 74.3 | ||
Liberal Democrat | Heather Gurney | 198 | 25.7 | ||
Majority | 374 | 48.6 | |||
Turnout | 770 | 40.7 |
Party | Candidate | Votes | % | ± | |
---|---|---|---|---|---|
Conservative | Gladys Elliot | 365 | 59.0 | ||
Liberal Democrat | Allan White | 254 | 41.0 | ||
Majority | 111 | 17.9 | |||
Turnout | 619 | 33.9 |
Party | Candidate | Votes | % | ± | |
---|---|---|---|---|---|
Conservative | Ronald Daw | 909 | |||
Conservative | Barbara Manuel | 895 | |||
Liberal Democrat | Helen Reay | 230 | |||
Liberal Democrat | Stephen Dix | 226 | |||
Labour | Christopher Hampton | 155 | |||
Turnout | 2,415 | 32.4 |
Party | Candidate | Votes | % | ± | |
---|---|---|---|---|---|
Conservative | Ann Warman | 1,102 | |||
Conservative | Michael Dyer | 1,014 | |||
Liberal Democrat | Deirdre Briggs | 227 | |||
UKIP | Allan Tallett | 195 | |||
Liberal Democrat | Lilian Rowe | 183 | |||
Labour | Duncan Finch | 129 | |||
Turnout | 2,850 | 38.4 |
Party | Candidate | Votes | % | ± | |
---|---|---|---|---|---|
Conservative | Raymond Dudman | 781 | 81.9 | ||
Liberal Democrat | Dennis Truscott | 173 | 18.1 | ||
Majority | 608 | 63.7 | |||
Turnout | 954 | 47.0 |
Party | Candidate | Votes | % | ± | |
---|---|---|---|---|---|
Conservative | George Russell | 541 | 80.9 | ||
Liberal Democrat | Mario Rouse | 128 | 19.1 | ||
Majority | 413 | 61.7 | |||
Turnout | 669 | 34.6 |
Party | Candidate | Votes | % | ± | |
---|---|---|---|---|---|
Liberal Democrat | Elizabeth Guinn | 334 | 56.6 | ||
Conservative | John Moore | 256 | 43.4 | ||
Majority | 78 | 13.2 | |||
Turnout | 590 | 30.5 |
Party | Candidate | Votes | % | ± | |
---|---|---|---|---|---|
Independent | Victor Redpath | 243 | 57.9 | ||
Liberal Democrat | Carol Bond | 177 | 42.1 | ||
Majority | 66 | 15.7 | |||
Turnout | 420 | 22.7 |
Party | Candidate | Votes | % | ± | |
---|---|---|---|---|---|
Conservative | Toni Coombs | 809 | |||
Conservative | Josephine Staunton-Lambert | 684 | |||
Liberal Democrat | Peter Baker | 481 | |||
Liberal Democrat | Adam Reay | 408 | |||
Turnout | 2,382 | 34.0 |
Party | Candidate | Votes | % | ± | |
---|---|---|---|---|---|
Conservative | Boyden Mortimer | 386 | 53.8 | ||
Liberal Democrat | Lindsey Dedden | 271 | 37.8 | ||
Independent | Derrick Crisp | 60 | 8.4 | ||
Majority | 115 | 16.0 | |||
Turnout | 717 | 35.8 |
Party | Candidate | Votes | % | ± | |
---|---|---|---|---|---|
Conservative | Edward Burt | 776 | |||
Conservative | Lucy Clark | 762 | |||
Liberal Democrat | Michael Daymond | 617 | |||
Liberal Democrat | Poppy Baker | 611 | |||
Turnout | 2,766 | 40.1 |
Party | Candidate | Votes | % | ± | |
---|---|---|---|---|---|
Conservative | Alexander Clarke | 1,525 | |||
Conservative | David Durley | 1,511 | |||
Conservative | Andrew Skeats | 1,368 | |||
Liberal Democrat | Jeanne Roberts | 402 | |||
Liberal Democrat | Alan Dedden | 375 | |||
Liberal Democrat | Frank Gardiner | 372 | |||
Labour | Michael Shine | 347 | |||
Turnout | 5,901 | 34.0 |
Party | Candidate | Votes | % | ± | |
---|---|---|---|---|---|
Liberal Democrat | Patricia Hymers | 1,224 | |||
Liberal Democrat | David Morgan | 968 | |||
Liberal Democrat | Marilyn Osner | 891 | |||
Conservative | Ivy Ellis | 833 | |||
Conservative | Alan Flint | 775 | |||
Conservative | Christine Reaks | 627 | |||
Dorset Stop The War | Damien Stone | 194 | |||
Dorset Stop The War | Geoffrey Stone | 116 | |||
Turnout | 5,628 | 35.8 |
South West England is a constituency of the European Parliament. From 2009 it elects 6 MEPs using the d'Hondt method of party-list proportional representation, reduced from 7 in 2009.
Christchurch Borough Council in Dorset, England is elected every four years. Since the last boundary changes in 2003, 24 councillors have been elected from 11 wards.
West Berkshire is a unitary authority in Berkshire, England. Until 1 April 1998 it was a non-metropolitan district.
East Hampshire District Council in Hampshire England is elected every four years. Since the last boundary changes in 2003, 44 councillors have been elected from 38 wards.
One third of Purbeck District Council in Dorset, England is elected each year, followed by one year where there is an election to Dorset County council.
One-third of Weymouth and Portland District Council in Dorset, England, is elected each year, followed by one year where there is an election to Dorset County Council instead.
East Dorset District Council in Dorset, England is elected every four years. Since the last boundary changes in 2015, 29 councillors have been elected from 16 wards.
North East Lincolnshire Council is the local authority of North East Lincolnshire. It is a unitary authority, having the powers of a non-metropolitan county and district council combined. It was established following the abolition of Humberside County Council on 1 April 1996.. The council provides a full range of local government services including Council Tax billing, libraries, social services, processing planning applications, waste collection and disposal, and it is a local education authority.
The 2015 United Kingdom local elections were held on Thursday 7 May 2015, the same day as the general election for the House of Commons of the United Kingdom.
The 1999 East Dorset District Council election took place on 6 May 1999 to elect members of East Dorset District Council in Dorset, England. The whole council was up for election and the Conservative party gained overall control of the council from the Liberal Democrats.
The 2007 East Dorset District Council election took place on 3 May 2007 to elect members of East Dorset District Council in Dorset, England. The whole council was up for election and the Conservative party stayed in overall control of the council.
The 2011 East Dorset District Council election took place on 5 May 2011 to elect members of East Dorset District Council in Dorset, England. The whole council was up for election and the Conservative party stayed in overall control of the council.
The 2003 Torridge District Council election took place on 1 May 2003 to elect members of Torridge District Council in Devon, England. The whole council was up for election after boundary changes and the council stayed under no overall control.
The 2007 Torridge District Council election took place on 3 May 2007 to elect members of Torridge District Council in Devon, England. The whole council was up for election and independents lost overall control of the council to no overall control.
The 2015 East Dorset District Council election took place on 7 May 2015 in order to elect members of the East Dorset District Council in Dorset, England. The whole council was up for election after boundary changes reduced the number of seats by seven. The Conservative party stayed in overall control of the council.
The 2003 Christchurch Borough Council election took place on 1 May 2003 to elect members of Christchurch Borough Council in Dorset, England. The whole council was up for election after boundary changes reduced the number of seats by one. The Conservative party stayed in overall control of the council.
West Dorset District Council is elected every four years by the first past the post system of election. The council currently consists of 44 councillors, representing 24 electoral divisions. The Conservative Party is currently the largest party on the council, having gained overall control in the 2003 local elections. The council meets at South Walks House in Dorchester, having moved to the new council headquarters in 2014.
Local elections in the United Kingdom are scheduled to be held on Thursday 2 May 2019, contesting about 270 English local councils, six directly elected mayors in England, and all 11 local councils in Northern Ireland. Additionally, there will be by-elections for a number of local authority seats.