The 1997 United Kingdom general election was held on Thursday, 1 May 1997. The governing Conservative Party led by Prime Minister John Major was defeated in a landslide by the opposition Labour Party led by Tony Blair, achieving a 179-seat majority and a total of 418 seats, the highest ever won by Labour as of June 2024.
Plaid Cymru is a centre-left to left-wing, Welsh nationalist political party in Wales, committed to Welsh independence from the United Kingdom.

The 1992 United Kingdom general election was held on Thursday 9 April 1992, to elect 651 members to the House of Commons. The election resulted in the fourth consecutive victory for the Conservative Party since 1979, with a majority of 21 and would be the last time that the Conservatives would win an overall majority at a general election until 2015. It was also the last general election to be held on a day which did not coincide with any local elections until 2017. This election result took many by surprise, as opinion polling leading up to the election day had shown a narrow but consistent lead for the Labour Party under leader Neil Kinnock.

The 1929 United Kingdom general election was held on Thursday, 30 May 1929 and resulted in a hung parliament. Ramsay MacDonald's Labour Party won the most seats in the House of Commons for the first time despite receiving fewer votes than the Conservative Party, led by Prime Minister Stanley Baldwin. The Liberal Party, led again by former Prime Minister David Lloyd George, regained some of the ground lost in the 1924 general election and held the balance of power. Parliament was dissolved on 10 May.
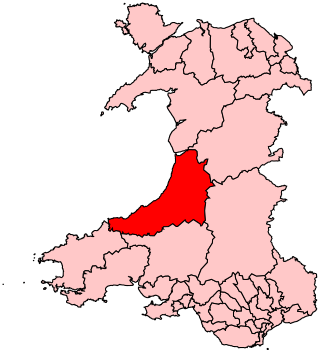
Ceredigion was a parliamentary constituency represented in the House of Commons of the UK Parliament. Created in 1536, the franchise expanded in the late 19th century and on the enfranchisement of women. Its boundaries remained virtually unchanged until 1983. From 1536 until 1885 the area had two seats : a county constituency (Cardiganshire) comprising the rural areas, the other the borough constituency known as the Cardigan District of Boroughs comprising a few separate towns; in 1885 the latter was abolished, its towns and electors incorporated into the former, reduced to one MP. The towns which comprised the Boroughs varied slightly over this long period, but primarily consisted of Cardigan, Aberystwyth, Lampeter and Adpar, the latter now a suburb of Newcastle Emlyn across the Teifi, in Carmarthenshire.

Blaenau Gwent was a constituency in South Wales, that represented in the House of Commons of the UK Parliament since 2010 by Nick Smith of the Labour Party.

Cardiff South and Penarth is a constituency created in 1983 represented in the House of Commons of the UK Parliament since 2012 by Stephen Doughty, a Labour Co-op MP. It was the largest constituency in Wales, with an electorate of 75,175 and one of the most ethnically diverse.

Llanelli is a constituency of the House of Commons of the Parliament of the United Kingdom. From 1918 to 1970 the official spelling of the constituency name was Llanelly. It elects one Member of Parliament (MP) by the first past the post system of election. Since 2005, it is currently represented by Nia Griffith of the Labour Party.

Merthyr Tydfil and Rhymney was a constituency represented in the House of Commons of the UK Parliament. It was established for the 1983 general election.

Doncaster North is a constituency in South Yorkshire, England, represented in the House of Commons of the UK Parliament since 2005 by Ed Miliband of the Labour Party. From 2010 until 2015, he was Leader of the Opposition before he lost the 2015 general election to David Cameron and the Conservatives. Part of the red wall, it was formerly a Labour stronghold, until the 2019 general election when it became a Labour-Conservative marginal.

Bristol West was a borough constituency represented in the House of Commons of the Parliament of the United Kingdom since 2015 by Thangam Debbonaire of the Labour Party. It mostly covers the central and western parts of Bristol.

Hastings and Rye is a constituency in East Sussex represented in the House of Commons of the UK Parliament since 2019 by Sally-Ann Hart of the Conservative Party. From 2010 until 2019, it was represented by Amber Rudd, who served as Secretary of State for Energy and Climate Change, Minister for Women and Equalities, Secretary of State for the Home Department and Secretary of State for Work and Pensions under the governments of David Cameron, Theresa May and Boris Johnson.
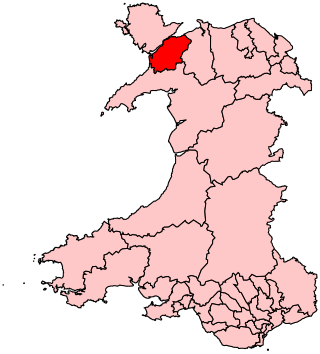
Arfon was a constituency in Wales represented in the House of Commons of the UK Parliament at Westminster. Although it is relatively large by geographical area, the constituency is a predominantly urban rather than rural seat, with the majority of the population living in the two towns of Bethesda and Caernarfon, as well as in the city of Bangor, on which the constituency is based. "Arfon" is a historical name for the area, meaning "facing Anglesey"; it is also the name of the former district council. This seat was created by the Welsh Boundary Commission in time for the 2010 general election; it replaced the old seat of Caernarfon. Bangor was in the old seat of Conwy. The same boundaries were used for the Arfon Welsh Assembly constituency in the 2007 Welsh Assembly election.
Pembrokeshire was a parliamentary constituency based on the county of Pembrokeshire in Wales. It returned one Member of Parliament (MP) to the House of Commons of the Parliament of the United Kingdom, elected by the first past the post system.
The 1985 Brecon and Radnor by-election was a parliamentary by-election held on 4 July 1985 for the House of Commons constituency of Brecon and Radnor.

This is a summary of the electoral history of Tony Blair, who served as Prime Minister of the United Kingdom from 1997 to 2007 and Leader of the Labour Party from 1994 to 2007. He was the Member of Parliament (MP) for Sedgefield from 1983 to 2007.
Following the resignation of the sitting MP Alun Michael on 22 October 2012, a by-election for the Cardiff South and Penarth Westminster constituency was held on 15 November 2012.

The 2015 United Kingdom general election was held on Thursday 7 May 2015 to elect 650 Members of Parliament to the House of Commons. It was the only general election held under the rules of the Fixed-term Parliaments Act 2011 and was the last general election to be held before the United Kingdom would vote to end its membership of the European Union (EU). Local elections took place in most areas of England on the same day.

A by-election was held in the UK Parliament constituency of Brecon and Radnorshire on 1 August 2019 after Chris Davies, who had held the seat for the Conservatives since the 2015 general election, was unseated by a recall petition. The by-election was won by Jane Dodds of the Liberal Democrats.