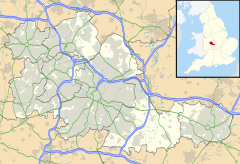
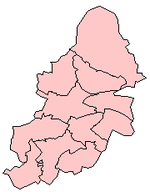
Harborne | |
---|---|
Ward | |
Harborne Ward shown within Birmingham | |
Location within the West Midlands | |
Population | 23,001 (2011) [1] |
OS grid reference | SP020836 |
Metropolitan borough | |
Metropolitan county | |
Region | |
Country | England |
Sovereign state | United Kingdom |
Post town | BIRMINGHAM |
Postcode district | B17 |
Dialling code | 0121 |
Police | West Midlands |
Fire | West Midlands |
Ambulance | West Midlands |
UK Parliament | |
Councillors |
|
Harborne ward is a local government district, one of 40 wards that make up Birmingham City Council. Harborne lies to the south west of Birmingham city centre. It has a slightly older age profile than the city average. The percentage of ethnic minority residents is below the city average. [2] Unemployment is below the city average. [3] The ward population at the 2011 census was 23,001. [4]
The Harborne ward is currently represented by two Labour and Co-operative Councillors; Jayne Francis (2016-) [5] and Martin Brooks (2022-). [6]
The ward of Harborne forms part of the Parliamentary constituency of Birmingham Edgbaston along with Bartley Green, Edgbaston (ward), and Quinton, which has been represented by Labour and Co-operative MP Preet Gill since 2017.
Source: [7]
Party | Candidate | Votes | % | ±% | |
---|---|---|---|---|---|
Labour | Jayne Francis | 2,623 | 22.69 | ||
Conservative | Peter Fowler | 2,533 | 21.91 | ||
Conservative | Akaal Sidhu | 2390 | 20.67 | ||
Labour | Sundip Meghani | 2061 | 17.82 | ||
Liberal Democrats | Colin Green | 657 | 5.68 | ||
Green | Phil Simpson | 650 | 5.62 | ||
Liberal Democrats | Ian Garrett | 646 | 5.59 | ||
Majority | |||||
Turnout | 6,109 | 38.60 | 0.63 | ||
Labour hold | Swing | ||||
Conservative gain from Labour | Swing |
Party | Candidate | Votes | % | ±% | |
---|---|---|---|---|---|
Labour | Jayne Francis | 2,841 | 44.7 | 1.7 | |
Conservative | Akaal Sidhu | 2,404 | 37.8 | 0.5 | |
Green | Phil Simpson | 494 | 7.8 | 0.6 | |
UKIP | Mary Morris | 376 | 5.9 | 0.2 | |
Liberal Democrats | Philip Banting | 240 | 3.8 | 0.8 | |
Majority | 437 | 6.9 | 2.2 | ||
Turnout | 6,355 | 39.23 | |||
Labour hold | Swing |
Party | Candidate | Votes | % | ±% | |
---|---|---|---|---|---|
Labour | James McKay | 4,922 | 43.0 | 3.6 | |
Conservative | Jane James | 4,384 | 38.3 | 0.9 | |
Green | Phil Simpson | 964 | 8.4 | 0.3 | |
UKIP | Charles Brecknell | 654 | 5.7 | ||
Liberal Democrats | Philip Banting | 528 | 4.6 | 0.8 | |
Majority | 538 | 4.7 | |||
Turnout | 11,452 | ||||
Labour hold | Swing | 1.4 |
Party | Candidate | Votes | % | ±% | |
---|---|---|---|---|---|
Conservative | John Alden | 2,816 | |||
Labour | Nabila Zulfiqar | 2,518 | |||
Green | Phil Simpson | 637 | |||
UKIP | Charles Brecknell | 574 | |||
Liberal Democrats | Philip Banting | 258 | |||
Majority | 298 | ||||
Turnout | |||||
Conservative hold | Swing |
Party | Candidate | Votes | % | ±% | |
---|---|---|---|---|---|
Labour | Elaine Williams | 3,264 | 50.2 | 3.6 | |
Conservative | John Alden | 2,441 | 37.5 | 1.65 | |
Green | Phil Simpson | 394 | 6.1 | 1.97 | |
UKIP | Keith Rowe | 233 | 3.6 | NEW | |
Liberal Democrats | Alaine Christian | 178 | 2.6 | 2.8 | |
Majority | 823 | 17.7 | 10.2 | ||
Turnout | 6,529 | 37.95 | 8.09 | ||
Labour gain from Conservative | Swing |
Party | Candidate | Votes | % | ±% | |
---|---|---|---|---|---|
Labour | James McKay | 3,655 | 46.6 | 12.5 | |
Conservative | Geoff Hewitt | 3,071 | 39.15 | 2.85 | |
Green | Phil Simpson | 633 | 8.07 | 1.37 | |
Liberal Democrats | Christopher Bates | 426 | 5.4 | 9.2 | |
Majority | 584 | 7.5 | 0.4 | ||
Turnout | 7,844 | 46.04 | 20.26 | ||
Labour gain from Conservative | Swing |
Party | Candidate | Votes | % | ±% | |
---|---|---|---|---|---|
Conservative | Mike Whitby | 4,640 | 42.0 | 7.5 | |
Labour | James McKay | 3,766 | 34.1 | 8.8 | |
Liberal Democrats | Mohammed Sagier | 1,609 | 14.6 | 7.2 | |
Green | Phil Simpson | 744 | 6.7 | 5.9 | |
BNP | Roy Bevington | 289 | 2.6 | 0.9 | |
Majority | 874 | 7.9 | 16.3 | ||
Turnout | 11,078 | 66.3 | 32.9 | ||
Conservative hold | Swing |
Party | Candidate | Votes | % | ±% | |
---|---|---|---|---|---|
Conservative | John Alden | 2,717 | 49.5 | 5.0 | |
Labour | John Priest | 1,389 | 25.3 | 2.1 | |
Green | Phil Simpson | 691 | 12.6 | 0.4 | |
Liberal Democrats | Mohammed Sagier | 405 | 7.4 | 3.3 | |
BNP | Howard Hamilton | 193 | 3.5 | 0.9 | |
UKIP | Edward Siddall-Jones | 80 | 1.5 | NEW | |
Majority | 1,328 | 24.2 | 7.1 | ||
Turnout | 5,475 | 33.4 | 3.58 | ||
Conservative hold | Swing |
Party | Candidate | Votes | % | ±% | |
---|---|---|---|---|---|
Conservative | Peter Hollingworth | 2,699 | 44.5 | 3.8 | |
Labour | John Priest | 1,662 | 27.4 | 0.1 | |
Green | Philip Simpson | 786 | 13.0 | 3.0 | |
Liberal Democrats | Miriam Banting | 649 | 10.7 | 2.0 | |
BNP | Lynette Orton | 265 | 4.4 | 1.1 | |
Majority | 1,937 | 17.1 | 3.7 | ||
Turnout | 6,083 | 36.98 | 3.52 | ||
Conservative hold | Swing |
Party | Candidate | Votes | % | ±% | |
---|---|---|---|---|---|
Conservative | Mike Whitby | 3,200 | 48.3 | ||
Labour | John Priest | 1,823 | 27.5 | ||
Green | Philip Simpson | 665 | 10.0 | ||
Liberal Democrats | Mohammed Sagier | 577 | 8.7 | ||
BNP | Josephine Larkin | 364 | 5.5 | ||
Majority | 1,377 | 20.8 | |||
Turnout | 6,609 | 40.5 | 0.83 | ||
Conservative hold | Swing |
Party | Candidate | Votes | % | ±% | |
---|---|---|---|---|---|
Conservative | John Alden | 3,268 | 16.93 | ||
Conservative | Peter Hollingworth | 3,170 | 16.42 | ||
Conservative | Mike Whitby | 3,100 | 16.06 | ||
Labour | Badley, C. | 1,879 | 9.73 | ||
Labour | McCarthy, K. | 1,589 | 8.23 | ||
Labour | Hepburn, M. | 1,514 | 7.84 | ||
Liberal Democrats | Banting, M. | 1,189 | 6.16 | ||
Liberal Democrats | Sagier, M. | 1,155 | 5.98 | ||
Liberal Democrats | Selwood, B. | 1,035 | 5.36 | ||
Green | Carins, D. | 990 | 5.13 | ||
BNP | Bellinger, S. | 378 | 1.96 | ||
Majority | |||||
Turnout | 19,301 | 41.33 | 7.93 | ||
Conservative hold | Swing | ||||
Conservative hold | Swing |
Party | Candidate | Votes | % | ±% | |
---|---|---|---|---|---|
Conservative | Peter Hollingworth | 3,008 | 52.4 | 2.4 | |
Labour | Badley, C. | 1,816 | 31.7 | 0.5 | |
Liberal Democrats | Banting, M. | 652 | 11.4 | 2.1 | |
Green | Vaze, P. | 261 | 4.5 | 0.8 | |
Majority | 1,192 | 20.4 | 2.2 | ||
Turnout | 5,737 | 33.4 | 1.6 | ||
Conservative hold | Swing | 1.7 |
Party | Candidate | Votes | % | ±% | |
---|---|---|---|---|---|
Conservative | Alden, J. | 3,029 | 54.8 | 2.3 | |
Labour | Sampson, R. | 1,782 | 32.2 | 0.7 | |
Liberal Democrats | Dow, C. | 512 | 9.3 | 0.7 | |
Green | Vaze, P. | 203 | 3.7 | NEW | |
Majority | 1,247 | 22.6 | 1.6 | ||
Turnout | 5,589 | 31.8 | 1.7 | ||
Conservative hold | Swing |
Party | Candidate | Votes | % | ±% | |
---|---|---|---|---|---|
Conservative | Hollingworth, P. | 2,995 | 57.1 | 3.7 | |
Labour | Smith-O'Gorman, W. | 1,724 | 32.9 | 3.6 | |
Liberal Democrats | Boyle, C. | 527 | 10 | 1.8 | |
Majority | 1,271 | 24.2 | 7.3 | ||
Turnout | 5,246 | 30.1 | 1.1 | ||
Conservative hold | Swing |
Party | Candidate | Votes | % | ±% | |
---|---|---|---|---|---|
Conservative | Mike Whitby | 2,719 | 53.4 | 8.5 | |
Labour | Stephen Cormell | 1,859 | 36.5 | 6.8 | |
Liberal Democrats | Conall Boyle | 420 | 8.2 | 1.3 | |
Green | Peter Beck | 96 | 1.9 | 0.4 | |
Majority | 860 | 16.9 | 15.3 | ||
Turnout | 5,094 | 29.0 | 1.1 | ||
Conservative gain from Labour | Swing |
Party | Candidate | Votes | % | ±% | |
---|---|---|---|---|---|
Conservative | Alden, J. | 2,981 | 44.9 | 5.0 | |
Labour | Emery, B. | 2,875 | 43.3 | 2.5 | |
Liberal Democrats | Moss, J. | 633 | 9.5 | 3.2 | |
Green | Bozic, N. | 153 | 2.3 | 0.1 | |
Majority | 106 | 1.6 | 5.2 | ||
Turnout | 6,642 | 38.2 | 3.0 | ||
Conservative hold | Swing | - |
Party | Candidate | Votes | % | ±% | |
---|---|---|---|---|---|
Labour | Rust, A. | 3,288 | 45.8 | 11.8 | |
Conservative | Zissman, B. | 2,802 | 39.1 | 2.4 | |
Liberal Democrats | Moss, J. | 912 | 12.7 | 8.4 | |
Green | Squire, A. | 171 | 2.4 | 0.9 | |
Margin of victory | 486 | 6.8 | 0.7 | ||
Turnout | 7,173 | 41.2 | 4.9 | ||
Labour gain from Conservative | Swing | - |
Party | Candidate | Votes | % | ±% | |
---|---|---|---|---|---|
Conservative | Hollingworth, P. | 3,309 | 41.5 | 21.7 | |
Labour | Bowen, S. | 2,714 | 34.0 | 9.1 | |
Liberal Democrats | Harmer, R. | 1,686 | 21.1 | 12.7 | |
Green | Squire, A. | 263 | 3.3 | 0.2 | |
Majority | 595 | 7.5 | 30.8 | ||
Turnout | 7,972 | 46.1 | 6.1 | ||
Conservative hold | Swing | - |
Party | Candidate | Votes | % | ±% | |
---|---|---|---|---|---|
Conservative | Alden, J. | 4,425 | 63.2 | 11.3 | |
Labour | Harrison, D. | 1,743 | 24.9 | 5.6 | |
Liberal Democrats | Harmer, R. | 590 | 8.4 | 3.9 | |
Green | Squire, A. | 247 | 3.5 | 1.8 | |
Majority | 2,682 | 38.3 | 16.9 | ||
Turnout | 7005 | 40.0 | 4.2 | ||
Conservative hold | Swing | - |
Party | Candidate | Votes | % | ±% | |
---|---|---|---|---|---|
Conservative | Zissman, B. | 4,043 | 51.9 | 6.0 | |
Labour | Fargher, B. | 2,374 | 30.5 | 11.2 | |
Liberal Democrats | Boyle, C. | 956 | 12.3 | NEW | |
Green | Hurdley, J. | 411 | 5.3 | 7.0 | |
Majority | 1,669 | 21.4 | 17.2 | ||
Turnout | 7,784 | 44.2 | 4.5 | ||
Conservative hold | Swing | - |
Party | Candidate | Votes | % | ±% | |
---|---|---|---|---|---|
Conservative | Hollingworth, P. | 3,950 | 45.9 | 5.1 | |
Labour | Fargher, B. | 3,588 | 41.7 | 7.5 | |
Green | Hurdley, J. | 1,061 | 12.3 | 8.5 | |
Majority | 362 | 4.2 | 12.6 | ||
Turnout | 8,599 | 48.7 | 7.5 | ||
Conservative hold | Swing | - |
Party | Candidate | Votes | % | ±% | |
---|---|---|---|---|---|
Conservative | Alden, J. | 3,786 | 51.0 | 2.4 | |
Labour | Fargher, B. | 2,542 | 34.2 | 11.7 | |
SLD | Bertram, C. | 814 | 11.0 | NEW | |
Green | Squire, A. | 282 | 3.8 | 1.4 | |
Majority | 1,244 | 16.8 | 14.1 | ||
Turnout | 7,424 | 41.2 | 4.9 | ||
Conservative hold | Swing | - |
Party | Candidate | Votes | % | ±% | |
---|---|---|---|---|---|
Conservative | Zissman, B. | 4,449 | 53.4 | 7.0 | |
Labour | Chandler, A. | 1,875 | 22.5 | 4.0 | |
Alliance | Vaughan, C. | 1,813 | 21.7 | 2.2 | |
Green | Hurdley, J. | 202 | 2.4 | 0.9 | |
Majority | 2,574 | 30.9 | 11.1 | ||
Turnout | 8,339 | 46.1 | 4.7 | ||
Conservative hold | Swing | - |
Party | Candidate | Votes | % | ±% | |
---|---|---|---|---|---|
Conservative | Hollingworth, P. | 3,430 | 46.4 | 7.9 | |
Labour | Chandler, A. | 1,963 | 26.5 | 3.2 | |
Alliance | Vaughan, C. | 1,765 | 23.9 | 10.7 | |
Green | Squire, A. | 242 | 3.3 | NEW | |
Majority | 1,467 | 19.8 | 4.8 | ||
Turnout | 7,400 | 41.4 | 2.1 | ||
Conservative hold | Swing | - |
Party | Candidate | Votes | % | ±% | |
---|---|---|---|---|---|
Conservative | Alden, J. | 3,821 | 54.3 | 3.2 | |
Labour | Bridger, D. | 2,089 | 29.7 | 5.7 | |
Alliance | Vaughan, C. | 926 | 13.2 | 2 | |
Ecology | Hurdley, J. | 152 | 2.2 | 1.1 | |
Communist | Davis, P. | 43 | 0.6 | NEW | |
Majority | 1,732 | 24.6 | 8.9 | ||
Turnout | 7,031 | 39.3 | 1.9 | ||
Conservative hold | Swing | - |
Party | Candidate | Votes | % | ±% | |
---|---|---|---|---|---|
Conservative | Zissman, B. | 4,249 | 57.5 | 9.2 | |
Labour | Bridger, D. | 1,775 | 24.0 | 3.1 | |
Alliance | Vaughan, C. | 1,123 | 15.2 | 8.8 | |
Ecology | Hurdley, J. | 241 | 3.3 | 3.5 | |
Majority | 2,474 | 33.5 | 9.3 | ||
Turnout | 7,388 | 41.2 | 1.3 | ||
Conservative hold | Swing | - |
Party | Candidate | Votes | % | ±% | |
---|---|---|---|---|---|
Conservative | Hollingworth, P. | 3,910 | 48.3 | 5.3 | |
Conservative | Bailey, J. | 3,544 | |||
Conservative | Zissman, B. | 3,506 | |||
Alliance | Chitham, E. | 1,939 | 24.0 | NEW | |
Alliance | Holt, R. | 1,702 | |||
Labour | Bridger, D. | 1,693 | 20.9 | 7.3 | |
Labour | Green, D. | 1,655 | |||
Alliance | Wheldall, K. | 1,647 | − | ||
Labour | Hadley, P. | 1,558 | − | ||
Ecology | Hurdley, J. | 546 | 6.8 | 0.7 | |
Majority | - | 24.4 | 1.0 | ||
Turnout | - | 42.5 | 9.6 | ||
Conservative hold | Swing | - | |||
Conservative hold | Swing | - |
Party | Candidate | Votes | % | ±% | |
---|---|---|---|---|---|
Conservative | ZIssman, B. | 3,229 | 53.6 | 10.6 | |
Labour | Lovekin, I. | 1,701 | 28.2 | 7.6 | |
Liberal | Weston, C. | 653 | 10.8 | NEW | |
Ecology | Hunt, R. | 365 | 6.1 | NEW | |
E&D | Goulden, D. | 76 | 1.3 | NEW | |
Majority | 1,528 | 25.4 | 3.0 | ||
Turnout | 6,024 | 32.9 | 37.1 | ||
Conservative hold | Swing | - |
Party | Candidate | Votes | % | ±% | |
---|---|---|---|---|---|
Conservative | Bailey, J. | 8,316 | 64.2 | 5.1 | |
Labour | Allcock, R. | 4,639 | 35.8 | 11.5 | |
Majority | 1,677 | 28.4 | 16.6 | ||
Turnout | 12,955 | 70.0 | 36.8 | ||
Conservative hold | Swing | - |
Party | Candidate | Votes | % | ±% | |
---|---|---|---|---|---|
Conservative | Hollingworth, P. | 4,219 | 69.3 | 2.0 | |
Labour | Eynon, G. | 1,482 | 24.3 | 4.8 | |
Liberal | Kierman, P. | 387 | 6.4 | 2.8 | |
Majority | 2,737 | 45.0 | 6.8 | ||
Turnout | 6,088 | 33.2 | 4.6 | ||
Conservative hold | Swing | - |
Party | Candidate | Votes | % | ±% | |
---|---|---|---|---|---|
Conservative | Zissman, B. | 5,004 | 71.3 | 7.8 | |
Labour | Yapp, C. | 1,367 | 19.5 | 1.6 | |
Liberal | Eden, L. | 646 | 9.2 | 3.2 | |
Majority | 3,637 | 51.8 | 6.2 | ||
Turnout | 7,017 | 37.8 | 5.2 | ||
Conservative hold | Swing | - |
Party | Candidate | Votes | % | ±% | |
---|---|---|---|---|---|
Conservative | Bailey, J. | 3,939 | 63.5 | 0.5 | |
Labour | Paris, C. | 1,111 | 17.9 | 6.4 | |
Liberal | Eden, L. | 771 | 12.4 | 0.7 | |
National Front | Barlow, R. | 294 | 4.7 | NEW | |
Independent Liberal | Goulden, D. | 93 | 1.5 | NEW | |
Majority | 2,828 | 45.6 | 7.0 | ||
Turnout | 6,208 | 32.6 | 3.4 | ||
Conservative hold | Swing | - |
Party | Candidate | Votes | % | ±% | |
---|---|---|---|---|---|
Conservative | Hollingworth, P. | 3,490 | 63.0 | {{{change}}} | |
Conservative | Zissman, B. | 3,318 | − | ||
Conservative | Bailey, J. | 3,265 | − | ||
Labour | Griffiths, B. | 1,348 | 24.3 | ||
Labour | Symons, A. | 1,268 | |||
Labour | Knowles, R. | 1,168 | − | ||
Liberal | Goulden, D. | 705 | 12.7 | − | |
Liberal | Snow, R. | 659 | − | ||
Liberal | Bates, K. | 632 | − | ||
Majority | - | 38.6 | − | ||
Turnout | - | 29.2 | − | ||
Conservative win | (new seat) | ||||
Conservative win | (new seat) |
Aston is an area of inner Birmingham, England. Located immediately to the north-west of Central Birmingham, Aston constitutes a ward within the metropolitan authority. It is approximately 1.5 miles (2.4 km) from Birmingham City Centre.
Edgbaston is a suburb of Birmingham, West Midlands, England. It lies immediately south-west of Birmingham city centre, and was historically in Warwickshire. The wards of Edgbaston and North Edgbaston had a combined population of 42,295 at the 2021 census.
Harborne is an area of south-west Birmingham, England. It is located three miles southwest from Birmingham city centre. It is a Birmingham City Council ward in the formal district and in the parliamentary constituency of Birmingham Edgbaston.
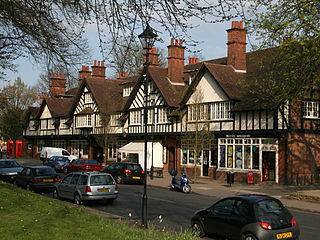
Bournville is a model village on the southwest side of Birmingham, England, founded by the Quaker Cadbury family for employees at its Cadbury's factory, and designed to be a "garden" village where the sale of alcohol was forbidden. Cadbury's is well known for chocolate products – including a dark chocolate bar branded Bournville. Historically in northern Worcestershire, it is also a ward within the council constituency of Selly Oak and home to the Bournville Centre for Visual Arts and the Cadbury's chocolate factory. Bournville is known as one of the most desirable areas to live in the UK; research by the Joseph Rowntree Foundation in 2003 found that it was "one of the nicest places to live in Britain".
Ladywood is an inner-city district next to central Birmingham. Historically in Warwickshire, in June 2004, Birmingham City Council conducted a citywide "Ward Boundary Revision" to round-up the 39 Birmingham wards to 40. As a result of this, Ladywood Ward's boundaries were expanded to include the neighbouring areas of Hockley, Lee Bank and Birmingham city centre.
Birmingham, a city and metropolitan borough in the West Midlands, England, is the second-largest city in the United Kingdom.
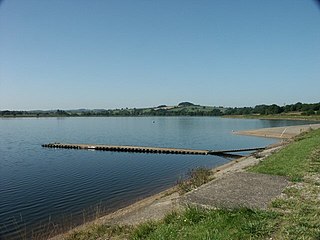
Bartley Green is a residential suburban area and electoral ward in Birmingham, England, 5 miles (8 km) south west of the city centre. The ward is part of the Birmingham Edgbaston constituency and is represented in parliament by Labour Co-operative MP Preet Gill.
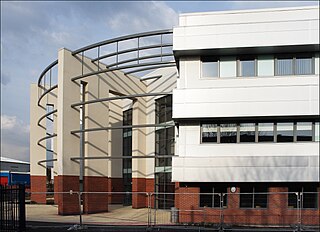
Bordesley Green is an inner-city area of Birmingham, England about two miles east of the city centre. It also contains a road of the same name. It is in the Bordesley Green Ward which also covers some of Small Heath and Little Bromwich. Bordesley Green East is in the Heartlands Ward.
Quinton is a suburb and ward of Birmingham, England, 5 miles (8 km) west of the city centre. Formerly part of Halesowen parish, Quinton became part of Birmingham in 1909. Quinton was a village and the surrounding area was farmland until the 1930s when the first housing estates were developed. Most of the farmland had been built on by 1980 but some countryside remains in the form of Woodgate Valley Country Park. Along with Bartley Green, Harborne and Edgbaston, Quinton is within the Birmingham Edgbaston constituency.
Birmingham Edgbaston is a constituency, represented in the House of Commons of the UK Parliament since 2017 by Preet Gill, a Labour Co-op MP.
Birmingham Ladywood is a constituency in the city of Birmingham that was created in 1918. The seat has been represented in the House of Commons of the Parliament of the United Kingdom by Shabana Mahmood of the Labour Party since 2010. Mahmood currently serves as Lord Chancellor and Secretary of State for Justice under the government of Keir Starmer.
Longbridge is an area in the south-west of Birmingham, England, located near the border with Worcestershire, historically being within it.
Brandwood is one of 40 wards which constitute Birmingham City Council and is part of the Birmingham Selly Oak constituency. Prior to May 2010, it was a part of the constituency of Birmingham Hall Green. The ward contains a large number of owner-occupied properties around Howard Road, Wheelers Lane, May Lane, Woodthorpe Road, Featherstone Road, Brandwood Road, Lindsworth Road and Alcester Road South, in addition to two big former council estates around Allenscroft Road and Druids Heath, the latter containing 16 high-rise tower blocks. Brandwood is a sub-section area of Kings Heath.
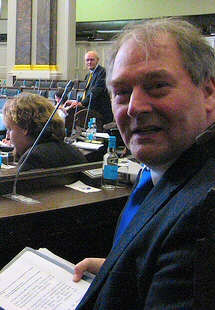
Michael John Whitby, Baron Whitby is an English Conservative Party politician and former leader of Birmingham City Council, a post he held from June 2004 to May 2012. Until 2014 he was one of three councillors representing the Harborne ward in the west of the city. He was formerly a Councillor on Sandwell Metropolitan Borough Council. It was announced that he would be made a working peer by David Cameron on 1 August 2013.
The demography of Birmingham, England, is analysed by the Office for National Statistics and data produced for each of the wards that make up the city, and the overall city itself, which is the largest city proper in England as well as the core of the third most populous urban area, the West Midlands conurbation.
Aston is a ward covering an area of north east Birmingham, including the district of Aston.
Edgbaston ward is a local government district, one of 40 wards that make up Birmingham City Council. Edgbaston lies to the south west of Birmingham city centre and is home to the University of Birmingham and the Queen Elizabeth hospital. The ward population at the 2011 census was 24,426.
The Weoley local council ward is one of the 40 electoral wards for the City of Birmingham, England. It is also one of the four wards that make up the local council constituency of Birmingham Northfield, the other three being the wards of Northfield, Longbridge and King's Norton.
Shettleston is one of the 23 wards of Glasgow City Council. Since its creation in 2007 it has returned four council members, using the single transferable vote system; the boundaries have not changed since it was formed.
The 2022 Birmingham City Council election took place on 5 May 2022, with all 101 council seats up for election across 37 single-member and 32 two-member wards. The election was held alongside other local elections across Great Britain and town council elections in Sutton Coldfield.