
The economy of Hong Kong is a highly developed free-market economy. It is characterised by low taxation, almost free port trade and a well-established international financial market. Its currency, called the Hong Kong dollar, is legally issued by three major international commercial banks, and is pegged to the US dollar. Interest rates are determined by the individual banks in Hong Kong to ensure that they are market driven. There is no officially recognised central banking system, although the Hong Kong Monetary Authority functions as a financial regulatory authority.

Amoy Gardens is a private housing estate in the Jordan Valley area of Kowloon, Hong Kong completed from 1981 to 1987. It was the most seriously affected location during the 2003 outbreak of Severe Acute Respiratory Syndrome (SARS), with over 300 people infected there.
Real estate appraisal, property valuation or land valuation is the process of developing an opinion of value for real property. Real estate transactions often require appraisals because they occur infrequently and every property is unique, unlike corporate stocks, which are traded daily and are identical. The location also plays a key role in valuation. However, since property cannot change location, it is often the upgrades or improvements to the home that can change its value. Appraisal reports form the basis for mortgage loans, settling estates and divorces, taxation, and so on. Sometimes an appraisal report is used to establish a sale price for a property.

The affordability of housing in the UK reflects the ability to rent or buy property. There are various ways to determine or estimate housing affordability. One commonly used metric is the median housing affordability ratio; this compares the median price paid for residential property to the median gross annual earnings for full-time workers. According to official government statistics, housing affordability worsened between 2020 and 2021, and since 1997 housing affordability has worsened overall, especially in London. The most affordable local authorities in 2021 were in the North West, Wales, Yorkshire and The Humber, West Midlands and North East.
Wendell Cox is an American urban policy analyst and proponent of the use of the private car over rail projects. He is the principal and sole owner of Wendell Cox Consultancy/Demographia, based in the St. Louis metropolitan region and editor of three web sites, Demographia, The Public Purpose and Urban Tours by Rental Car. Cox is a fellow of numerous conservative think tanks and a frequent op-ed commenter in conservative US and UK newspapers.
A real-estate bubble or property bubble is a type of economic bubble that occurs periodically in local or global real estate markets, and it typically follows a land boom. A land boom is a rapid increase in the market price of real property such as housing until they reach unsustainable levels and then declines. This period, during the run-up to the crash, is also known as froth. The questions of whether real estate bubbles can be identified and prevented, and whether they have broader macroeconomic significance, are answered differently by schools of economic thought, as detailed below.

Public housing in Hong Kong is a set of mass housing programmes through which the Government of Hong Kong provides affordable housing for lower-income residents. It is a major component of housing in Hong Kong, with nearly half of the population now residing in some form of public housing. The public housing policy dates to 1954, after a fire in Shek Kip Mei destroyed thousands of shanty homes and prompted the government to begin constructing homes for the poor.

Affordable housing is housing which is deemed affordable to those with a household income at or below the median as rated by the national government or a local government by a recognized housing affordability index. Most of the literature on affordable housing refers to mortgages and a number of forms that exist along a continuum – from emergency homeless shelters, to transitional housing, to non-market rental, to formal and informal rental, indigenous housing, and ending with affordable home ownership.
Choi Hung Estate is a public housing estate in Ngau Chi Wan, Kowloon, Hong Kong. It was built by the former Hong Kong Housing Authority (屋宇建設委員會) and is now managed by the current Hong Kong Housing Authority (香港房屋委員會). It received a Silver Medal at the 1965 Hong Kong Institute of Architects Annual Awards.

South Horizons is a private housing estate located in Aberdeen at the western end of Ap Lei Chau, in the Southern District of Hong Kong. Developed by Secan Limited, a Hutchison Whampoa associate company, it consists of 34 blocks, ranging in height from 25 to 42 storeys, completed between 1993 and 1995. Census data indicated that South Horizons had a population of 31,496 in 2011 and was the most populated among the private and public estates of the district.

Housing, or more generally, living spaces, refers to the construction and assigned usage of houses or buildings individually or collectively, for the purpose of shelter. Housing is a basic human need, and it plays a critical role in shaping the quality of life for individuals, families, and communities.

Ever since the 1997 Asian financial crisis, property markets have greatly developed through the years. Asian governments have improved the financial stance associated with the structure of housing finance, allowing more access to a diverse range of mortgages products.

The Australian property market comprises the trade of land and its permanent fixtures located within Australia. The average Australian property price grew 0.5% per year from 1890 to 1990 after inflation, however rose from 1990 to 2017 at a faster rate and may be showing signs of a contracting economic bubble. House prices in Australia receive considerable attention from the media and the Reserve Bank and some commentators have argued that there is an Australian property bubble.
A housing affordability index (HAI) is an index that measures housing affordability, usually the degree to which the median person or family in a particular country or region can afford housing/housing-related costs.
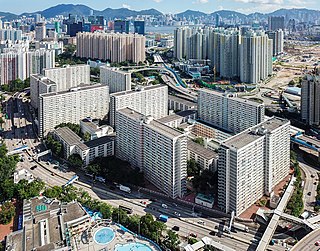
Housing in Hong Kong varies by location and income. More than 7 million people live on about 1,108 km2 (427 mi2) of land in the region, making it one of the densest places in the world.
Affordable housing in Canada is living spaces that are deemed financially accessible to those with a median household income in Canada. The property ladder continuum of affordable housing in Canada includes market, non-market, and government-subsidized housing.

The Median multiple or Median house price to income ratio is a housing indicator used to indicate the affordability of housing in any given community. The Median house price to income ratio WAS the primary indicator H1 of the 1991 World Bank/UNCHS Housing Indicator system. It was subsequently used as a measure of affordability by the UN Commission for Sustainable Development, the National Association of Realtors, State of the Environment 2003 Tasmania; and the Mortgage Guide UK along with many other organisations.
The property bubble in New Zealand is a major national economic and social issue. Since the early 1990s, house prices in New Zealand have risen considerably faster than incomes, putting increasing pressure on public housing providers as fewer households have access to housing on the private market. The property bubble has produced significant impacts on inequality in New Zealand, which now has one of the highest homelessness rate in the OECD and a record-high waiting list for public housing. Government policies have attempted to address the crisis since 2013, but have produced limited impacts to reduce prices or increase the supply of affordable housing. However, prices started falling in 2022 in response to tightening of mortgage availability and supply increasing. Some areas saw drops as high as around 9% - albeit from very high prices.

Affordable housing is housing that is deemed affordable to those with a median household income as rated by the national government or a local government by a recognized housing affordability index. A general rule is no more than 30% of gross monthly income should be spent on housing, to be considered affordable as the challenges of promoting affordable housing varies by location.
The Canadian property bubble refers to a significant rise in Canadian real estate prices from 2002 to present which some observers have called a real estate bubble. The Dallas Federal reserve rated Canadian real estate as "exuberant" beginning in 2003. From 2003 to 2018, Canada saw an increase in home and property prices of up to 337% in some cities. In 2016, the OECD warned that Canada's financial stability was at risk due to elevated housing prices, investment and household debt. By 2018, home-owning costs were above 1990 levels when Canada saw its last housing bubble burst. Bloomberg Economics ranked Canada as the second largest housing bubble across the OECD in 2019 and 2021. Toronto scored the highest in the world in Swiss bank UBS' real estate bubble index in 2022, with Vancouver also scoring among the 10 riskiest cities in the world. By 2023 Canada’s nonfinancial debt exceeded 300% of GDP and household debt surpassed 100% of GDP, both higher than the levels seen in the United States before the 2008 global financial crisis.