
The economy of Benin remains underdeveloped and dependent on subsistence agriculture and cotton. Cotton accounts for 40% of Benin's GDP and roughly 80% of official export receipts. There is also production of textiles, palm products, and cocoa beans. Maize (corn), beans, rice, peanuts, cashews, pineapples, cassava, yams, and other various tubers are grown for local subsistence. Benin began producing a modest quantity of offshore oil in October 1982. Production ceased in recent years but exploration of new sites is ongoing.
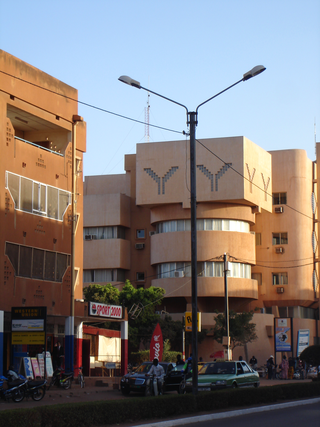
The economy of Burkina Faso is based primarily on subsistence farming and livestock raising. Burkina Faso has an average income purchasing-power-parity per capita of $1,900 and nominal per capita of $790 in 2014. More than 80% of the population relies on subsistence agriculture, with only a small fraction directly involved in industry and services. Highly variable rainfall, poor soils, lack of adequate communications and other infrastructure, a low literacy rate, and a stagnant economy are all longstanding problems of this landlocked country. The export economy also remained subject to fluctuations in world prices.

The economy of Cambodia currently follows an open market system and has seen rapid economic progress in the last decade. Cambodia had a GDP of $28.54 billion in 2022. Per capita income, although rapidly increasing, is low compared with most neighboring countries. Cambodia's two largest industries are textiles and tourism, while agricultural activities remain the main source of income for many Cambodians living in rural areas. The service sector is heavily concentrated on trading activities and catering-related services. Recently, Cambodia has reported that oil and natural gas reserves have been found off-shore.

The economy of the Central African Republic is $2.321 billion by gross domestic product as of 2019, with an estimated annual per capita income of just $805 as measured by purchasing power parity in 2019.
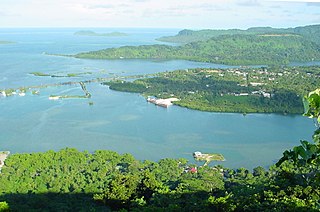
The economic activity of the Federated States of Micronesia consists primarily of subsistence agriculture and fishing. The islands have few mineral deposits worth exploiting, except for high-grade phosphate. The potential for a tourist industry exists, but the remoteness of the location and a lack of adequate facilities hinder development. Financial assistance from the US is the primary source of revenue, with the US pledged to spend $1.3 billion in the islands in 1986–2001. Geographical isolation and a poorly developed infrastructure are major impediments to long-term growth.

The economy of Guatemala is a considered a developing economy, highly dependent on agriculture, particularly on traditional crops such as coffee, sugar, and bananas. Guatemala's GDP per capita is roughly one-third of Brazil's. The Guatemalan economy is the largest in Central America. It grew 3.3 percent on average from 2015 to 2018. However, Guatemala remains one of the poorest countries in Latin America and the Caribbean, having highly unequal incomes and chronically malnourished children. The country is beset by political insecurity, and lacks skilled workers and infrastructure. It depends on remittances for nearly one-tenth of the GDP.

The economy of Malawi is $7.522 billion by gross domestic product as of 2019, and is predominantly agricultural, with about 80% of the population living in rural areas. The landlocked country in south central Africa ranks among the world's least developed countries. In 2017, agriculture accounted for about one-third of GDP and about 80% of export revenue. The economy depends on substantial inflows of economic assistance from the IMF, the World Bank, and individual donor nations. The government faces strong challenges: to spur exports, to improve educational and health facilities, to face up to environmental problems of deforestation and erosion, and to deal with the problem of HIV/AIDS in Africa. Malawi is a least developed country according to United Nations.

The economy of the Republic of the Congo is a mixture of subsistence hunting and agriculture, an industrial sector based largely on petroleum extraction and support services. Government spending is characterized by budget problems and overstaffing. Petroleum has supplanted forestry as the mainstay of the economy, providing a major share of government revenues and exports. Nowadays the Republic of the Congo is increasingly converting natural gas to electricity rather than burning it, greatly improving energy prospects.
Somalia is classified by the United Nations as a least developed country, with the majority of its population being dependent on agriculture and livestock for their livelihood. The economy of Somalia is $4.918 billion by gross domestic product as of 2020. For 1994, the CIA estimated it at purchasing power parity to be approximately $3.3 billion. In 2001, it was estimated to be $4.1 billion. By 2009, the CIA estimated that it had grown to $5.731 billion, with a projected real growth rate of 2.6%. In 2014, the International Monetary Fund estimated economic activity to have expanded by 3.7% primarily. This expansion was driven by growth in the primary sector and the secondary sector. According to a 2007 British Chambers of Commerce report, the private sector has experienced growth, particularly in the service sector. Unlike the pre-civil war period, when most services and the industrial sector were government-run, there has been substantial, albeit unmeasured, private investment in commercial activities. The investment has been largely financed by the Somali diaspora, and includes trade and marketing, money transfer services, transportation, communications, fishery equipment, airlines, telecommunications, education, health, construction and hotels.

The economy of Sudan has boomed on the back of increases in oil production, high oil prices, and large inflows of foreign direct investment until the second half of 2002. GDP growth registered more than 10% per year in 2006 and 2007. From 1997 to date, Sudan has $30.873 billion by gross domestic product as of 2019, and has been working with the International Monetary Fund (IMF) to implement macroeconomic reforms, including a managed float of the exchange rate. Sudan began exporting crude oil in the last quarter of 1999.
Syria's economic situation has been turbulent and their economy has deteriorated considerably since the beginning of the Syrian civil war, which erupted in March 2011.

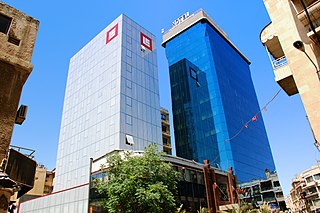
The economy of Bahrain is heavily dependent upon oil and gas. The Bahraini Dinar is the second-highest-valued currency unit in the world. Since the late 20th century, Bahrain has heavily invested in the banking and tourism sectors. The country's capital, Manama is home to many large financial structures. Bahrain's finance industry is very successful. In 2008, Bahrain was named the world's fastest growing financial center by the City of London's Global Financial Centres Index. Bahrain's banking and financial services sector, particularly Islamic banking, have benefited from the regional boom driven by demand for oil. Petroleum is Bahrain's most exported product, accounting for 60% of export receipts, 70% of government revenues, and 11% of GDP. Aluminium is the second most exported product, followed by finance and construction materials.

The economy of the Gambia is heavily reliant on agriculture. The Gambia has no significant mineral or other natural resources, and has a limited agricultural base. About 75% of the population depends on crops and livestock for its livelihood. Small-scale manufacturing activity features the processing of peanuts, fish, and animal hides.

The economy of Ivory Coast is stable and currently growing, in the aftermath of political instability in recent decades. The Ivory Coast's economy is largely market-based and depends heavily on the agricultural sector. Almost 70% of the Ivorian people are engaged in some form of agricultural activity. GDP per capita grew 82% in the 1960s, reaching a peak growth of 360% in the 1970s, but this proved unsustainable and it shrank by 28% in the 1980s and a further 22% in the 1990s. This decline, coupled with high population growth, resulted in a steady fall in living standards. The Gross national product per capita, now rising again, was about US$727 in 1996. It was substantially higher two decades before.
Child labour in Pakistan is the employment of children to work in Pakistan, which causes them mental, physical, moral and social harm. Child labour takes away the education from children. The Human Rights Commission of Pakistan estimated that in the 1990s, 11 million children were working in the country, half of whom were under age ten. In 1996, the median age for a child entering the work force was seven, down from eight in 1994. It was estimated that one quarter of the country's work force was made up of children. Child labor stands out as a significant issue in Pakistan, primarily driven by poverty. The prevalence of poverty in the country has compelled children to engage in labor, as it has become necessary for their families to meet their desired household income level, enabling them to afford basic necessities like butter and bread.
Pakistan has one of the largest labour and manpower resources in the world, due to its large population, which is the fifth largest in the world. According to data produced by the CIA World Factbook, the total number of Pakistan's labour force is 57.2 million, making it the ninth largest country by available human workforce. About 43% of this labour is involved in agriculture, 20.3% in industry and the remaining 36.6% in other services.

Female participation and advancement in majority Muslim countries, or nations in which more than 50% of the population identifies as an adherent of the Islamic faith, have traditionally been areas of controversy. Several Western nations, such as the United States and Western Europe, have criticised majority Muslim nations for the lack of involvement and opportunity for women in the private sector.
Statistics on unemployment in India had traditionally been collected, compiled and disseminated once every ten years by the Ministry of Labour and Employment (MLE), primarily from sample studies conducted by the National Sample Survey Office. Other than these 5-year sample studies, India has – except since 2017 – never routinely collected monthly, quarterly or yearly nationwide employment and unemployment statistics. In 2016, the Centre for Monitoring Indian Economy, a non-governmental entity based in Mumbai, started sampling and publishing monthly unemployment in India statistics.