
The economy of Hong Kong is a highly developed free-market economy. It is characterised by low taxation, almost free port trade and a well-established international financial market. Its currency, called the Hong Kong dollar, is legally issued by three major international commercial banks, and is pegged to the US dollar. Interest rates are determined by the individual banks in Hong Kong to ensure that they are market driven. There is no officially recognised central banking system, although the Hong Kong Monetary Authority functions as a financial regulatory authority.

Amoy Gardens is a private housing estate in the Jordan Valley area of Kowloon, Hong Kong completed from 1981 to 1987. It was the most seriously affected location during the 2003 outbreak of Severe Acute Respiratory Syndrome (SARS), with over 300 people infected there.
Real estate appraisal, property valuation or land valuation is the process of developing an opinion of value for real property. Real estate transactions often require appraisals because they occur infrequently and every property is unique, unlike corporate stocks, which are traded daily and are identical. The location also plays a key role in valuation. However, since property cannot change location, it is often the upgrades or improvements to the home that can change its value. Appraisal reports form the basis for mortgage loans, settling estates and divorces, taxation, and so on. Sometimes an appraisal report is used to establish a sale price for a property.
The Home Ownership Scheme (HOS) is a subsidized-sale programme of public housing in Hong Kong managed by the Hong Kong Housing Authority. It was instituted in the late 1970s as part of the government policy for public housing with two aims - to encourage better-off tenants of rental flats to vacate those flats for re-allocation to families in greater housing need; and also to provide an opportunity for home ownership to families unable to afford to buy in the private sector.
The affordability of housing in the UK reflects the ability to rent or buy property. There are various ways to determine or estimate housing affordability. One commonly used metric is the median housing affordability ratio; this compares the median price paid for residential property to the median gross annual earnings for full-time workers. According to official government statistics, housing affordability improved slightly between 2019 and 2020, but since 1997 housing affordability has worsened overall, especially in London. The most affordable local authorities in 2020 were in the North West, Wales, East Midlands, Yorkshire, and The Humber.
Wendell Cox is an American urban policy analyst and academic, known as a leading proponent of the use of the private car over rail projects. He is the principal and sole owner of Wendell Cox Consultancy/Demographia, based in the St. Louis metropolitan region and editor of three web sites, Demographia, The Public Purpose and Urban Tours by Rental Car. Cox is a fellow of numerous conservative think tanks and a frequent op-ed commenter in conservative US and UK newspapers.
A real-estate bubble or property bubble is a type of economic bubble that occurs periodically in local or global real-estate markets, and typically follow a land boom. A land boom is the rapid increase in the market price of real property such as housing until they reach unsustainable levels and then decline. This period, during the run up to the crash, is also known as froth. The questions of whether real estate bubbles can be identified and prevented, and whether they have broader macroeconomic significance, are answered differently by schools of economic thought, as detailed below.

Public housing in Hong Kong is a set of mass housing programmes through which the Government of Hong Kong provides affordable housing for lower-income residents. It is a major component of housing in Hong Kong, with nearly half of the population now residing in some form of public housing. The public housing policy dates to 1954, after a fire in Shek Kip Mei destroyed thousands of shanty homes and prompted the government to begin constructing homes for the poor.

Affordable housing is housing which is deemed affordable to those with a household income at or below the median as rated by the national government or a local government by a recognized housing affordability index. Most of the literature on affordable housing refers to mortgages and a number of forms that exist along a continuum – from emergency homeless shelters, to transitional housing, to non-market rental, to formal and informal rental, indigenous housing, and ending with affordable home ownership.

Ever since the 1997 Asian financial crisis, property markets have greatly developed through the years. Asian governments have improved the financial stance associated with the structure of housing finance, allowing more access to a diverse range of mortgages products.
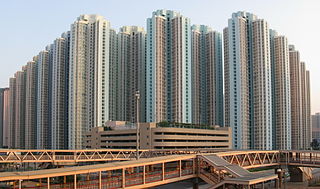
Housing in Hong Kong varies by location and income. More than 7 million people live on about 1,108 km² (427 mi²) of land in the region, making it one of the densest places in the world.
The continuum of affordable housing in Canada includes market, non-market, government-subsidized housing.
Since the British colonialisation in 1841 after the First Opium War, Hong Kong has grown from a stony outcrop on the southern coast of China to a territory whose property prices are among the highest in the world. The territory has a land mass of 1,111 km2 (429 sq mi). According to government figures as at 2018, most of the land in Hong Kong is woodland, shrubland and grassland – much of which designated as country parks such as Lion Rock, Plover Cove Country Park and Sai Kung East Country Park, and only approximately 25% of the land mass out of the total territory is classed as "built-up". Most of the 7.3 million people in Hong Kong inhabit an area measuring 78 km2 (30 sq mi). Excluding rural settlement housing, which represents 7% of the city's total domestic households, the remainder of the population is effectively squeezed into an area of 42 km2 (16 sq mi). Property developers play a direct role in housing in Hong Kong, including the hoarding of approximately 1,000 hectares of agricultural land which could otherwise be used for housing.
The real estate sector in Kenya has seen a boom that began somewhere in the mid to late 2000s because the property market is responding to increased demand.
The median multiple is used to indicate the affordability of housing in any given community. The median multiple is widely used for evaluating urban markets, and has been recommended by the World Bank.
The property bubble in New Zealand is a major national economic and social issue. Since the early 1990s, house prices in New Zealand have risen considerably faster than incomes, putting increasing pressure on public housing providers as fewer households have access to housing on the private market. The property bubble has produced significant impacts on inequality in New Zealand, which now has one of the highest homelessness rate in the OECD and a record-high waiting list for public housing. Government policies have attempted to address the crisis since 2013, but have produced limited impacts to reduce prices or increase the supply of affordable housing.

The Overseas Investment Amendment Act 2018 is a bill that amends the Overseas Investment Act 2005 to ban most non-resident foreigners from buying existing houses, by classifying them as sensitive land and introducing a residency test. Australian citizens are exempt from this rule as they are considered New Zealand residents per the Trans-Tasman Travel Arrangement. Singaporean citizens are also exempt due to free trade rules. The Overseas Investment Amendment Act was supported by the Labour–led coalition government but was opposed by the opposition centre-right National and libertarian ACT parties. It passed its third reading on 15 August 2018 and received royal assent on 22 August.

Affordable housing is housing which is deemed affordable to those with a median household income as rated by the national government or a local government by a recognized housing affordability index. The challenges of promoting affordable housing varies by location.
The Canadian property bubble refers to a significant rise in Canadian real estate prices from 2002 to present which some observers have called a real estate bubble. From 2003 to 2018, Canada saw an increase in home and property prices of up to 337% in some cities. By 2018, home-owning costs were above 1990 levels when Canada saw its last housing bubble burst. Bloomberg Economics ranks Canada as the second largest housing bubble across the OECD in 2019 and 2021.