Results of the Queensland state election, 2004

Last updated

Queensland state election, 7 February 2004 [1]
Legislative Assembly
<< 20012006 >>

Contents

Enrolled voters2,400,977
Votes cast2,195,400 Turnout 91.44–1.13
Informal votes43,657Informal1.99–0.30
Summary of votes by party
PartyPrimary votes%SwingSeatsChange
  Labor 1,011,63047.01–1.9263– 3
  Liberal 398,14718.50+4.185+ 2
  National 365,00516.96+2.8015+ 3
  Greens 145,5226.76+4.250± 0
  One Nation 104,9804.88–3.811– 2
  Democrats 9430.04–0.300± 0
  Independent 125,5165.83–2.785± 0
Total2,151,743  89 

This is a list of electoral district results for the Queensland 2004 election.

This is a list of current and former electoral divisions for the Legislative Assembly of Queensland, the state legislature for Queensland, Australia.

Results by electoral district

Albert

Queensland state election, 2004: Albert
PartyCandidateVotes%±
Labor Margaret Keech 15,43860.0+9.4
Liberal Corey Kolar7,10127.6+14.0
One Nation Chris Coyle1,8267.1-16.7
Greens Bill Livermore1,3645.3+5.3
Total formal votes25,72997.4-0.1
Informal votes6732.6+0.1
Turnout 26,40290.7-1.5
Two-party-preferred result
Labor Margaret Keech 16,17367.3+4.7
Liberal Corey Kolar7,86932.7+32.7
Labor hold Swing +4.7

Algester

Queensland state election, 2004: Algester
PartyCandidateVotes%±
Labor Karen Struthers 16,10260.9-5.8
Liberal Richard Bradley7,30327.6+4.9
Greens Gary Crocker1,5876.0+6.0
One Nation Dale Barnard1,4335.4+5.4
Total formal votes26,42597.7+0.3
Informal votes6212.3-0.3
Turnout 27,04692.5-1.2
Two-party-preferred result
Labor Karen Struthers 16,98968.0-4.6
Liberal Richard Bradley8,00632.0+4.6
Labor hold Swing -4.6

Ashgrove

Queensland state election, 2004: Ashgrove
PartyCandidateVotes%±
Labor Jim Fouras 13,09353.3-2.2
Liberal Terry Mendies7,53430.7+1.1
Greens Mike Stasse3,94216.0+10.1
Total formal votes24,56998.1-0.3
Informal votes4831.9+0.3
Turnout 25,05291.5
Two-party-preferred result
Labor Jim Fouras 15,04964.7-0.3
Liberal Terry Mendies8,21535.3+0.3
Labor hold Swing -0.3

Aspley

Queensland state election, 2004: Aspley
PartyCandidateVotes%±
Labor Bonny Barry 12,68250.3-4.4
Liberal Trevor Nelson-Jones10,81142.9-2.4
Greens Dennis Delalande1,7216.8+6.8
Total formal votes25,21498.3+1.4
Informal votes4271.7-1.4
Turnout 25,64193.3-0.8
Two-party-preferred result
Labor Bonny Barry 13,30654.3-0.4
Liberal Trevor Nelson-Jones11,19145.7+0.4
Labor hold Swing -0.4

Barron River

Queensland state election, 2004: Barron River
PartyCandidateVotes%±
Labor Lesley Clark 9,84942.3-0.7
Liberal Stephen Walsh8,86738.1+21.9
Greens Denis Walls2,46110.6+5.1
One Nation Peter Starr1,5766.8-9.4
Independent Andrew Ryan5452.3+2.3
Total formal votes23,29898.1-0.4
Informal votes4621.9+0.4
Turnout 23,76090.7+0.2
Two-party-preferred result
Labor Lesley Clark 11,31653.1-4.2
Liberal Stephen Welsh9,98846.9+46.9
Labor hold Swing -4.2

Beaudesert

Queensland state election, 2004: Beaudesert
PartyCandidateVotes%±
National Kev Lingard 13,34948.6+16.7
Labor Michael De Lacy9,32633.9-0.2
One Nation Lesley Millar2,88910.5-19.0
Greens Mike Beale1,9227.0+7.0
Total formal votes27,48698.3-0.1
Informal votes4691.7+0.1
Turnout 27,95592.8-1.5
Two-party-preferred result
National Kev Lingard 14,55258.1+6.1
Labor Michael De Lacy10,51141.9-6.1
National hold Swing +6.1

Brisbane Central

Queensland state election, 2004: Brisbane Central
PartyCandidateVotes%±
Labor Peter Beattie 14,64458.3-6.4
Liberal Reg Little6,56326.1+5.1
Greens Richard Nielsen3,09512.3+5.4
Independent Coral Wynter3761.5+0.6
Independent Adrian McAvoy3101.2+1.2
Independent Alan Skyring1170.5-0.1
Total formal votes25,10598.4+0.3
Informal votes4031.6-0.3
Turnout 25,50884.7-3.3
Two-party-preferred result
Labor Peter Beattie 16,22169.6-5.4
Liberal Reg Little7,09330.4+5.4
Labor hold Swing -5.4

Broadwater

Queensland state election, 2004: Broadwater
PartyCandidateVotes%±
Labor Peta-Kaye Croft 12,49349.3-3.1
National Margaret Grummitt10,47441.3-6.3
One Nation Peter Elliott1,2845.1+5.1
Greens Dean Hepburn1,0904.3+4.3
Total formal votes25,34198.1+2.5
Informal votes4981.9-2.5
Turnout 25,83988.9-1.7
Two-party-preferred result
Labor Peta-Kaye Croft 13,06154.1+1.7
National Margaret Grummitt11,09945.9-1.7
Labor hold Swing +1.7

Bulimba

Queensland state election, 2004: Bulimba
PartyCandidateVotes%±
Labor Pat Purcell 14,03160.8-12.4
Liberal Glenn Snowdon6,48428.1+1.3
Greens John Houghton2,57511.2+11.2
Total formal votes23,09098.0+1.5
Informal votes4612.0-1.5
Turnout 23,55190.2-1.3
Two-party-preferred result
Labor Pat Purcell 15,05168.5-4.7
Liberal Glenn Snowdon6,93731.5+4.7
Labor hold Swing -4.7

Bundaberg

Queensland state election, 2004: Bundaberg
PartyCandidateVotes%±
Labor Nita Cunningham 13,10451.2-13.7
National Jack Dempsey 10,41040.7+5.6
Greens Peter Ryan1,1714.6+4.6
Independent Adrian Wone9053.5+3.5
Total formal votes25,59097.9+2.1
Informal votes5442.1-2.1
Turnout 26,13492.8-0.9
Two-party-preferred result
Labor Nita Cunningham 13,55155.3-9.6
National Jack Dempsey 10,96044.7+9.6
Labor hold Swing -9.6

Bundamba

Queensland state election, 2004: Bundamba
PartyCandidateVotes%±
Labor Jo-Ann Miller 14,45663.2-8.4
Liberal Paul Cole4,32118.9+4.0
One Nation Mike Atkin2,52011.0+11.0
Greens Jim Prentice1,5706.9-6.5
Total formal votes22,86797.5+1.5
Informal votes5832.5-1.5
Turnout 23,45092.1-1.3
Two-party-preferred result
Labor Jo-Ann Miller 15,63174.9-6.0
Liberal Paul Cole5,24125.1+6.0
Labor hold Swing -6.0

Burdekin

Queensland state election, 2004: Burdekin
PartyCandidateVotes%±
Labor Steve Rodgers 7,91136.9+0.2
National Rosemary Menkens 7,60535.4+12.7
Independent Jeff Knuth 3,26515.2+15.2
One Nation Merle Poletto1,9218.9-10.8
Greens Mike Rubenach7623.6+3.6
Total formal votes21,46498.1-0.3
Informal votes4181.9+0.3
Turnout 21,88292.0-0.8
Two-party-preferred result
National Rosemary Menkens 10,47854.4+9.5
Labor Steve Rodgers 8,78745.6-9.5
National gain from Labor Swing +9.5

Burleigh

Queensland state election, 2004: Burleigh
PartyCandidateVotes%±
Labor Christine Smith 13,13047.3+3.0
National Max Duncan10,66738.4-0.4
Greens Inge Light2,3868.6+8.6
One Nation Paul Lewis1,5935.7-11.3
Total formal votes27,77697.9+0.1
Informal votes5892.1-0.1
Turnout 28,36589.4-1.2
Two-party-preferred result
Labor Christine Smith 14,19055.0+3.2
National Max Duncan11,59045.0-3.2
Labor hold Swing +3.2

Burnett

Queensland state election, 2004: Burnett
PartyCandidateVotes%±
National Rob Messenger 12,52652.6+4.3
Labor Trevor Strong 11,30847.4-4.3
Total formal votes23,83497.4+2.6
Informal votes6242.6-2.6
Turnout 24,45893.0-0.3
National gain from Labor Swing +4.3

Cairns

Queensland state election, 2004: Cairns
PartyCandidateVotes%±
Labor Desley Boyle 9,96245.7-5.8
Liberal Bob Manning 8,45338.8+38.8
One Nation Ian Noon1,7017.8-12.5
Greens Meredyth Woodward1,6727.7+1.7
Total formal votes21,78897.9-0.2
Informal votes4602.1+0.2
Turnout 22,24886.9-1.9
Two-party-preferred result
Labor Desley Boyle 10,94953.9-10.9
Liberal Bob Manning 9,36346.1+46.1
Labor hold Swing -10.9

Callide

Queensland state election, 2004: Callide
PartyCandidateVotes%±
National Jeff Seeney 14,45860.4+20.3
Labor David Pullen5,21621.8-2.0
One Nation Jim Dwyer4,26417.8-18.3
Total formal votes23,93898.3-0.0
Informal votes4051.7+0.0
Turnout 24,34393.6-0.3
Two-party-preferred result
National Jeff Seeney 16,22373.6+21.3
Labor David Pullen5,82026.4+26.4
National hold Swing +21.3

Caloundra

Queensland state election, 2004: Caloundra
PartyCandidateVotes%±
Liberal Mark McArdle 11,25943.3+4.7
Labor Christine Anthony10,80741.5+5.2
One Nation Ian Nelson2,0217.8-11.3
Greens Tony McLeod1,9437.5+7.5
Total formal votes26,03098.3+0.0
Informal votes4621.7-0.0
Turnout 26,49292.0-1.2
Two-party-preferred result
Liberal Mark McArdle 12,39751.3+0.3
Labor Christine Anthony11,78948.7-0.3
Liberal hold Swing +0.3

Capalaba

Queensland state election, 2004: Capalaba
PartyCandidateVotes%±
Labor Michael Choi 14,52159.2+15.6
Liberal Phill Costello7,55330.8+18.2
Greens Bob Knowles2,44910.0+10.0
Total formal votes24,52397.4-0.1
Informal votes6502.6+0.1
Turnout 25,17393.6-0.9
Two-party-preferred result
Labor Michael Choi 15,17265.2+0.6
Liberal Phill Costello8,11234.8+34.8
Labor hold Swing +0.6

Charters Towers

Queensland state election, 2004: Charters Towers
PartyCandidateVotes%±
National Shane Knuth 7,91046.8+12.2
Labor Christine Scott 7,36943.6-0.2
One Nation Jerry Burnett1,6359.7-12.0
Total formal votes16,91498.8-0.3
Informal votes2121.2+0.3
Turnout 17,12692.3-1.4
Two-party-preferred result
National Shane Knuth 8,48152.7+4.9
Labor Christine Scott 7,60847.3-4.9
National gain from Labor Swing +4.9

Chatsworth

Queensland state election, 2004: Chatsworth
PartyCandidateVotes%±
Labor Terry Mackenroth 15,21056.3-0.6
Liberal Andrew Hatfield9,46235.0+8.3
Greens Rob Wilson2,3618.7+3.3
Total formal votes27,03398.0+0.0
Informal votes5442.0-0.0
Turnout 27,57793.3-1.3
Two-party-preferred result
Labor Terry Mackenroth 15,99861.4-3.7
Liberal Andrew Hatfield9,46238.6+3.7
Labor hold Swing -3.7

Clayfield

Queensland state election, 2004: Clayfield
PartyCandidateVotes%±
Labor Liddy Clark 10,63345.2-0.7
Liberal Sally Hannah10,59845.1+2.9
Greens Peter Thomas1,7877.6+2.4
Independent Robyn McGee4912.1+2.1
Total formal votes23,50998.5+0.1
Informal votes3581.5-0.1
Turnout 23,86790.3-1.7
Two-party-preferred result
Labor Liddy Clark 11,61151.2-0.8
Liberal Sally Hannah11,07848.8+0.8
Labor hold Swing -0.8

Cleveland

Queensland state election, 2004: Cleveland
PartyCandidateVotes%±
Labor Darryl Briskey 13,43253.9-3.7
Liberal David Fenwick9,57538.4+13.4
Greens Thomas Petitt1,9087.7+7.7
Total formal votes24,91597.9+0.4
Informal votes5292.1-0.4
Turnout 25,44492.1-1.5
Two-party-preferred result
Labor Darryl Briskey 14,11558.7-8.0
Liberal David Fenwick9,94641.3+8.0
Labor hold Swing -8.0

Cook

Queensland state election, 2004: Cook
PartyCandidateVotes%±
Labor Jason O'Brien 7,34642.0-21.8
National Graham Elmes5,42031.0+15.5
Independent Bruce Gibson2,57214.7+14.7
Greens Neville St John-Wood1,1676.7+6.7
One Nation David Ballestrin9665.5-15.1
Total formal votes17,47198.3+0.0
Informal votes2941.7-0.0
Turnout 17,76584.3-2.9
Two-party-preferred result
Labor Jason O'Brien 8,74657.5-15.4
National Graham Elmes6,47742.5+42.5
Labor hold Swing -15.4

Cunningham

Queensland state election, 2004: Cunningham
PartyCandidateVotes%±
National Stuart Copeland 14,89062.34+37.46
Labor Daniel King6,77528.37+3.38
One Nation Peter Mace2,2209.29-11.27
Total formal votes23,88598.43-0.26
Informal votes3811.57+0.26
Turnout 24,26692.74-0.71
Two-party-preferred result
National Stuart Copeland 15,74668.93+10.30
Labor Daniel King7,09631.07-10.30
National hold Swing +10.30

Currumbin

Queensland state election, 2004: Currumbin
PartyCandidateVotes%±
Liberal Jann Stuckey 12,08546.0+20.4
Labor Merri Rose 10,42339.6-16.8
Greens Anja Light2,3569.0+9.0
One Nation Carol Minter1,4285.4-10.2
Total formal votes26,29298.0-0.3
Informal votes5262.0+0.3
Turnout 26,81890.4-0.8
Two-party-preferred result
Liberal Jann Stuckey 12,93253.2+17.7
Labor Merri Rose 11,36246.8-17.7
Liberal gain from Labor Swing +17.7

Darling Downs

Queensland state election, 2004: Darling Downs
PartyCandidateVotes%±
National Ray Hopper 11,67150.5+11.5
Labor Annette Frizzell5,40723.4+2.5
Independent Bruce Chalmers2,44810.6+10.6
One Nation David Hoy1,9028.2+8.2
Independent Kathy Sankey1,6747.3+7.3
Total formal votes23,10298.3-0.0
Informal votes4101.7+0.0
Turnout 23,51294.2-0.4
Two-party-preferred result
National Ray Hopper 13,32967.9+18.9
Labor Annette Frizzell6,33832.2+32.2
National gain from Independent Swing N/A

Everton

Queensland state election, 2004: Everton
PartyCandidateVotes%±
Labor Rod Welford 14,66456.6-6.2
Liberal Tracy Palmer-Davis9,07635.0+7.1
Greens Debbi Stainsby1,6246.3+6.3
Independent Leo De Marchi5562.1+2.1
Total formal votes25,92098.3+0.3
Informal votes4381.7-0.3
Turnout 26,35893.6-0.8
Two-party-preferred result
Labor Rod Welford 15,36761.6-5.9
Liberal Tracy Palmer-Davis9,58138.4+5.9
Labor hold Swing -5.9

Ferny Grove

Queensland state election, 2004: Ferny Grove
PartyCandidateVotes%±
Labor Geoff Wilson 15,32355.6-7.7
Liberal Andrew Patterson9,09333.0+7.0
Greens Di Clark3,12211.3+0.6
Total formal votes27,53898.4+0.7
Informal votes4481.6-0.7
Turnout 27,98693.1-1.5
Two-party-preferred result
Labor Geoff Wilson 16,55963.2-7.3
Liberal Andrew Patterson9,65736.8+7.3
Labor hold Swing -7.3

Fitzroy

Queensland state election, 2004: Fitzroy
PartyCandidateVotes%±
Labor Jim Pearce 13,27962.4-0.4
National John Engwicht8,01937.6+9.1
Total formal votes21,29898.1-0.3
Informal votes4201.9+0.3
Turnout 21,71892.7-1.2
Labor hold Swing -4.8

Gaven

Queensland state election, 2004: Gaven
PartyCandidateVotes%±
Labor Robert Poole 12,10247.3+0.9
Liberal Ray Stevens 9,89838.7+38.7
Greens Sally Spain2,0938.2-0.4
Independent Phil Connolly1,4775.8-3.0
Total formal votes25,57097.1+0.6
Informal votes7652.9-0.6
Turnout 26,33590.7-0.6
Two-party-preferred result
Labor Robert Poole 12,87655.0-2.6
Liberal Ray Stevens 10,55145.0+45.0
Labor hold Swing -2.6

Gladstone

Queensland state election, 2004: Gladstone
PartyCandidateVotes%±
Independent Liz Cunningham 14,05755.3+4.6
Labor Julianne Grice9,47137.3-7.8
National John Todd1,8817.4+5.1
Total formal votes25,40998.3-0.5
Informal votes4261.7+0.5
Turnout 25,83593.6-0.8
Two-candidate-preferred result
Independent Liz Cunningham 15,24861.2+7.7
Labor Julianne Grice9,64838.8-7.7
Independent hold Swing +7.7

Glass House

Queensland state election, 2004: Glass House
PartyCandidateVotes%±
Labor Carolyn Male 13,00348.8+8.0
National John Longhurst8,90733.4+15.4
One Nation Santo Ferraro2,4819.3-11.1
Greens Eve Scopes2,2508.4+1.8
Total formal votes26,64198.0-0.2
Informal votes5512.0+0.2
Turnout 27,19292.4-1.1
Two-party-preferred result
Labor Carolyn Male 14,54058.9-0.7
National John Longhurst10,12841.1+0.7
Labor hold Swing -0.7

Greenslopes

Queensland state election, 2004: Greenslopes
PartyCandidateVotes%±
Labor Gary Fenlon 13,01152.7-2.7
Liberal Natalie Garratt8,46034.2+3.4
Greens Darryl Rosin2,3759.6-0.4
Independent Warren Simondson8553.5+3.5
Total formal votes24,70198.4+0.4
Informal votes3981.6-0.4
Turnout 25,09991.5-1.1
Two-party-preferred result
Labor Gary Fenlon 14,06461.0-3.1
Liberal Natalie Garratt8,98139.0+3.1
Labor hold Swing -3.1

Gregory

Queensland state election, 2004: Gregory
PartyCandidateVotes%±
National Vaughan Johnson 10,67462.0+2.7
Labor Shane Guley5,20430.2-10.5
One Nation Ian Espie1,3347.8+7.8
Total formal votes17,21298.4+1.1
Informal votes2861.6-1.1
Turnout 17,49891.8-1.2
Two-party-preferred result
National Vaughan Johnson 11,15567.4+8.1
Labor Shane Guley5,40432.6-8.1
National hold Swing +8.1

Gympie

Queensland state election, 2004: Gympie
PartyCandidateVotes%±
Independent Elisa Roberts 9,03133.4+33.4
Labor Rae Gate6,94625.7-7.7
National Christian Rowan 6,71824.9+0.2
Independent Wayne Sachs1,6756.2+6.2
One Nation Colin Bailey1,5085.6-20.1
Greens Glenda Stasse1,0493.9+3.9
Independent Martin Poole770.3+0.3
Total formal votes27,00498.5+0.0
Informal votes4141.5-0.0
Turnout 27,41892.8-0.9
Two-candidate-preferred result
Independent Elisa Roberts 12,28560.1+60.1
Labor Rae Gate8,17239.9-6.8
Independent gain from One Nation Swing N/A

Hervey Bay

Queensland state election, 2004: Hervey Bay
PartyCandidateVotes%±
Labor Andrew McNamara 11,61045.1+2.4
National Bernie Martin9,25735.9+18.7
Independent David Dalgleish 3,25012.6+12.6
Greens Jacqueline Goodfellow1,4355.6+5.6
Independent Glen Poulton2190.8+0.8
Total formal votes25,77198.1-0.3
Informal votes5021.9+0.3
Turnout 26,27392.9-1.0
Two-party-preferred result
Labor Andrew McNamara 12,39554.0-3.6
National Bernie Martin10,57546.0+46.0
Labor hold Swing -3.6

Hinchinbrook

Queensland state election, 2004: Hinchinbrook
PartyCandidateVotes%±
National Marc Rowell 8,61941.8+13.0
Labor Guni Liepins4,98224.2-1.9
Independent Andrew Lancini4,41921.4+4.0
One Nation Trevor Mitchell2,60212.6-13.8
Total formal votes20,62298.2-0.0
Informal votes3741.8+0.0
Turnout 20,99692.8-0.3
Two-candidate-preferred result
National Marc Rowell 9,82460.9+8.1
Independent Andrew Lancini6,31239.1+39.1
National hold Swing +8.1

Inala

Queensland state election, 2004: Inala
PartyCandidateVotes%±
Labor Henry Palaszczuk 14,86568.2+0.1
Liberal Christopher Cramond2,91113.3+3.0
One Nation George Pugh2,1079.7+9.7
Greens Nigel Quinlan1,2965.9+5.9
Independent Adrian Skerritt6332.9+2.9
Total formal votes21,81297.3-0.2
Informal votes6112.7+0.2
Turnout 22,42391.1-2.4
Two-party-preferred result
Labor Henry Palaszczuk 16,19281.0+9.5
Liberal Christopher Cramond3,79319.0+19.0
Labor hold Swing +9.5

Indooroopilly

Queensland state election, 2004: Indooroopilly
PartyCandidateVotes%±
Liberal Allan Pidgeon9,88843.0+5.8
Labor Ronan Lee 9,41940.9+2.2
Greens Chris Head3,33414.5+4.4
One Nation John Drew3641.6-2.2
Total formal votes23,00598.9+0.0
Informal votes2551.1-0.0
Turnout 23,26089.5-0.8
Two-party-preferred result
Labor Ronan Lee 11,48052.1-0.8
Liberal Allan Pidgeon10,56447.9+0.8
Labor hold Swing -0.8

Ipswich

Queensland state election, 2004: Ipswich
PartyCandidateVotes%±
Labor Rachel Nolan 15,77564.2+14.4
Liberal Bob Harper 6,24725.4+14.7
Greens Clare Rudkin1,5906.5+3.9
Independent Colene Hughes9473.9+3.9
Total formal votes24,55997.9-0.5
Informal votes5302.1+0.5
Turnout 25,08993.3-1.0
Two-party-preferred result
Labor Rachel Nolan 16,32671.0+4.2
Liberal Bob Harper 6,66829.0+29.0
Labor hold Swing +4.2

Ipswich West

Queensland state election, 2004: Ipswich West
PartyCandidateVotes%±
Labor Don Livingstone 11,72049.0+3.1
Liberal Jean Bray7,53631.5+31.5
One Nation Alan Price3,09012.9-12.7
Greens Sarai O'Reilly-Reis1,1344.7+0.4
Independent Michael Ward4491.9+1.9
Total formal votes23,92998.0-0.4
Informal votes4812.0+0.4
Turnout 24,41093.2-1.5
Two-party-preferred result
Labor Don Livingstone 12,67859.4+2.1
Liberal Jean Bray8,66140.6+40.6
Labor hold Swing +2.1

Kallangur

Queensland state election, 2004: Kallangur
PartyCandidateVotes%±
Labor Ken Hayward 13,09951.9-6.4
National Fay Driscoll6,68826.5+26.5
One Nation Howard Shepherd3,27513.0+13.0
Greens Suzi Tooke2,1608.6+1.3
Total formal votes25,22297.5+0.2
Informal votes6382.5-0.2
Turnout 25,86092.8-0.9
Two-party-preferred result
Labor Ken Hayward 14,26563.7-7.7
National Fay Driscoll8,14336.3+36.3
Labor hold Swing -7.7

Kawana

Queensland state election, 2004: Kawana
PartyCandidateVotes%±
Labor Chris Cummins 12,57044.3+1.8
Liberal Harry Burnett11,93442.0+3.6
One Nation Paul Westbury2,0607.3-11.8
Greens Susan McLeod1,8266.4+6.4
Total formal votes28,39098.3+0.3
Informal votes4951.7-0.3
Turnout 28,88591.9-1.2
Two-party-preferred result
Labor Chris Cummins 13,73751.5-1.1
Liberal Harry Burnett12,94948.5+1.1
Labor hold Swing -1.1

Keppel

Queensland state election, 2004: Keppel
PartyCandidateVotes%±
Labor Paul Hoolihan 10,63246.5+3.5
National Neil Fisher8,77138.4-4.6
One Nation Herb Clarke1,8228.0+8.0
Democrats Naomi Johns9434.1+4.1
Independent John Murphy3771.6+1.6
Independent Bruce Piggott3081.3+1.3
Total formal votes22,85398.1-0.1
Informal votes4471.9+0.1
Turnout 23,30092.1-0.9
Two-party-preferred result
Labor Paul Hoolihan 11,29253.8+5.3
National Neil Fisher9,70646.2-5.3
Labor gain from National Swing +5.3

Kurwongbah

Queensland state election, 2004: Kurwongbah
PartyCandidateVotes%±
Labor Linda Lavarch 16,14854.6-8.4
National Terry Orreal9,32331.5+31.5
Greens Daniel Boon2,2457.6+1.0
One Nation Dean Westbury1,1844.0+4.0
Independent Connie Wood7012.4+2.4
Total formal votes29,60198.2+0.6
Informal votes5541.8-0.6
Turnout 30,15593.6-0.8
Two-party-preferred result
Labor Linda Lavarch 17,12862.5-10.2
National Terry Orreal10,29937.5+37.5
Labor hold Swing -10.2

Lockyer

Queensland state election, 2004: Lockyer
PartyCandidateVotes%±
National Ian Rickuss 8,67534.8+17.9
Labor John Kelly7,89731.7+4.2
One Nation Bill Flynn 5,11020.5-7.8
Independent Peter Prenzler 2,0808.4+8.4
Greens Marie Johnston1,1324.5+1.7
Total formal votes24,89497.8-0.4
Informal votes5642.2+0.4
Turnout 25,45893.1-1.4
Two-party-preferred result
National Ian Rickuss 10,91454.1+54.1
Labor John Kelly9,25245.9+3.2
National gain from One Nation Swing N/A

Logan

Queensland state election, 2004: Logan
PartyCandidateVotes%±
Labor John Mickel 15,11463.8-8.5
National Joy Drescher5,79924.5-3.2
Greens Eileen Brown2,0838.8+8.8
Independent Ron Frood6992.9+2.9
Total formal votes23,69596.9+2.5
Informal votes7463.1-2.5
Turnout 24,44191.6-1.0
Two-party-preferred result
Labor John Mickel 15,73371.2-1.1
National Joy Drescher6,34928.8+1.1
Labor hold Swing -1.1

Lytton

Queensland state election, 2004: Lytton
PartyCandidateVotes%±
Labor Paul Lucas 15,12861.8-5.1
Liberal Glenn Weymouth7,10429.0+7.1
Greens Panche Hadzi-Andonov2,2429.2-2.0
Total formal votes24,47497.9+0.7
Informal votes5272.1-0.7
Turnout 25,00193.2-1.5
Two-party-preferred result
Labor Paul Lucas 15,95867.9-6.5
Liberal Glenn Weymouth7,55332.1+6.5
Labor hold Swing -6.5

Mackay

Queensland state election, 2004: Mackay
PartyCandidateVotes%±
Labor Tim Mulherin 13,82455.9-2.8
National Craig Joy6,60326.7-4.6
One Nation John Bonaventura2,51110.2+10.2
Greens Jen Hayward1,7807.2+7.2
Total formal votes24,71898.0+0.3
Informal votes5092.0-0.3
Turnout 25,22791.3-0.5
Two-party-preferred result
Labor Tim Mulherin 14,81665.8+2.3
National Craig Joy7,70334.2-2.3
Labor hold Swing +2.3

Mansfield

Queensland state election, 2004: Mansfield
PartyCandidateVotes%±
Labor Phil Reeves 13,36853.9+0.5
Liberal John Olive9,53538.5+3.8
Greens Jan McNicol1,8947.6+7.6
Total formal votes24,79798.1-0.1
Informal votes4891.9+0.1
Turnout 25,28692.9-1.0
Two-party-preferred result
Labor Phil Reeves 14,06758.6+0.0
Liberal John Olive9,95541.4-0.0
Labor hold Swing +0.0

Maroochydore

Queensland state election, 2004: Maroochydore
PartyCandidateVotes%±
National Fiona Simpson 11,72046.0+6.2
Labor Debbie Blumel9,62637.8-3.3
Greens Lindsay Holt2,0237.9+7.9
One Nation Patrick Rozanski1,1834.6-14.5
Independent Anita Gordon9073.6+3.6
Total formal votes25,45998.3+0.3
Informal votes4491.7-0.3
Turnout 25,90889.3-0.7
Two-party-preferred result
National Fiona Simpson 12,70354.1+3.3
Labor Debbie Blumel10,79445.9-3.3
National hold Swing +3.3

Maryborough

Queensland state election, 2004: Maryborough
PartyCandidateVotes%±
Independent Chris Foley 16,31464.9+64.9
Labor Doug Loggie7,55630.1-11.9
Greens Stephen Walker1,2715.1+5.1
Total formal votes25,14197.8+0.2
Informal votes5722.2-0.2
Turnout 25,71394.2-0.9
Two-candidate-preferred result
Independent Chris Foley 16,66468.0+68.0
Labor Doug Loggie7,84932.0-17.5
Independent hold Swing +68.0

Mirani

Queensland state election, 2004: Mirani
PartyCandidateVotes%±
National Ted Malone 11,73351.3+16.4
Labor Mark D'Elboux7,95534.8+1.6
One Nation Rob Robinson2,43410.6-10.9
Independent Ed Vaughan7413.2-0.1
Total formal votes22,86398.3-0.3
Informal votes3931.7+0.4
Turnout 23,25693.3-1.0
Two-party-preferred result
National Ted Malone 12,95860.6+6.8
Labor Mark D'Elboux8,40939.4-6.8
National hold Swing +6.8

Moggill

Queensland state election, 2004: Moggill
PartyCandidateVotes%±
Liberal Bruce Flegg 13,25552.1+11.7
Labor Lisa Rayner9,07535.6-2.9
Greens Lenore Taylor3,13312.3+5.9
Total formal votes25,46398.8+0.3
Informal votes3171.2-0.3
Turnout 25,78092.6-0.3
Two-party-preferred result
Liberal Bruce Flegg 13,86756.3+5.4
Labor Lisa Rayner10,74943.7-5.4
Liberal hold Swing +5.4

Mount Coot-tha

Queensland state election, 2004: Mount Coot-tha
PartyCandidateVotes%±
Labor Andrew Fraser 10,45744.2-6.8
Liberal Ray Sargent7,11230.1+3.5
Greens Andrew Carroll5,56823.6+11.7
Independent Dave Noke5052.1+2.1
Total formal votes23,64298.7+0.2
Informal votes3191.3-0.2
Turnout 23,96186.5-2.2
Two-party-preferred result
Labor Andrew Fraser 13,17061.5-4.6
Liberal Ray Sargent8,22938.5+4.6
Labor hold Swing -4.6

Mount Gravatt

Queensland state election, 2004: Mount Gravatt
PartyCandidateVotes%±
Labor Judy Spence 13,31756.5+1.9
Liberal Richard Leworthy8,41835.7+8.7
One Nation Karen Bracken9634.1-5.2
Independent J.F. Barnes8923.8+3.8
Total formal votes23,59097.9-0.1
Informal votes5072.1+0.1
Turnout 24,09791.5-2.3
Two-party-preferred result
Labor Judy Spence 13,68860.3-3.8
Liberal Richard Leworthy9,00439.7+3.8
Labor hold Swing -3.8

Mount Isa

Queensland state election, 2006: Mount Isa
PartyCandidateVotes%±
Labor Betty Kiernan 7,70556.5-5.3
National Roy Collins4,38432.2-1.5
Family First Merlin Manners1,54411.3+11.3
Total formal votes13,63398.0-0.1
Informal votes2722.0+0.1
Turnout 13,90584.6-2.1
Two-party-preferred result
Labor Betty Kiernan 8,15662.3-1.9
National Roy Collins4,93937.7+1.9
Labor hold Swing -1.9

Mount Ommaney

Queensland state election, 2004: Mount Ommaney
PartyCandidateVotes%±
Labor Julie Attwood 13,75655.4+3.4
Liberal Keith Hamilton8,84035.6+15.9
Greens Clive Brazier1,8267.3+2.5
Independent Wayne Kirk4291.7+1.7
Total formal votes24,85198.7+0.0
Informal votes3271.3-0.0
Turnout 25,17892.7-0.1
Two-party-preferred result
Labor Julie Attwood 14,92161.6+2.9
Liberal Keith Hamilton9,29038.4+38.4
Labor hold Swing +2.9

Mudgeeraba

Queensland state election, 2004: Mudgeeraba
PartyCandidateVotes%±
Labor Dianne Reilly 10,99444.5+3.2
Liberal Scott Paterson10,38642.1+11.5
Greens Nicole Chegwyn1,8807.6-1.3
One Nation Steve Moir1,0754.4+4.4
Independent Gary Pead3481.4+1.4
Total formal votes24,68397.7+0.9
Informal votes5772.3-0.9
Turnout 25,26089.4-1.7
Two-party-preferred result
Labor Dianne Reilly 11,86451.9-4.9
Liberal Scott Paterson11,01748.1+4.9
Labor hold Swing -4.9

Mulgrave

Queensland state election, 2004: Mulgrave
PartyCandidateVotes%±
Labor Warren Pitt 11,92651.4-2.2
National Desley Vella8,04334.6+14.6
One Nation Arietta Mitchell2,65411.4-14.9
Independent Dominic Frisone5902.5+2.5
Total formal votes23,21398.0-0.3
Informal votes4742.0+0.3
Turnout 23,68791.6-0.5
Two-party-preferred result
Labor Warren Pitt 12,44157.7-3.6
National Desley Vella9,11342.3+42.3
Labor hold Swing -3.6

Mundingburra

Queensland state election, 2004: Mundingburra
PartyCandidateVotes%±
Labor Lindy Nelson-Carr 11,09945.8-3.1
Liberal Steve Hawker7,90632.6+4.1
Greens Matt Grantham1,9588.1+4.3
One Nation John Weil1,8507.6-9.4
Independent Sandra Hubert1,4035.8+5.8
Total formal votes24,21697.9-0.1
Informal votes5192.1+0.1
Turnout 24,73590.4-1.1
Two-party-preferred result
Labor Lindy Nelson-Carr 12,31456.2-5.2
Liberal Steve Hawker9,59043.8+5.2
Labor hold Swing -5.2

Murrumba

Queensland state election, 2004: Murrumba
PartyCandidateVotes%±
Labor Dean Wells 15,92257.2-5.3
Liberal Susan Haskell9,24733.2+14.3
Greens Rick Pass2,6699.6+9.6
Total formal votes27,83897.5+0.1
Informal votes6992.5-0.1
Turnout 28,53793.1-1.1
Two-party-preferred result
Labor Dean Wells 16,54862.7-8.4
Liberal Susan Haskell9,84837.3+8.4
Labor hold Swing -8.4

Nanango

Queensland state election, 2004: Nanango
PartyCandidateVotes%±
Independent Dorothy Pratt 9,98945.7-0.5
National Nina Temperton6,01727.5+1.7
Labor Nick Holliday3,66716.8-11.3
One Nation Bob Gold1,5507.1+7.1
Greens Desiree Mahoney6463.0+3.0
Total formal votes21,86998.3+0.4
Informal votes3681.7-0.4
Turnout 22,23793.1-1.2
Two-candidate-preferred result
Independent Dorothy Pratt 11,55362.7-4.4
National Nina Temperton6,86437.3+37.3
Independent hold Swing -4.4

Nicklin

Queensland state election, 2004: Nicklin
PartyCandidateVotes%±
Independent Peter Wellington 15,61759.5+13.2
Labor Linda Hanson4,13115.7-1.2
National Leo Woodward3,76214.3+6.5
Greens Robert Winny1,3735.2+1.5
One Nation Clinton Booth1,3545.2-10.8
Total formal votes26,23798.6-0.2
Informal votes3621.4+0.2
Turnout 26,59991.6-1.1
Two-candidate-preferred result
Independent Peter Wellington 18,44779.6+6.2
Labor Linda Hanson4,74120.4+20.4
Independent hold Swing +6.2

Noosa

Queensland state election, 2004: Noosa
PartyCandidateVotes%±
Labor Cate Molloy 13,70248.4+6.4
Liberal Glen Elmes 9,96935.2-5.1
Greens Jennie Harvie2,89310.2+10.2
One Nation Ernest Lake1,7186.1-11.5
Total formal votes28,28298.5+0.4
Informal votes4381.5-0.4
Turnout 28,72090.4-0.9
Two-party-preferred result
Labor Cate Molloy 15,32958.7+7.8
Liberal Glen Elmes 10,80241.3-7.8
Labor hold Swing +7.8

Nudgee

Queensland state election, 2004: Nudgee
PartyCandidateVotes%±
Labor Neil Roberts 15,42163.4-11.7
Liberal Lorne Thurgar6,72527.7+2.8
Greens Mark Carey-Smith2,1678.9+8.9
Total formal votes24,31398.1+1.6
Informal votes4641.9-1.6
Turnout 24,77792.2-1.5
Two-party-preferred result
Labor Neil Roberts 16,18269.3-5.8
Liberal Lorne Thurgar7,16030.7+5.8
Labor hold Swing -5.8

Pumicestone

Queensland state election, 2004: Pumicestone
PartyCandidateVotes%±
Labor Carryn Sullivan 12,77847.9+1.6
Liberal Pat Daly9,80336.8+19.0
One Nation Thomas Hobbins2,5649.6-6.5
Greens Lyn Dickinson1,5135.7+3.2
Total formal votes26,65897.9-0.3
Informal votes5582.1+0.3
Turnout 27,21692.4-1.4
Two-party-preferred result
Labor Carryn Sullivan 13,61255.4-10.7
Liberal Pat Daly10,94544.6+10.7
Labor hold Swing -10.7

Redcliffe

Queensland state election, 2004: Redcliffe
PartyCandidateVotes%±
Labor Ray Hollis 12,06250.1-6.5
Liberal Terry Rogers 8,58235.6+12.2
Independent Rob McJannett3,44114.3+14.3
Total formal votes24,08597.7+0.1
Informal votes5782.3-0.1
Turnout 24,66392.7-0.2
Two-party-preferred result
Labor Ray Hollis 12,66857.1-10.5
Liberal Terry Rogers 9,51842.9+10.5
Labor hold Swing -10.5

Redlands

Queensland state election, 2004: Redlands
PartyCandidateVotes%±
Labor John English 13,32053.4+4.8
National John Hegarty 9,13736.7+7.5
One Nation John Walter1,2585.0+5.0
Greens Lyndon Harris1,2154.9+4.9
Total formal votes24,93098.2+0.9
Informal votes4671.8-0.9
Turnout 25,39793.2-1.1
Two-party-preferred result
Labor John English 13,90058.5+1.6
National John Hegarty 9,87641.5-1.6
Labor hold Swing +1.6

Robina

Queensland state election, 2004: Robina
PartyCandidateVotes%±
Liberal Bob Quinn 14,27555.0+0.9
Labor Bruce Simmonds9,68437.3-8.7
Greens Kelly Houston2,0207.8+7.8
Total formal votes25,97997.7+2.4
Informal votes6152.3-2.4
Turnout 26,59488.5-1.6
Two-party-preferred result
Liberal Bob Quinn 14,61158.8+4.8
Labor Bruce Simmonds10,24741.2-4.8
Liberal hold Swing +4.8

Rockhampton

Queensland state election, 2004: Rockhampton
PartyCandidateVotes%±
Labor Robert Schwarten 15,53969.0-0.1
National Pamela Olive6,99731.0+9.1
Total formal votes22,53697.4-0.1
Informal votes5892.6+0.1
Turnout 23,12592.8-0.6
Labor hold Swing -5.2

Sandgate

Queensland state election, 2004: Sandgate
PartyCandidateVotes%±
Labor Gordon Nuttall 13,23554.2-12.6
Liberal Luke Howarth 7,38130.2+10.1
Greens Susan Black3,25313.3+13.3
Independent Ron Eaton2791.1-12.0
Independent Rod McDonough2591.1+1.1
Total formal votes24,40798.0+0.3
Informal votes5052.0-0.3
Turnout 24,91292.8-1.3
Two-party-preferred result
Labor Gordon Nuttall 14,25864.0-10.5
Liberal Luke Howarth 8,02236.0+10.5
Labor hold Swing -10.5

South Brisbane

Queensland state election, 2004: South Brisbane
PartyCandidateVotes%±
Labor Anna Bligh 12,84853.1-6.8
Liberal Alister Cowper5,83924.1+4.4
Greens Juanita Wheeler4,84720.0+11.0
Independent Lynda Hansen6802.8+2.8
Total formal votes24,21497.8+0.4
Informal votes5522.2-0.4
Turnout 24,76685.7-2.9
Two-party-preferred result
Labor Anna Bligh 16,15071.1-3.8
Liberal Alister Cowper6,57728.9+3.8
Labor hold Swing -3.8

Southern Downs

Queensland state election, 2004: Southern Downs
PartyCandidateVotes%±
National Lawrence Springborg 17,77569.7+18.1
Labor Leanne King5,52321.6-3.9
One Nation John Coyle1,3495.3+5.3
Greens Jonathan Rihan8663.4+3.4
Total formal votes25,51398.2+0.0
Informal votes4601.8-0.0
Turnout 25,97393.2-0.5
Two-party-preferred result
National Lawrence Springborg 18,43575.2+8.4
Labor Leanne King6,07424.8-8.4
National hold Swing +8.4

Southport

Queensland state election, 2004: Southport
PartyCandidateVotes%±
Labor Peter Lawlor 13,10654.1+3.2
National Bob Bennett8,54635.3+6.2
Greens Ian Latto1,5496.4+6.4
One Nation Ron Williams1,0064.2-11.0
Total formal votes24,20797.5-0.1
Informal votes6142.5+0.1
Turnout 24,82188.6-1.6
Two-party-preferred result
Labor Peter Lawlor 13,72060.0-0.8
National Bob Bennett9,15240.0+0.8
Labor hold Swing -0.8

Springwood

Queensland state election, 2004: Springwood
PartyCandidateVotes%±
Labor Barbara Stone 13,28854.9+9.3
National Andrea Ross8,93036.9+18.1
Greens John Reddington2,0008.3+8.3
Total formal votes24,21897.9+0.4
Informal votes5152.1-0.4
Turnout 24,73392.1-0.6
Two-party-preferred result
Labor Barbara Stone 13,90959.7-0.7
National Andrea Ross9,38140.3+0.7
Labor hold Swing -0.7

Stafford

Queensland state election, 2004: Stafford
PartyCandidateVotes%±
Labor Terry Sullivan 14,26259.1-6.3
Liberal Christopher Kelly7,20729.9+5.7
Greens Sue Meehan2,66511.0+0.5
Total formal votes24,13498.0+0.3
Informal votes4822.0-0.3
Turnout 24,61691.6-1.7
Two-party-preferred result
Labor Terry Sullivan 15,27466.3-6.1
Liberal Christopher Kelly7,75133.7+6.1
Labor hold Swing -6.1

Stretton

Queensland state election, 2004: Stretton
PartyCandidateVotes%±
Labor Stephen Robertson 15,86659.9-2.8
Liberal Paul Wood8,52232.2-5.1
Greens Stan Cajdler2,1108.0+8.0
Total formal votes26,49898.0+1.7
Informal votes5272.0-1.7
Turnout 27,02590.7-1.3
Two-party-preferred result
Labor Stephen Robertson 16,60165.0+2.3
Liberal Paul Wood8,92535.0-2.3
Labor hold Swing +2.3

Surfers Paradise

Queensland state election, 2004: Surfers Paradise
PartyCandidateVotes%±
Liberal John-Paul Langbroek 11,34844.7+44.7
Labor David Parrish6,46225.5-12.8
Independent Lex Bell 5,81022.9+22.9
Greens Graham Lapthorne1,7606.9-5.1
Total formal votes25,38097.7+0.8
Informal votes6022.3-0.8
Turnout 25,98286.6-1.6
Two-party-preferred result
Liberal John-Paul Langbroek 13,01463.9+63.9
Labor David Parrish7,35036.1-8.6
Liberal gain from Independent Swing N/A

Tablelands

Queensland state election, 2004: Tablelands
PartyCandidateVotes%±
One Nation Rosa Lee Long 10,14047.0+11.0
National Cheryl Tonkin5,73026.5+10.1
Labor Arthur Yates5,72126.5+1.7
Total formal votes21,59198.0-0.6
Informal votes4432.0+0.6
Turnout 22,03491.7-1.2
Two-candidate-preferred result
One Nation Rosa Lee Long 10,95562.4-1.4
National Cheryl Tonkin6,59837.6+37.6
One Nation hold Swing -1.4

Thuringowa

Queensland state election, 2004: Thuringowa
PartyCandidateVotes%±
Labor Craig Wallace 11,64744.8+3.8
National Sandra Chesney6,63525.5+6.8
Independent David Moyle3,33812.8+12.8
One Nation Bill Hankin2,5509.8+9.8
Greens Meg Davis1,4915.7+5.7
Independent John Ryan3501.3+1.3
Total formal votes26,01197.2-0.3
Informal votes7552.8+0.3
Turnout 26,76692.1-0.9
Two-party-preferred result
Labor Craig Wallace 12,98257.9+4.3
National Sandra Chesney9,44142.1+42.1
Labor hold Swing +4.3

Toowoomba North

Queensland state election, 2004: Toowoomba North
PartyCandidateVotes%±
Labor Kerry Shine 11,78552.2+8.1
National Ian Douglas8,56737.9-1.8
Greens Michael Kane1,1625.1+5.1
One Nation Sean Rycard1,0834.8+4.8
Total formal votes22,59798.4+0.7
Informal votes3581.6-0.7
Turnout 22,95592.2-1.0
Two-party-preferred result
Labor Kerry Shine 12,38857.3+5.4
National Ian Douglas9,23542.7-5.4
Labor hold Swing +5.4

Toowoomba South

Queensland state election, 2004: Toowoomba South
PartyCandidateVotes%±
National Mike Horan 12,22952.9+9.1
Labor Andrew Irvine7,53632.6+0.1
One Nation Dennis Kronk1,7627.6-12.4
Greens Karey Harrison1,6087.0+7.0
Total formal votes23,13598.3-0.1
Informal votes4041.7+0.1
Turnout 23,53992.3-0.2
Two-party-preferred result
National Mike Horan 13,36461.5+3.6
Labor Andrew Irvine8,36938.5-3.6
National hold Swing +3.6

Townsville

Queensland state election, 2004: Townsville
PartyCandidateVotes%±
Labor Mike Reynolds 9,47842.4-9.6
Liberal Margaret Shaw7,22432.3-3.2
Greens Theresa Millard2,90813.0+13.0
One Nation Ted Ive1,8788.4+8.4
Independent Delena Foster5932.7+2.7
Independent Billy Tait2511.1-3.2
Total formal votes22,33297.7+0.9
Informal votes5142.3-0.9
Turnout 22,84688.3-1.2
Two-party-preferred result
Labor Mike Reynolds 10,81355.3-4.0
Liberal Margaret Shaw8,73044.7+4.0
Labor hold Swing -4.0

Warrego

Queensland state election, 2004: Warrego
PartyCandidateVotes%±
National Howard Hobbs 11,40358.3+24.5
Labor Russell Burns3,55518.2+1.9
Independent Ruth Spencer2,08810.7+10.7
One Nation Robert Burton1,7929.2-14.6
Independent Malcolm Groves7293.7+3.7
Total formal votes19,56798.4-0.4
Informal votes3241.6+0.4
Turnout 19,89192.7-0.6
Two-party-preferred result
National Howard Hobbs 13,08074.8+24.5
Labor Russell Burns4,41525.2+25.2
National hold Swing +24.5

Waterford

Queensland state election, 2004: Waterford
PartyCandidateVotes%±
Labor Tom Barton 13,26657.3+1.1
Liberal Andrew Harbour6,33427.4+12.6
One Nation Leonce Kealy2,0008.6-16.2
Greens Serge Le Royer1,5326.6+6.6
Total formal votes23,13297.2-0.0
Informal votes6612.8+0.0
Turnout 23,79389.7-1.6
Two-party-preferred result
Labor Tom Barton 14,21466.5-1.5
Liberal Andrew Harbour7,15333.5+33.5
Labor hold Swing -1.5

Whitsunday

Queensland state election, 2004: Whitsunday
PartyCandidateVotes%±
Labor Jan Jarratt 11,57251.6+5.3
Independent Harry Black 4,72121.0+21.0
National Dan Van Blarcom3,60816.1-8.1
Greens Lindsay Hains1,4496.5+6.5
One Nation Henk Schipper1,0884.8-7.6
Total formal votes22,43898.0-0.5
Informal votes4512.0+0.5
Turnout 22,88990.5-1.1
Two-candidate-preferred result
Labor Jan Jarratt 12,54864.8+5.2
Independent Harry Black 6,82635.2+35.2
Labor hold Swing +5.2

Woodridge

Queensland state election, 2004: Woodridge
PartyCandidateVotes%±
Labor Desley Scott 14,71970.3+13.0
Liberal Dilys Bradbury4,34622.1+22.1
Greens James Brown2,37111.3+11.3
Total formal votes20,92496.5-0.8
Informal votes7613.5+0.8
Turnout 21,68589.3-1.8
Two-party-preferred result
Labor Desley Scott 15,36077.9+6.8
Liberal Dilys Bradbury4,34622.1+22.1
Labor hold Swing +6.8

Yeerongpilly

Queensland state election, 2004: Yeerongpilly
PartyCandidateVotes%±
Labor Simon Finn 13,05453.6-8.2
Liberal Michael Kucera6,28925.8+4.5
Greens Wayne Wadsworth3,19113.1+5.4
One Nation Barry Weedon1,1024.5+4.5
Independent Andrew Lamb7293.0+3.0
Total formal votes24,36597.9+0.1
Informal votes5092.1-0.1
Turnout 24,87491.8-0.4
Two-party-preferred result
Labor Simon Finn 14,82267.1-5.1
Liberal Michael Kucera7,27232.9+5.1
Labor hold Swing -5.1

See also

Related Research Articles

This is a list of members of the 51st Legislative Assembly of Queensland from 2004 to 2006, as elected at the 2004 state election held on 7 February 2004.

2004 Queensland state election

An election was held in the Australian state of Queensland on 7 February 2004 to elect the 89 members of the state's Legislative Assembly.

2001 Queensland state election

An election was held in the Australian state of Queensland on 17 February 2001 to elect the 89 members of the state's Legislative Assembly. The result of the election was the return of the Labor Party (ALP) government of Premier Peter Beattie, with an increased majority. Labor won 66 seats, easily the most it has ever won in Queensland and one of Labor’s best-ever results nationwide. There was a 10.07% swing towards Labor, while One Nation suffered a 13.98% swing against it, losing eight seats.

1995 Queensland state election

Elections were held in the Australian state of Queensland on 15 July 1995 to elect the 89 members of the state's Legislative Assembly.

Electoral district of Gaven state electoral district of Queensland, Australia

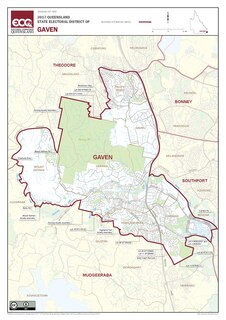
Gaven is an electoral district of the Legislative Assembly in the Australian state of Queensland. It was created out of the former district of Nerang and the southern segment of Albert in the 2001 redistribution, and encompasses the northern growth corridor of the Gold Coast. The current Member of Parliament is Meaghan Scanlon.

Cunningham was an electoral district of the Legislative Assembly in the Australian state of Queensland from 1888 to 2009.

Tablelands was an electoral district of the Legislative Assembly in the Australian state of Queensland.

A State Electoral District is an electorate within the Lower House or Legislative Assembly of Australian states and territories. Most state electoral districts send a single member to a state or territory's parliament using the preferential method of voting. The area of a state electoral district is dependent upon the Electoral Acts in the various states and vary in area between them. At present, there are 409 state electoral districts in Australia.

Electoral district of Maryborough state electoral district of Queensland, Australia

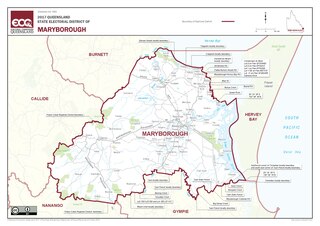
Maryborough is an electoral district of the Legislative Assembly in the Australian state of Queensland.

John Mickel (politician) Australian politician

Reginald John Mickel is an Australian politician. He was the Speaker of the Legislative Assembly of Queensland and the Labor member for Logan until the 2012 election. He was succeeded by Fiona Simpson as Speaker, as he did not contest the 2012 election.

1941 Queensland state election

Elections were held in the Australian state of Queensland on 29 March 1941 to elect the 62 members of the state's Legislative Assembly. The Labor government of Premier William Forgan Smith was seeking a fourth term in office.

1953 Queensland state election

Elections were held in the Australian state of Queensland on 7 March 1953 to elect the 75 members of the state's Legislative Assembly. The Labor government was seeking its eighth continuous term in office since the 1932 election. It was the first electoral test for Vince Gair, who had become Premier of Queensland 14 months earlier after the death of Ned Hanlon.

1923 Queensland state election

Elections were held in the Australian state of Queensland on 12 May 1923 to elect the 72 members of the state's Legislative Assembly. The Labor government was seeking its fourth continuous term in office since the 1915 election; it would be Premier Ted Theodore's second election.

1960 Queensland state election

Elections were held in the Australian state of Queensland on 28 May 1960 to elect the 78 members of the state's Legislative Assembly. The election followed the enactment of the Electoral Districts Act 1958 which increased the Assembly from 75 to 78 seats and modified the zonal system first established by Labor ahead of the 1950 election.

Elections were held in the Australian state of Queensland on 5 February 1908 to elect the 72 members of the state's Legislative Assembly.

1926 Queensland state election

Elections were held in the Australian state of Queensland on 8 May 1926 to elect the 72 members of the state's Legislative Assembly. The Labor government was seeking its fifth continuous term in office since the 1915 election. William McCormack was contesting his first election as Premier.

1963 Queensland state election

Elections were held in the Australian state of Queensland on 1 June 1963 to elect the 78 members of the state's Legislative Assembly.

Kennedy was an electoral district of the Legislative Assembly in the Australian state of Queensland.

Clermont was a Legislative Assembly electorate in the state of Queensland. The electorate was based on the town of Clermont and surrounding areas.

The electoral district of Woolloongabba was a Legislative Assembly electorate in the state of Queensland, Australia.

References

  1. Australian Government and Politics Database. "Parliament of Queensland, Assembly election, 7 February 2004" . Retrieved 22 February 2009.