Results of the Queensland state election, 2012

Last updated

Parliament of Queensland, Assembly election, 24 March 2012 [1] [2]
Legislative Assembly
<< 20092015 >>

Contents

Enrolled voters2,746,844
Votes cast2,499,612 Turnout 91.00+0.07
Informal votes53,797Informal2.15+0.21
Summary of votes by party
PartyPrimary votes%SwingSeatsChange
  Liberal National 1,214,40249.65+8.0578+44
  Labor 652,09226.66–15.597–44
  Katter's Australian Party 282,09811.53+11.532+2
  Greens 184,1477.53–0.840±0
  Family First 33,2691.36+0.540±0
  One Nation 2,5250.10–0.280±0
  Independent 77,2823.16–3.422–2
Total2,445,815  89 

This is a list of electoral district results for the Queensland 2012 election .

This is a list of current and former electoral divisions for the Legislative Assembly of Queensland, the state legislature for Queensland, Australia.

Results by Electoral district

Albert

Queensland state election, 2012: Albert
PartyCandidateVotes%±
Liberal National Mark Boothman 13,88849.59+10.43
Labor Margaret Keech 7,94328.36-21.69
Katter's Australian Adam Hollis3,04510.87+10.87
Family First Amanda Best1,6205.78+5.78
Greens Petrina Maizey1,5115.40-1.68
Total formal votes28,00797.17-0.33
Informal votes8172.83+0.33
Turnout 28,82491.43+1.13
Two-party-preferred result
Liberal National Mark Boothman 15,19861.89+18.36
Labor Margaret Keech 9,35838.11-18.36
Liberal National gain from Labor Swing +18.36

Algester

Queensland state election, 2012: Algester
PartyCandidateVotes%±
Liberal National Anthony Shorten 13,68750.72+15.22
Labor Karen Struthers 9,13433.85-18.78
Katter's Australian Gavan Duffy2,2868.47+8.47
Greens Justin Kerr1,8776.96-0.47
Total formal votes26,98497.33-0.38
Informal votes7402.67+0.38
Turnout 27,72492.82+0.99
Two-party-preferred result
Liberal National Anthony Shorten 14,73559.15+18.36
Labor Karen Struthers 10,17740.85-18.36
Liberal National gain from Labor Swing +18.36

Ashgrove

Queensland state election, 2012: Ashgrove
PartyCandidateVotes%±
Liberal National Campbell Newman 14,93251.81+14.55
Labor Kate Jones 10,54936.60-9.11
Greens Sandra Bayley2,6449.17-3.23
Katter's Australian Norman Wicks4781.66+1.66
Independent Trevor Jones1560.54+0.54
One Nation Ian Nelson640.22+0.22
Total formal votes28,82399.22+0.43
Informal votes2270.78-0.43
Turnout 29,05092.40+0.73
Two-party-preferred result
Liberal National Campbell Newman 15,53755.70+12.80
Labor Kate Jones 12,35844.30-12.80
Liberal National gain from Labor Swing +12.80

Aspley

Queensland state election, 2012: Aspley
PartyCandidateVotes%±
Liberal National Tracy Davis 17,92365.43+15.45
Labor Oskar Bronowicki6,44923.54-17.27
Greens David Forrest2,0357.43+0.58
Family First Allan Vincent9853.60+1.24
Total formal votes27,39298.40-0.10
Informal votes4451.60+0.10
Turnout 27,83794.42+1.29
Two-party-preferred result
Liberal National Tracy Davis 18,71871.75+17.29
Labor Oskar Bronowicki7,37028.25-17.29
Liberal National hold Swing +17.29

Barron River

Queensland state election, 2012: Barron River
PartyCandidateVotes%±
Liberal National Michael Trout 13,65245.71+1.88
Labor Steve Wettenhall 8,31727.85-15.40
Katter's Australian Brendan Fitzgerald4,73215.84+15.84
Greens Elaine Harding2,7369.16-3.76
Independent Mike Squire4311.44+1.44
Total formal votes29,86897.76+0.21
Informal votes6852.24-0.21
Turnout 30,55389.47-0.17
Two-party-preferred result
Liberal National Michael Trout 15,40659.48+11.80
Labor Steve Wettenhall 10,49440.52-11.80
Liberal National gain from Labor Swing +11.80

Beaudesert

Queensland state election, 2012: Beaudesert
PartyCandidateVotes%±
Liberal National Jon Krause 13,83547.11+9.21
Katter's Australian Aidan McLindon 7,74426.37+26.37
Labor Brett McCreadie4,10513.98-10.96
Greens Andy Grodecki2,4488.34+1.36
One Nation Jim Savage7602.59+2.59
Family First Walter Abrahamson4781.63+1.63
Total formal votes29,37097.84-0.43
Informal votes6482.16+0.43
Turnout 30,01892.57+0.39
Two-party-preferred result
Liberal National Jon Krause 14,83660.56+2.25
Katter's Australian Aidan McLindon 9,66139.44+39.44
Liberal National hold Swing +2.25

Brisbane Central

Queensland state election, 2012: Brisbane Central
PartyCandidateVotes%±
Liberal National Robert Cavallucci 12,20148.70+11.46
Labor Grace Grace 8,43533.67-8.49
Greens Anne Boccabella3,84215.33-1.67
Independent Ruth Bonnett5762.30+2.30
Total formal votes25,05498.35-0.15
Informal votes4201.65+0.15
Turnout 25,47486.89+0.52
Two-party-preferred result
Liberal National Robert Cavallucci 12,68954.88+10.85
Labor Grace Grace 10,43245.12-10.85
Liberal National gain from Labor Swing +10.85

Broadwater

Queensland state election, 2012: Broadwater
PartyCandidateVotes%±
Liberal National Verity Barton 13,58351.30+7.37
Labor Peta-Kaye Croft 8,37831.64-15.17
Katter's Australian Peter McCambridge1,4085.32+5.32
Independent Ron Clarke 1,2194.60+4.60
Greens James Brydges8513.21-1.78
Independent Liz Pforr5522.08+2.08
Family First Ben O'Brien4851.83+1.83
Total formal votes26,47697.71-0.13
Informal votes6202.29+0.13
Turnout 27,09688.57-0.09
Two-party-preferred result
Liberal National Verity Barton 14,51361.29+13.32
Labor Peta-Kaye Croft 9,16738.71-13.32
Liberal National gain from Labor Swing +13.32

Buderim

Queensland state election, 2012: Buderim
PartyCandidateVotes%±
Liberal National Steve Dickson 16,05662.17+5.15
Labor Chris Moore4,18116.19-13.26
Greens Susan Etheridge2,74910.64+2.39
Katter's Australian Lynette Bishop2,0037.76+7.76
Family First Tony Moore8383.24+0.81
Total formal votes25,82798.04-0.30
Informal votes5161.96+0.30
Turnout 26,34389.76-1.10
Two-party-preferred result
Liberal National Steve Dickson 17,32976.01+11.73
Labor Chris Moore5,46923.99-11.73
Liberal National hold Swing +11.73

Bulimba

Queensland state election, 2012: Bulimba
PartyCandidateVotes%±
Liberal National Aaron Dillaway 13,24446.70+9.63
Labor Di Farmer 12,16942.91-4.83
Greens Justin Bennett2,94710.39-1.25
Total formal votes28,36098.27-0.17
Informal votes4991.73+0.17
Turnout 28,85991.11+1.10
Two-party-preferred result
Liberal National Aaron Dillaway 13,69050.14+7.91
Labor Di Farmer 13,61549.86-7.91
Liberal National gain from Labor Swing +7.91

Bundaberg

Queensland state election, 2012: Bundaberg
PartyCandidateVotes%±
Liberal National Jack Dempsey 14,19353.16-0.55
Labor Cindy Hyland6,33523.73-17.85
Katter's Australian Doug Anderson4,11715.42+15.42
Family First Trevor Versace8413.15+3.15
Greens Peter Higgins7852.94-1.77
Independent Peter Wyatt4281.60+1.60
Total formal votes26,69997.59-0.51
Informal votes6582.41+0.51
Turnout 27,35791.38-0.42
Two-party-preferred result
Liberal National Jack Dempsey 15,90068.17+12.15
Labor Cindy Hyland7,42331.83-12.15
Liberal National hold Swing +12.15

Bundamba

Queensland state election, 2012: Bundamba
PartyCandidateVotes%±
Labor Jo-Ann Miller 10,94538.93-22.39
Liberal National Michael Kitzelmann10,02235.65+12.48
Katter's Australian Bernard Gaynor2,4618.75+8.75
Independent Angela Watson2,2137.87+7.87
Greens Jim Prentice1,4455.14-2.03
Family First Deborah Acason8973.19+0.55
Independent Alf Viskers1320.47+0.47
Total formal votes28,11597.38-0.22
Informal votes7562.62+0.22
Turnout 28,87191.08+0.58
Two-party-preferred result
Labor Jo-Ann Miller 12,35451.82-19.41
Liberal National Michael Kitzelmann11,48648.18+19.41
Labor hold Swing -19.41

Burdekin

Queensland state election, 2012: Burdekin
PartyCandidateVotes%±
Liberal National Rosemary Menkens 12,87347.99-2.49
Katter's Australian Ronald Wadforth7,04426.26+26.26
Labor Angela Zyla5,52020.58-23.18
Greens Pete Johnson7322.73-3.03
Family First Amanda Nickson6552.44+2.44
Total formal votes26,82498.10-0.10
Informal votes4891.90+0.10
Turnout 27,10790.96-0.45
Two-party-preferred result
Liberal National Rosemary Menkens 13,80862.47+9.32
Katter's Australian Ronald Wadforth8,29437.53+37.53
Liberal National hold Swing +9.32

Burleigh

Queensland state election, 2012: Burleigh
PartyCandidateVotes%±
Liberal National Michael Hart 14,22251.18+12.30
Labor Christine Smith 8,57230.85-15.96
Greens Jane Power2,3458.44+0.79
Katter's Australian Dean Fisher1,9767.11+7.11
Family First Jeremy Fredericks6712.41+0.50
Total formal votes27,78698.03+0.21
Informal votes5591.97-0.21
Turnout 28,34588.41-0.44
Two-party-preferred result
Liberal National Michael Hart 15,32461.05+15.95
Labor Christine Smith 9,77838.95-15.95
Liberal National gain from Labor Swing +15.95

Burnett

Queensland state election, 2012: Burnett
PartyCandidateVotes%±
Liberal National Stephen Bennett 11,36840.01-16.64
Independent Rob Messenger 6,82124.00+24.00
Labor Stuart Tomlinson4,61816.25-18.39
Katter's Australian Kevin Pauling4,54215.98+15.98
Greens David Eastland1,0663.75-1.23
Total formal votes28,41597.91-0.16
Informal votes6082.09+0.16
Turnout 29,02391.88-0.19
Two-party-preferred result
Liberal National Stephen Bennett 13,11058.50-2.60
Independent Rob Messenger 9,30241.50+41.50
Liberal National hold Swing N/A

Cairns

Queensland state election, 2012: Cairns
PartyCandidateVotes%±
Liberal National Gavin King 11,63242.51+2.76
Labor Kirsten Lesina7,52027.48-18.30
Katter's Australian Darren Hunt5,12518.73+18.73
Greens Geoff Holland1,9467.11-3.85
Independent John Piva1,1414.17+4.17
Total formal votes27,36497.68+0.09
Informal votes6632.32-0.09
Turnout 28,01587.83+0.99
Two-party-preferred result
Liberal National Gavin King 13,57358.87+13.02
Labor Kirsten Lesina9,48141.13-13.02
Liberal National gain from Labor Swing +13.02

Callide

Queensland state election, 2012: Callide
PartyCandidateVotes%±
Liberal National Jeff Seeney 14,66653.33-5.65
Katter's Australian Steve Ensby7,31826.61+26.61
Labor Melissa Newton4,05814.76-9.16
Greens Camilla Percy8923.24-0.59
Independent Duncan Scott5972.06+2.06
Total formal votes27,50198.46-0.13
Informal votes3971.54+0.13
Turnout 27,50192.32-0.57
Two-party-preferred result
Liberal National Jeff Seeney 15,22463.51-5.85
Katter's Australian Steve Ensby8,74736.49+36.49
Liberal National hold Swing -5.85

Caloundra

Queensland state election, 2012: Caloundra
PartyCandidateVotes%±
Liberal National Mark McArdle 17,28064.22+14.16
Labor Christine Anthony6,03722.44-14.41
Greens Allan McKay3,58913.34+3.71
Total formal votes26,90697.40-0.69
Informal votes7182.60+0.69
Turnout 27,62491.47+0.42
Two-party-preferred result
Liberal National Mark McArdle 17,91571.23+15.03
Labor Christine Anthony7,23628.77-15.03
Liberal National hold Swing +15.03

Capalaba

Queensland state election, 2012: Capalaba
PartyCandidateVotes%±
Liberal National Steve Davies 13,34546.54+9.63
Labor Michael Choi 11,00438.37-14.90
Greens Penny Allman-Payne2,1687.56-2.26
Katter's Australian Graeme Moorhouse1,7085.96+5.96
One Nation David Chidgey4501.57+1.57
Total formal votes28,67597.49-0.45
Informal votes7382.51+0.45
Turnout 29,41392.97+0.28
Two-party-preferred result
Liberal National Steve Davies 14,14453.73+13.40
Labor Michael Choi 12,18246.27-13.40
Liberal National gain from Labor Swing +13.40

Chatsworth

Queensland state election, 2012: Chatsworth
PartyCandidateVotes%±
Liberal National Steve Minnikin 16,39055.82+10.78
Labor Steve Kilburn 8,69429.61-14.26
Katter's Australian Sarah Henry1,8566.32+6.32
Greens Jason Cooney1,8366.25-0.79
Family First Axel Beard5851.99+1.99
Total formal votes29,36198.13-0.11
Informal votes5591.87+0.11
Turnout 29,92091.89-0.98
Two-party-preferred result
Liberal National Steve Minnikin 17,46463.94+14.08
Labor Steve Kilburn 9,84836.06-14.08
Liberal National gain from Labor Swing +14.08

Clayfield

Queensland state election, 2012: Clayfield
PartyCandidateVotes%±
Liberal National Tim Nicholls 17,46862.33+13.09
Labor Brent Davidson6,11521.60-14.94
Greens Luke Morey3,06810.84+0.17
Katter's Australian Will Keenan1,4835.24+5.24
Total formal votes28,31498.37-0.28
Informal votes4701.63+0.28
Turnout 28,78491.30+0.14
Two-party-preferred result
Liberal National Tim Nicholls 18,59770.56+14.72
Labor Brent Davidson7,76029.44-14.72
Liberal National hold Swing +14.72

Cleveland

Queensland state election, 2012: Cleveland
PartyCandidateVotes%±
Liberal National Mark Robinson 18,49761.89+15.88
Labor Jo Briskey7,90326.44-17.14
Greens Brad Scott2,2637.57+0.54
Independent Ronald Lambert1,2234.09+4.09
Total formal votes29,88698.02-0.21
Informal votes6031.98+0.21
Turnout 30,48993.01+0.44
Two-party-preferred result
Liberal National Mark Robinson 19,18568.10+17.82
Labor Jo Briskey8,98631.90-17.82
Liberal National hold Swing +17.82

Condamine

Queensland state election, 2012: Condamine
PartyCandidateVotes%±
Liberal National Ray Hopper 18,40958.30+10.64
Katter's Australian John Mathison6,73221.32+21.32
Labor Nev Swan4,47114.16-5.48
Greens Gabriele Tabikh1,2734.03+0.68
Independent Shane White6912.19+2.19
Total formal votes31,57698.02-0.38
Informal votes6371.98+0.38
Turnout 32,21394.19+0.46
Two-party-preferred result
Liberal National Ray Hopper 19,32470.10+8.54
Katter's Australian John Mathison8,24229.90+29.90
Liberal National hold Swing +8.54

Cook

Queensland state election, 2012: Cook
PartyCandidateVotes%±
Liberal National David Kempton 8,83237.51-4.90
Labor Jason O'Brien 7,63432.42-13.63
Katter's Australian Lachlan Bensted5,26122.34+22.34
Greens George Riley1,2955.50-1.15
One Nation James Evans5242.23+2.23
Total formal votes23,54698.49+0.29
Informal votes3611.51-0.29
Turnout 23,90786.26+0.43
Two-party-preferred result
Liberal National David Kempton 10,56353.43+5.67
Labor Jason O'Brien 9,20546.57-5.67
Liberal National gain from Labor Swing +5.67

Coomera

Queensland state election, 2012: Coomera
PartyCandidateVotes%±
Liberal National Michael Crandon 17,95161.89+14.76
Labor Graeme Higgs5,77119.90-22.93
Katter's Australian Peter Cobb2,90210.01+10.01
Greens Chris Wisbey1,7516.04-0.11
Independent Rowan Harrip6282.17+2.17
Total formal votes29,00397.30-0.18
Informal votes8052.70+0.18
Turnout 29,80890.63+1.03
Two-party-preferred result
Liberal National Michael Crandon 18,93273.26+21.35
Labor Graeme Higgs6,91026.74-21.35
Liberal National hold Swing +21.35

Currumbin

Queensland state election, 2012: Currumbin
PartyCandidateVotes%±
Liberal National Jann Stuckey 16,23758.84+7.77
Labor Calum Hyslop6,05121.93-14.65
Greens David Wyatt2,6249.51+0.31
Katter's Australian Steve Bowman1,9737.15+7.15
Family First Royston Pickering7102.57+2.57
Total formal votes27,59597.61-0.56
Informal votes6752.39+0.56
Turnout 28,27088.92-0.03
Two-party-preferred result
Liberal National Jann Stuckey 17,24570.19+13.30
Labor Calum Hyslop7,32529.81-13.30
Liberal National hold Swing +13.30

Dalrymple

Queensland state election, 2012: Dalrymple
PartyCandidateVotes%±
Katter's Australian Shane Knuth 13,98253.73+53.73
Liberal National Liz Schmidt7,57629.11-12.31
Labor Benjamin Gertz2,88611.09-11.06
Greens Jess Jones1,2304.73+1.57
Independent Jason Briskey1770.68+0.68
Independent Christopher Williamson1720.66+0.66
Total formal votes26,02398.53-0.26
Informal votes3881.47+0.26
Turnout 26,41190.47-0.89
Two-party-preferred result
Katter's Australian Shane Knuth 15,12665.22+65.22
Liberal National Liz Schmidt8,06734.78-20.40
Katter's Australian gain from Liberal National Swing N/A

Everton

Queensland state election, 2012: Everton
PartyCandidateVotes%±
Liberal National Tim Mander 16,36457.50+13.38
Labor Murray Watt 8,85131.10-13.29
Greens Bruce Hallett2,0537.21-1.86
Katter's Australian Denym Witherow1,1924.19+4.19
Total formal votes28,46098.47+0.10
Informal votes4421.53-0.10
Turnout 28,90293.64+0.38
Two-party-preferred result
Liberal National Tim Mander 17,12563.15+14.54
Labor Murray Watt 9,99136.85-14.54
Liberal National gain from Labor Swing +14.54

Ferny Grove

Queensland state election, 2012: Ferny Grove
PartyCandidateVotes%±
Liberal National Dale Shuttleworth 15,45854.36+15.07
Labor Geoff Wilson 8,92931.40-12.86
Greens Howard Nielsen4,05114.25+0.30
Total formal votes28,43898.27-0.31
Informal votes5011.73+0.31
Turnout 28,93994.05+0.94
Two-party-preferred result
Liberal National Dale Shuttleworth 16,06259.52+14.01
Labor Geoff Wilson 10,92240.48-14.01
Liberal National gain from Labor Swing +14.01

Gaven

Queensland state election, 2012: Gaven
PartyCandidateVotes%±
Liberal National Alex Douglas 15,17555.16+13.23
Labor Michael Riordan6,28922.86-16.94
Katter's Australian Brian Zimmerman2,4138.77+8.77
Greens Stephen Power1,5365.58-1.43
Family First Bibe Roadley1,2984.72+2.10
Independent Penny Toland7992.90+2.90
Total formal votes27,51097.00-0.25
Informal votes8503.00+0.25
Turnout 28,36089.54-0.65
Two-party-preferred result
Liberal National Alex Douglas 16,47169.10+18.38
Labor Michael Riordan7,36530.90-18.38
Liberal National hold Swing +18.38

Gladstone

Queensland state election, 2012: Gladstone
PartyCandidateVotes%±
Independent Liz Cunningham 14,02048.96-5.68
Labor Glenn Butcher 8,35929.19-13.45
Liberal National Russell Schroter3,10910.86+10.86
Katter's Australian Anthony Beezley2,5458.89+8.89
Greens Andrew Blake6022.10-0.62
Total formal votes28,63598.36-0.31
Informal votes4771.64+0.31
Turnout 29,11290.92-1.19
Two-party-preferred result
Independent Liz Cunningham 15,89064.03+7.90
Labor Glenn Butcher 8,92535.97-7.90
Independent hold Swing +7.90

Glass House

Queensland state election, 2012: Glass House
PartyCandidateVotes%±
Liberal National Andrew Powell 15,91055.85+7.23
Labor Ryan Moore5,03217.67-16.10
Greens Stewart Luke4,45515.64-1.97
Katter's Australian Peter Harris3,08810.84+10.84
Total formal votes28,48597.64-0.36
Informal votes6892.36+0.36
Turnout 29,17492.62+0.43
Two-party-preferred result
Liberal National Andrew Powell 17,57370.39+14.58
Labor Ryan Moore7,39129.61-14.58
Liberal National hold Swing +14.58

Greenslopes

Queensland state election, 2012: Greenslopes
PartyCandidateVotes%±
Liberal National Ian Kaye 13,07647.87+10.06
Labor Cameron Dick 10,71339.22-7.06
Greens Emma-Kate Rose3,52912.92+0.35
Total formal votes27,31898.39+0.01
Informal votes4481.61-0.01
Turnout 27,76692.01+0.56
Two-party-preferred result
Liberal National Ian Kaye 13,59052.45+9.39
Labor Cameron Dick 12,31847.55-9.39
Liberal National gain from Labor Swing +9.39

Gregory

Queensland state election, 2012: Gregory
PartyCandidateVotes%±
Liberal National Vaughan Johnson 13,39959.10-2.71
Labor Jack O'Brien3,97017.51-16.00
Katter's Australian Pauline Williams3,85517.00+17.00
Independent Bruce Currie8313.67+3.67
Greens Norman Weston6172.72-1.96
Total formal votes22,67298.42-0.25
Informal votes3641.58+0.25
Turnout 23,03689.86-1.90
Two-party-preferred result
Liberal National Vaughan Johnson 14,89575.48+11.22
Labor Jack O'Brien4,84024.52-11.22
Liberal National hold Swing +11.22

Gympie

Queensland state election, 2012: Gympie
PartyCandidateVotes%±
Liberal National David Gibson 15,05453.03-7.60
Katter's Australian Shane Paulger6,19821.83+21.83
Labor Ben Parker3,47512.24-2.41
Greens Shena MacDonald2,4108.49-1.90
Family First Kathy Hawke9173.23+3.23
One Nation Santo Ferraro3351.18+1.18
Total formal votes28,38997.84-0.02
Informal votes6272.16+0.02
Turnout 29,01692.53+0.47
Two-party-preferred result
Liberal National David Gibson 16,19467.26-9.95
Katter's Australian Shane Paulger7,88332.74+32.74
Liberal National hold Swing -9.95

Hervey Bay

Queensland state election, 2012: Hervey Bay
PartyCandidateVotes%±
Liberal National Ted Sorensen 17,66859.23+8.87
Labor Bernice Allen6,32521.20-17.45
Katter's Australian Isobel Dale3,68412.35+12.35
Family First Troy Sullivan1,1243.77+3.77
Greens Glenn Martin1,0293.45-1.02
Total formal votes29,83097.84-0.36
Informal votes6602.16+0.36
Turnout 30,49091.05-0.27
Two-party-preferred result
Liberal National Ted Sorensen 19,16071.72+15.22
Labor Bernice Allen7,55628.28-15.22
Liberal National hold Swing +15.22

Hinchinbrook

Queensland state election, 2012: Hinchinbrook
PartyCandidateVotes%±
Liberal National Andrew Cripps 11,95244.04-13.92
Katter's Australian Jeff Knuth 9,56435.24+35.24
Labor Tony McGuire4,49116.55-13.06
Greens Pamela Monaghan8673.19-2.42
Independent Desmond Connors2630.97+0.97
Total formal votes27,13798.51+0.73
Informal votes4101.49-0.73
Turnout 27,54792.17+0.63
Two-party-preferred result
Liberal National Andrew Cripps 12,65253.63-11.06
Katter's Australian Jeff Knuth 10,94046.37+46.37
Liberal National hold Swing -11.06

Inala

Queensland state election, 2012: Inala
PartyCandidateVotes%±
Labor Annastacia Palaszczuk 12,01646.22-17.73
Liberal National Joanna Lindgren 9,11535.06+11.34
Katter's Australian Ashley Dodd2,99311.51+11.51
Greens Michael Quall1,8747.21-0.82
Total formal votes25,99897.01-0.63
Informal votes8022.99+0.63
Turnout 26,80090.96-0.60
Two-party-preferred result
Labor Annastacia Palaszczuk 13,41056.90-14.63
Liberal National Joanna Lindgren 10,15943.10+14.63
Labor hold Swing -14.63

Indooroopilly

Queensland state election, 2012: Indooroopilly
PartyCandidateVotes%±
Liberal National Scott Emerson 15,22560.89+14.44
Labor Oscar Schlamowitz4,66918.67-7.87
Greens Charles Worringham4,62318.49-7.44
Family First Andrew Mooney4881.95+1.95
Total formal votes25,00598.62-0.34
Informal votes3511.38+0.34
Turnout 25,35689.89-0.72
Two-party-preferred result
Liberal National Scott Emerson 16,14069.55+13.68
Labor Oscar Schlamowitz7,06730.45-13.68
Liberal National hold Swing +13.68

Ipswich

Queensland state election, 2012: Ipswich
PartyCandidateVotes%±
Liberal National Ian Berry 10,02335.87+6.81
Labor Rachel Nolan 8,70331.14-29.02
Katter's Australian Will Keys4,04114.46+14.46
Independent Patricia Petersen 2,4708.84+8.84
Greens Veronica White1,5685.61-1.09
Family First Tim Stieler8803.15-0.93
Independent Robert Jeremy2590.93+0.93
Total formal votes27,94497.33-0.73
Informal votes7672.67+0.73
Turnout 28,71192.01-0.50
Two-party-preferred result
Liberal National Ian Berry 12,24354.19+20.90
Labor Rachel Nolan 10,35145.81-20.90
Liberal National gain from Labor Swing +20.90

Ipswich West

Queensland state election, 2012: Ipswich West
PartyCandidateVotes%±
Liberal National Sean Choat 12,42443.54+6.18
Labor Wayne Wendt 9,08331.83-22.16
Katter's Australian Justin Bowman5,22518.31+18.31
Greens Ursula Monsiegneur1,8046.32-2.33
Total formal votes28,53697.75-0.37
Informal votes6572.25+0.37
Turnout 29,19393.24+0.23
Two-party-preferred result
Liberal National Sean Choat 14,14657.16+16.71
Labor Wayne Wendt 10,60042.84-16.71
Liberal National gain from Labor Swing +16.71

Kallangur

Queensland state election, 2012: Kallangur
PartyCandidateVotes%±
Liberal National Trevor Ruthenberg 13,98352.05+12.63
Labor Mary-Anne O'Neill 7,75028.85-18.16
Katter's Australian Michael Bates3,00511.19+11.19
Greens Rachel Doherty2,1257.91-0.77
Total formal votes26,86397.53-0.14
Informal votes6812.47+0.14
Turnout 27,54492.24-0.01
Two-party-preferred result
Liberal National Trevor Ruthenberg 15,18762.43+17.06
Labor Mary-Anne O'Neill 9,13837.57-17.06
Liberal National gain from Labor Swing +17.06

Kawana

Queensland state election, 2012: Kawana
PartyCandidateVotes%±
Liberal National Jarrod Bleijie 19,13266.84+14.57
Labor Bruce Garner5,11417.87-19.87
Greens Gabrielle Roberts2,3848.33-1.66
Katter's Australian Paul Spencer1,9946.97+6.97
Total formal votes28,62497.82-0.05
Informal votes6372.18+0.05
Turnout 29,26190.62-0.83
Two-party-preferred result
Liberal National Jarrod Bleijie 20,11176.26+19.33
Labor Bruce Garner6,26123.74-19.33
Liberal National hold Swing +19.33

Keppel

Queensland state election, 2012: Keppel
PartyCandidateVotes%±
Liberal National Bruce Young 13,14344.25+4.86
Labor Paul Hoolihan 9,93533.45-19.13
Katter's Australian Luke Hargreaves4,72215.90+15.90
Greens Paul Bambrick1,9056.41-1.62
Total formal votes29.70597.95-0.20
Informal votes6222.05+0.20
Turnout 30,32792.69+0.26
Two-party-preferred result
Liberal National Bruce Young 14,75756.39+14.01
Labor Paul Hoolihan 11,41143.61-14.01
Liberal National gain from Labor Swing +14.01

Lockyer

Queensland state election, 2012: Lockyer
PartyCandidateVotes%±
Liberal National Ian Rickuss 14,34852.01-1.55
Katter's Australian David Neuendorf6,57123.82+23.82
Labor James Wilson4,87617.68-19.94
Greens Clare Rudkin1,7906.49-2.33
Total formal votes27,58597.66-0.07
Informal votes6612.34+0.07
Turnout 28,24693.66-0.77
Two-party-preferred result
Liberal National Ian Rickuss 15,38764.87+7.26
Katter's Australian David Neuendorf8,33435.13+35.13
Liberal National hold Swing +7.26

Logan

Queensland state election, 2012: Logan
PartyCandidateVotes%±
Liberal National Michael Pucci 10,38841.01+9.34
Labor Linus Power 8,43133.29-23.44
Katter's Australian Tony Karamatic3,19612.62+12.62
Independent Mike Kelly1,5596.16+6.16
Greens Julian Hinton1,3625.38-3.12
One Nation Troy Aggett3921.55+1.55
Total formal votes25,32896.63-0.31
Informal votes8823.37+0.31
Turnout 26,21091.28-0.14
Two-party-preferred result
Liberal National Michael Pucci 11,80154.80+18.73
Labor Linus Power 9,73245.20-18.73
Liberal National gain from Labor Swing +18.73

Lytton

Queensland state election, 2012: Lytton
PartyCandidateVotes%±
Liberal National Neil Symes 12,18143.66+11.43
Labor Daniel Cheverton10,96139.29-13.20
Greens Daniel Crute2,2568.09+0.96
Katter's Australian Jim Vote1,8816.74+6.74
Independent Russell McVey6182.22+2.22
Total formal votes27,89797.49-0.65
Informal votes7192.51+0.65
Turnout 28,61692.19-0.49
Two-party-preferred result
Liberal National Neil Symes 13,10151.58+13.79
Labor Daniel Cheverton12,29948.42-13.79
Liberal National gain from Labor Swing +13.79

Mackay

Queensland state election, 2012: Mackay
PartyCandidateVotes%±
Labor Tim Mulherin 9,92038.58-22.78
Liberal National John Kerslake9,49936.94+6.76
Katter's Australian Lindsay Temple4,87018.94+18.94
Greens Luke Mathews1,4255.54-2.92
Total formal votes25,71497.80+0.07
Informal votes5782.20-0.07
Turnout 26,29289.75-1.07
Two-party-preferred result
Labor Tim Mulherin 11,31750.53-16.19
Liberal National John Kerslake11,08149.47+16.19
Labor hold Swing -16.19

Mansfield

Queensland state election, 2012: Mansfield
PartyCandidateVotes%±
Liberal National Ian Walker 13,95353.67+14.05
Labor Phil Reeves 8,41632.37-14.91
Greens Craig Sheehan1,5926.12-0.65
Katter's Australian Ray Smith1,1354.37+4.37
Family First Carolyn Ferrando6962.68-0.78
Independent Jarrod J Wirth2060.79+0.79
Total formal votes25,99898.28-0.03
Informal votes4541.72+0.03
Turnout 26,45291.94-0.47
Two-party-preferred result
Liberal National Ian Walker 14,88661.14+15.53
Labor Phil Reeves 9,46238.86-15.53
Liberal National gain from Labor Swing +15.53

Maroochydore

Queensland state election, 2012: Maroochydore
PartyCandidateVotes%±
Liberal National Fiona Simpson 16,33958.16+1.88
Labor Ray Barber 5,66020.15-10.83
Greens Rainee Skinner3,65213.00+0.26
Katter's Australian Mark Maguire2,4408.69+8.69
Total formal votes28,09197.83-0.31
Informal votes6222.17+0.31
Turnout 28,71388.22+0.41
Two-party-preferred result
Liberal National Fiona Simpson 17,73870.93+8.13
Labor Ray Barber 7,26929.07-8.13
Liberal National hold Swing +8.13

Maryborough

Queensland state election, 2012: Maryborough
PartyCandidateVotes%±
Liberal National Anne Maddern 10,74535.74+9.97
Independent Chris Foley 9,07130.17-17.50
Katter's Australian Gordon Dale5,87919.56+19.56
Labor Ezra Burtt3,53811.77-11.00
Greens Garry Claridge8302.76-1.02
Total formal votes30,06397.96-0.09
Informal votes6262.04+0.09
Turnout 30,68992.53-0.48
Two-party-preferred result
Liberal National Anne Maddern 12,22850.31+17.14
Independent Chris Foley 12,07649.69-17.14
Liberal National gain from Independent Swing +17.14

Mermaid Beach

Queensland state election, 2012: Mermaid Beach
PartyCandidateVotes%±
Liberal National Ray Stevens 17,85665.13+10.69
Labor Rachel Paterson5,06418.47-15.02
Greens Jenny Boddy2,0437.45+0.76
Katter's Australian Ken Law1,6646.07+6.07
Family First Ben Donovan7882.87+2.87
Total formal votes27,41597.67-0.17
Informal votes6532.33+0.17
Turnout 28,06887.97-0.09
Two-party-preferred result
Liberal National Ray Stevens 18,76476.05+15.24
Labor Rachel Paterson5,91023.95-15.24
Liberal National hold Swing +15.24

Mirani

Queensland state election, 2012: Mirani
PartyCandidateVotes%±
Liberal National Ted Malone 13,59946.65-1.30
Labor Jim Pearce 8,36928.71-17.82
Katter's Australian Bevan Pidgeon5,58519.16+19.16
Greens Christine Carlisle9753.34-2.17
Family First Mike Crouther6262.15+2.15
Total formal votes29,15498.25-0.06
Informal votes5201.75+0.06
Turnout 29,67492.37-0.42
Two-party-preferred result
Liberal National Ted Malone 15,34561.19+10.60
Labor Jim Pearce 9,73338.81-10.60
Liberal National hold Swing +10.60

Moggill

Queensland state election, 2012: Moggill
PartyCandidateVotes%±
Liberal National Bruce Flegg 18,34863.27+14.09
Labor Michael Nelson4,54015.65-8.96
Greens Jake Schoermer4,00113.80-0.15
Katter's Australian Barry Searle2,1127.28+7.28
Total formal votes29,00198.52-0.33
Informal votes4351.48+0.33
Turnout 29,43692.84+0.16
Two-party-preferred result
Liberal National Bruce Flegg 19,70373.91+12.63
Labor Michael Nelson6,95626.09-12.63
Liberal National hold Swing +12.63

Morayfield

Queensland state election, 2012: Morayfield
PartyCandidateVotes%±
Liberal National Darren Grimwade 12,77947.02+13.95
Labor Mark Ryan 9,98836.75-11.69
Katter's Australian Stephen Beck2,88010.60+10.60
Greens Paul Doherty1,5325.64-1.68
Total formal votes27,17997.37-0.07
Informal votes7342.63+0.07
Turnout 27,91392.17+0.01
Two-party-preferred result
Liberal National Darren Grimwade 13,81855.57+14.70
Labor Mark Ryan 11,04644.43-14.70
Liberal National gain from Labor Swing +14.70

Mount Coot-tha

Queensland state election, 2012: Mount Coot-tha
PartyCandidateVotes%±
Liberal National Saxon Rice 12,14247.74+11.48
Labor Andrew Fraser 7,28528.64-9.24
Greens Adam Stone5,26920.72-2.36
Katter's Australian Margaret Waterman7392.91+2.91
Total formal votes25,43598.77-0.01
Informal votes3171.23+0.01
Turnout 25,75289.53+1.76
Two-party-preferred result
Liberal National Saxon Rice 13,06755.36+10.61
Labor Andrew Fraser 10,53844.64-10.61
Liberal National gain from Labor Swing +10.61

Mount Isa

Queensland state election, 2012: Mount Isa
PartyCandidateVotes%±
Katter's Australian Rob Katter 6,65841.61+41.61
Liberal National Mick Pattel4,73129.57+0.08
Labor Betty Kiernan 4,26426.65-17.80
Greens Colleen Williams3482.17-0.34
Total formal votes16,00198.36+0.03
Informal votes2671.64-0.03
Turnout 16,26885.42-0.34
Two-party-preferred result
Katter's Australian Rob Katter 7,99660.04+60.04
Liberal National Mick Pattel5,32239.96-4.32
Katter's Australian gain from Labor Swing +60.04

Mount Ommaney

Queensland state election, 2012: Mount Ommaney
PartyCandidateVotes%±
Liberal National Tarnya Smith 15,78157.30+16.98
Labor Ben Marczyk7,08625.73-21.51
Greens Jenny Mulkearns2,6949.78-0.20
Katter's Australian Douglas Newson1,1694.24+4.24
Family First Jordan Brown4521.64+1.64
Independent Rex Schmith3601.31+1.31
Total formal votes27,54297.97-0.55
Informal votes5702.03+0.55
Turnout 28,11292.88+0.78
Two-party-preferred result
Liberal National Tarnya Smith 16,77366.48+21.27
Labor Ben Marczyk8,45733.52-21.27
Liberal National gain from Labor Swing +21.27

Mudgeeraba

Queensland state election, 2012: Mudgeeraba
PartyCandidateVotes%±
Liberal National Ros Bates 16,53461.69+15.47
Labor Aaron Santelises4,75317.73-21.10
Katter's Australian Kevin Swan2,0567.67+7.67
Greens Sally Spain2,0567.67+0.63
Family First Barrie Nicholson1,4025.23+1.41
Total formal votes26,80197.72-0.04
Informal votes6262.28+0.04
Turnout 27,42789.61-0.77
Two-party-preferred result
Liberal National Ros Bates 17,70775.93+22.01
Labor Aaron Santelises5,61224.07-22.01
Liberal National hold Swing +22.01

Mulgrave

Queensland state election, 2012: Mulgrave
PartyCandidateVotes%±
Labor Curtis Pitt 8,73934.50-13.51
Liberal National Robyn Quick8,10532.00-1.44
Katter's Australian Damian Byrnes7,58529.95+29.95
Greens Jim Cavill8993.55-2.06
Total formal votes25,32898.13+0.50
Informal votes4821.87-0.50
Turnout 25,81090.36+0.06
Two-party-preferred result
Labor Curtis Pitt 10,51451.15-6.93
Liberal National Robyn Quick10,04348.85-6.93
Labor hold Swing -6.93

Mundingburra

Queensland state election, 2012: Mundingburra
PartyCandidateVotes%±
Liberal National David Crisafulli 11,06943.34+5.54
Labor Mark Harrison6,56925.72-22.68
Katter's Australian David Moyle5,87523.00+23.00
Greens Bret Fishley1,2835.02-3.64
Family First Michael Waters7452.92-0.63
Total formal votes25,54197.65+0.09
Informal votes6142.35-0.09
Turnout 26,15589.89+0.84
Two-party-preferred result
Liberal National David Crisafulli 12,92460.19+16.78
Labor Mark Harrison8,54739.81-16.78
Liberal National gain from Labor Swing +16.78

Murrumba

Queensland state election, 2012: Murrumba
PartyCandidateVotes%±
Liberal National Reg Gulley 14,04049.11+12.04
Labor Dean Wells 9,26732.42-18.38
Katter's Australian Paul Edwards2,2637.92+7.92
Family First Sally Vincent1,6225.67+1.07
Greens Rodney Blair1,3944.88-2.65
Total formal votes28,58697.71-0.02
Informal votes6712.29+0.02
Turnout 29,25791.89+0.34
Two-party-preferred result
Liberal National Reg Gulley 15,46559.52+16.73
Labor Dean Wells 10,51640.48-16.73
Liberal National gain from Labor Swing +16.73

Nanango

Queensland state election, 2012: Nanango
PartyCandidateVotes%±
Liberal National Deb Frecklington 13,49345.44+4.81
Katter's Australian Carl Rackemann 7,81826.33+26.33
Independent John Dalton3,80412.81+12.81
Labor Virginia Clarke3,13410.55-4.80
Greens Grant Newson1,0903.67-0.25
Independent David Thomson3571.20+1.20
Total formal votes29,69698.10-0.48
Informal votes5751.90+0.48
Turnout 30,27192.48-0.11
Two-party-preferred result
Liberal National Deb Frecklington 14,70558.98+11.88
Katter's Australian Carl Rackemann 10,22941.02+41.02
Liberal National gain from Independent Swing +11.88

Nicklin

Queensland state election, 2012: Nicklin
PartyCandidateVotes%±
Independent Peter Wellington 10,72539.14-10.77
Liberal National John Connolly 9,82935.87+7.59
Labor Luke Moore2,1547.86-7.89
Katter's Australian Matthew Smith2,0757.57+7.57
Greens John Law1,9377.07+0.51
Family First Cathy Turner6842.50+2.50
Total formal votes27,40498.28-0.22
Informal votes4811.72+0.22
Turnout 27,88590.85-0.07
Two-party-preferred result
Independent Peter Wellington 13,18654.88-11.43
Liberal National John Connolly 10,84145.12+11.43
Independent hold Swing -11.43

Noosa

Queensland state election, 2012: Noosa
PartyCandidateVotes%±
Liberal National Glen Elmes 17,12160.59+4.45
Greens Jim McDonald4,38215.51+2.25
Labor Kurt Hopkins3,51412.44-8.13
Katter's Australian Bob Jarvis2,5489.02+9.02
Family First Gemika Maloney3761.33-0.57
Independent Bill Colley3161.12+1.12
Total formal votes28,25797.99-0.43
Informal votes5802.01+0.43
Turnout 28,83789.50-0.26
Two-party-preferred result
Liberal National Glen Elmes 18,11675.46+5.61
Greens Jim McDonald5,89324.54+24.54
Liberal National hold Swing +5.61

Nudgee

Queensland state election, 2012: Nudgee
PartyCandidateVotes%±
Liberal National Jason Woodforth 12,86244.49+13.55
Labor Leanne Linard 10,83737.49-18.48
Greens Anthony Pink2,3378.08-0.71
Katter's Australian Terri Bell1,9536.76+6.76
Family First Claude Gonsalves5711.98-0.46
Independent Douglas Crowhurst3491.21-0.65
Total formal votes28,90997.81-0.42
Informal votes6472.19+0.42
Turnout 29,55692.10+0.45
Two-party-preferred result
Liberal National Jason Woodforth 13,93253.11+17.37
Labor Leanne Linard 12,30046.89-17.37
Liberal National gain from Labor Swing +17.37

Pine Rivers

Queensland state election, 2012: Pine Rivers
PartyCandidateVotes%±
Liberal National Seath Holswich 14,59052.93+13.41
Labor Patrick Bulman7,55627.41-19.95
Katter's Australian John Alexander3,09111.21+11.21
Greens Di Clark2,3268.44-0.21
Total formal votes27,56397.38-0.48
Informal votes7412.62+0.48
Turnout 28,30493.18+0.29
Two-party-preferred result
Liberal National Seath Holswich 15,85663.66+18.27
Labor Patrick Bulman9,05236.34-18.27
Liberal National gain from Labor Swing +18.27

Pumicestone

Queensland state election, 2012: Pumicestone
PartyCandidateVotes%±
Liberal National Lisa France 16,34053.15+13.05
Labor Carryn Sullivan 9,35530.43-17.49
Katter's Australian Brandt King3,18610.36+10.36
Greens Jenny Fitzgibbon1,8606.05-2.21
Total formal votes30,74197.70-0.12
Informal votes7252.30+0.12
Turnout 31,46691.59-0.08
Two-party-preferred result
Liberal National Lisa France 17,52162.07+17.06
Labor Carryn Sullivan 10,70537.93-17.06
Liberal National gain from Labor Swing +17.06

Redcliffe

Queensland state election, 2012: Redcliffe
PartyCandidateVotes%±
Liberal National Scott Driscoll 13,99149.24+14.94
Labor Lillian van Litsenburg 8,73930.76-12.26
Katter's Australian Bevan Collingwood2,4848.74+8.74
Greens Noel Clothier1,9126.73+0.61
Family First Kerri Dooley1,2884.53+1.91
Total formal votes28,41497.61-0.42
Informal votes6952.39+0.42
Turnout 29,10991.11+0.21
Two-party-preferred result
Liberal National Scott Driscoll 15,42760.10+15.67
Labor Lillian van Litsenburg 10,24239.90-15.67
Liberal National gain from Labor Swing +15.67

Redlands

Queensland state election, 2012: Redlands
PartyCandidateVotes%±
Liberal National Peter Dowling 17,84965.80+21.08
Labor Peter Seage6,52424.05-18.97
Greens David Keogh2,75310.15+4.91
Total formal votes27,12697.57-0.41
Informal votes6752.43+0.41
Turnout 27,80192.16+0.08
Two-party-preferred result
Liberal National Peter Dowling 18,38171.10+21.03
Labor Peter Seage7,47128.90-21.03
Liberal National hold Swing +21.03

Rockhampton

Queensland state election, 2012: Rockhampton
PartyCandidateVotes%±
Labor Bill Byrne 11,00239.79-21.78
Liberal National Gavin Finch8,78131.76+4.54
Katter's Australian Shane Guley3,50712.68+12.68
Independent Bruce Diamond1,8476.68+6.68
Greens Bronwen Lloyd9543.45-0.62
Family First Genevieve Ellis7342.65+2.65
Independent Diane Hamilton5411.96+1.96
Independent Chris Hooper2861.03+1.03
Total formal votes27,65297.02-1.06
Informal votes8502.98+1.06
Turnout 28,50291.73-0.11
Two-party-preferred result
Labor Bill Byrne 12,19153.95-13.97
Liberal National Gavin Finch10,40646.05+13.97
Labor hold Swing -13.97

Sandgate

Queensland state election, 2012: Sandgate
PartyCandidateVotes%±
Liberal National Kerry Millard 12,09643.75+11.41
Labor Vicky Darling 10,40837.64-16.41
Greens Claire Ogden2,4838.98+0.78
Katter's Australian John Dunkley1,4585.27+5.27
Family First Penny McCreery7512.72+0.53
Independent Mike Crook4541.64+0.31
Total formal votes27,65097.76-0.38
Informal votes6332.24+0.38
Turnout 28,28393.06+0.18
Two-party-preferred result
Liberal National Kerry Millard 13,22852.87+15.24
Labor Vicky Darling 11,79447.13-15.24
Liberal National gain from Labor Swing +15.24

South Brisbane

Queensland state election, 2012: South Brisbane
PartyCandidateVotes%±
Labor Anna Bligh 10,01538.57-9.85
Liberal National Clem Grehan9,88738.07+10.16
Greens Jo-Anne Bragg4,69218.07+0.66
Katter's Australian Robert Wardrop8833.40+3.40
Independent Liam Flenady4911.89+1.89
Total formal votes25,96897.94-0.25
Informal votes5472.06+0.25
Turnout 26,51587.11+0.67
Two-party-preferred result
Labor Anna Bligh 12,97754.66-10.35
Liberal National Clem Grehan10,76345.34+10.35
Labor hold Swing -10.35

Southern Downs

Queensland state election, 2012: Southern Downs
PartyCandidateVotes%±
Liberal National Lawrence Springborg 19,77166.62-1.65
Katter's Australian Ade Larsen4,11213.86+13.86
Labor Suzanne Kidman3,97913.41-12.45
Greens Michael Kane1,1633.92-1.95
Family First John Spellman6522.20+2.20
Total formal votes29,67798.27-0.33
Informal votes5221.73+0.33
Turnout 30,19992.33-0.75
Two-party-preferred result
Liberal National Lawrence Springborg 20,71379.77+8.69
Katter's Australian Ade Larsen5,25320.23+20.23
Liberal National hold Swing +8.69

Southport

Queensland state election, 2012: Southport
PartyCandidateVotes%±
Liberal National Rob Molhoek 14,89055.84+15.44
Labor Peter Lawlor 7,58028.43-16.90
Katter's Australian Kevin Brown1,9877.45+7.45
Greens Stephen Dalton1,7846.69-0.64
Independent Matthew Mackechnie4251.59+1.59
Total formal votes26,66697.08-0.38
Informal votes8032.92+0.38
Turnout 27,46987.59-0.30
Two-party-preferred result
Liberal National Rob Molhoek 15,64564.72+18.20
Labor Peter Lawlor 8,52935.28-18.20
Liberal National gain from Labor Swing +18.20

Springwood

Queensland state election, 2012: Springwood
PartyCandidateVotes%±
Liberal National John Grant 15,93955.67+15.46
Labor Barbara Stone 8,01628.00-18.95
Katter's Australian Julian Tocaciu1,9236.72+6.72
Greens Neil Cotter1,9106.67-0.57
Family First Chris Lawrie8452.95+2.95
Total formal votes28,63397.86-0.08
Informal votes6252.14+0.08
Turnout 29,25891.35-0.50
Two-party-preferred result
Liberal National John Grant 17,25665.39+19.47
Labor Barbara Stone 9,13234.61-19.47
Liberal National gain from Labor Swing +19.47

Stafford

Queensland state election, 2012: Stafford
PartyCandidateVotes%±
Liberal National Chris Davis 13,42350.23+12.35
Labor Stirling Hinchliffe 8,97233.58-14.87
Greens Peter Jeremijenko3,02011.30-0.49
Katter's Australian Karin Hunter1,3074.89+4.89
Total formal votes26,72298.10-0.11
Informal votes5171.90+0.11
Turnout 27,23991.36+0.02
Two-party-preferred result
Liberal National Chris Davis 14,30257.06+14.35
Labor Stirling Hinchliffe 10,76342.94-14.35
Liberal National gain from Labor Swing +14.35

Stretton

Queensland state election, 2012: Stretton
PartyCandidateVotes%±
Liberal National Freya Ostapovitch 13,00046.85+9.75
Labor Duncan Pegg 7,96828.72-24.86
Independent David Forde5,25918.95+18.95
Greens Brian Sadler1,5215.48-3.84
Total formal votes27,74897.57-0.57
Informal votes6902.43+2.43
Turnout 28,43890.16-0.62
Two-party-preferred result
Liberal National Freya Ostapovitch 14,23959.55+19.03
Labor Duncan Pegg 9,67040.45-19.03
Liberal National gain from Labor Swing +19.03

Sunnybank

Queensland state election, 2012: Sunnybank
PartyCandidateVotes%±
Liberal National Mark Stewart 13,57852.70+17.27
Labor Meg Bishop8,43432.73-21.77
Greens Gordon King2,4639.56+1.61
Family First Matt Darragh1,2915.01+5.01
Total formal votes25,76697.21-0.43
Informal votes7392.79+0.43
Turnout 26,50588.94-1.06
Two-party-preferred result
Liberal National Mark Stewart 14,44160.23+21.02
Labor Meg Bishop9,53539.77-21.02
Liberal National gain from Labor Swing +21.02

Surfers Paradise

Queensland state election, 2012: Surfers Paradise
PartyCandidateVotes%±
Liberal National John-Paul Langbroek 18,99372.63+13.61
Labor Matthew Donovan4,32516.54-10.93
Greens Helen Wainwright1,8617.12+0.58
Family First Andrea Raymond9713.71+3.71
Total formal votes26,15097.76-0.11
Informal votes6002.24+0.11
Turnout 26,75086.70+0.90
Two-party-preferred result
Liberal National John-Paul Langbroek 19,68879.50+12.98
Labor Matthew Donovan5,07820.50-12.98
Liberal National hold Swing +12.98

Thuringowa

Queensland state election, 2012: Thuringowa
PartyCandidateVotes%±
Liberal National Sam Cox 9,83736.14+2.28
Katter's Australian Steve Todeschini8,20130.13+30.13
Labor Craig Wallace 7,44827.36-21.78
Greens Bernie Williams9863.62-0.64
Family First Adrian Britton7492.75+2.75
Total formal votes27,22197.30+0.30
Informal votes7542.70-0.30
Turnout 27,97589.78-0.08
Two-party-preferred result
Liberal National Sam Cox 10,85751.38+9.85
Katter's Australian Steve Todeschini10,27448.62+48.62
Liberal National gain from Labor Swing N/A

Toowoomba North

Queensland state election, 2012: Toowoomba North
PartyCandidateVotes%±
Liberal National Trevor Watts 14,89849.75+7.62
Labor Kerry Shine 9,66732.28-15.42
Katter's Australian Peter Pyke 3,48511.64+11.64
Greens Frida Forsberg1,4614.88-0.31
Independent Neil Riethmuller4331.45+0.41
Total formal votes29,94498.15-0.02
Informal votes5631.85+0.02
Turnout 30,50792.36+0.67
Two-party-preferred result
Liberal National Trevor Watts 16,12659.58+12.80
Labor Kerry Shine 10,94240.42-12.80
Liberal National gain from Labor Swing +12.80

Toowoomba South

Queensland state election, 2012: Toowoomba South
PartyCandidateVotes%±
Liberal National John McVeigh 17,28358.53+5.04
Labor Sam McFarlane6,20821.03-16.40
Katter's Australian David Curless3,52011.92+11.92
Greens Trevor Smith1,6195.48+0.86
Independent Charlene Phillips8963.03+3.03
Total formal votes29,52697.95-0.31
Informal votes6192.05+0.31
Turnout 30,14591.94+0.06
Two-party-preferred result
Liberal National John McVeigh 18,79471.62+13.40
Labor Sam McFarlane7,44828.38-13.40
Liberal National hold Swing +13.40

Townsville

Queensland state election, 2012: Townsville
PartyCandidateVotes%±
Liberal National John Hathaway 10,01138.63-0.69
Labor Mandy Johnstone 7,58529.27-15.10
Katter's Australian Ray Grigg5,65421.82+21.82
Greens Jenny Stirling1,9887.67-2.84
Family First Michael Punshon6742.60+0.22
Total formal votes25,91297.76+0.20
Informal votes5952.24-0.20
Turnout 26,50787.50+0.71
Two-party-preferred result
Liberal National John Hathaway 11,93754.83+9.66
Labor Mandy Johnstone 9,83545.17-9.66
Liberal National gain from Labor Swing +9.66

Warrego

Queensland state election, 2012: Warrego
PartyCandidateVotes%±
Liberal National Howard Hobbs 13,77058.13-1.63
Katter's Australian Robert Earixson3,33014.06+14.06
Independent Mark O'Brien3,12413.19+13.19
Labor David Bowden2,99512.64-6.31
Greens Graeme Maizey4701.98+0.20
Total formal votes23,68998.40-0.16
Informal votes3851.60+0.16
Turnout 24,07491.77+0.88
Two-party-preferred result
Liberal National Howard Hobbs 15,10775.06+0.72
Independent Mark O'Brien5,01924.94+24.94
Liberal National hold Swing +0.72

Waterford

Queensland state election, 2012: Waterford
PartyCandidateVotes%±
Liberal National Mike Latter 11,22839.62+9.98
Labor Evan Moorhead 10,94738.63-20.56
Katter's Australian Albert Page2,5879.13+9.13
Greens Ray Smith1,9867.01-1.30
Family First Peter Farrar1,2014.24+4.24
Independent David Howse3921.38-1.48
Total formal votes28,34196.59-0.17
Informal votes1,0023.41+0.17
Turnout 29,34389.31+0.18
Two-party-preferred result
Liberal National Mike Latter 12,65351.04+17.50
Labor Evan Moorhead 12,13548.96-17.50
Liberal National gain from Labor Swing +17.50

Whitsunday

Queensland state election, 2012: Whitsunday
PartyCandidateVotes%±
Liberal National Jason Costigan 12,78544.38-0.07
Labor Jan Jarratt 7,90127.43-22.28
Katter's Australian Amanda Camm6,42422.30+22.30
Greens Jonathon Dykyj1,6955.88+0.03
Total formal votes28,80598.32+0.10
Informal votes4921.68-0.10
Turnout 29,29790.39-0.48
Two-party-preferred result
Liberal National Jason Costigan 14,77860.67+13.91
Labor Jan Jarratt 9,57839.33-13.91
Liberal National gain from Labor Swing +13.91

Woodridge

Queensland state election, 2012: Woodridge
PartyCandidateVotes%±
Labor Desley Scott 11,73046.75-22.09
Liberal National Simon Dorries9,01235.92+14.35
Family First Justin Geange2,1998.76+8.76
Greens John Reddington2,1508.57-1.01
Total formal votes25,09195.89-1.15
Informal votes1,0754.11+1.15
Turnout 26,16688.04-0.04
Two-party-preferred result
Labor Desley Scott 12,78755.80-19.57
Liberal National Simon Dorries10,13044.20+19.57
Labor hold Swing -19.57

Yeerongpilly

Queensland state election, 2012: Yeerongpilly
PartyCandidateVotes%±
Liberal National Carl Judge 12,35643.22+8.04
Labor Simon Finn 9,87534.54-11.74
Greens Libby Connors4,56315.96+0.00
Katter's Australian Kathleen Hewlett1,3124.59+4.59
Family First Alexandra Todd4801.68+1.68
Total formal votes28,58698.28-0.09
Informal votes4991.72+0.09
Turnout 29,08591.96+0.87
Two-party-preferred result
Liberal National Carl Judge 13,51651.44+10.17
Labor Simon Finn 12,76048.56-10.17
Liberal National gain from Labor Swing +10.17

See also

Related Research Articles

Campbell Newman Australian politician

Campbell Kevin Thomas Newman is a former Australian politician who served as the 38th Premier of Queensland from 26 March 2012 to 14 February 2015. Newman served as the Member for Ashgrove in the Legislative Assembly of Queensland between March 2012 and 31 January 2015. He was the Leader of the Liberal National Party (LNP) from 2 April 2011 to 7 February 2015, and was the 15th Lord Mayor of Brisbane from 27 March 2004 to 3 April 2011.

Shire of Paroo Local government area in Queensland, Australia

The Shire of Paroo is a local government area in South West Queensland, Australia. The administrative centre is the town of Cunnamulla. The Paroo Shire covers an area of 47,714.5 square kilometres (18,422.7 sq mi). At the 2006 census, 1,217 of Paroo's 1,928 residents lived in Cunnamulla.

Anna Bligh Australian politician

Anna Maria Bligh is a former Australian politician who served as the 37th Premier of Queensland, in office from 2007 to 2012 as leader of the Labor Party. She was the first woman to hold either position.

Queensland Greens

The Queensland Greens is a Green party in the Australian state of Queensland, and a member of the federation of the Australian Greens. The Greens were first founded in Queensland as the Brisbane Green Party in late 1984 about a month after the Sydney Greens. The Brisbane Green Party contested the March 1985 Brisbane City Council elections with four ward candidates and Drew Hutton as mayoral candidate. Hutton received 4 per cent across the city and the ward candidates received approximately 7-10 per cent. Some time after the collapse of the Brisbane Greens, a Green Independent campaign stood a further range of candidates in the Queensland state election, 1989.

Annastacia Palaszczuk Australian politician

Annastacia Palaszczuk is an Australian politician and 39th Premier of Queensland, serving since the 2015 election. She has been a Labor member of the Legislative Assembly of Queensland since the 2006 election, representing the electorate of Inala. She held various ministerial portfolios in the Bligh Labor government from 2009. Following Labor's defeat in the 2012 election, Palaszczuk succeeded Bligh as leader of Queensland Labor. After the defeat of the Newman LNP government in 2015, Palaszczuk became the first woman in Australia to become Premier of a state from Opposition. Her first ministry was majority female, a first in Australia.

Shire of Murweh Local government area in Queensland, Australia

The Shire of Murweh is a local government area in the Maranoa district, which is part of South West Queensland, Australia. The administrative centre and largest town in the shire is Charleville. In the 2016 census, the Shire of Murweh had a population of 4,307 people.

Shire of Diamantina Local government area in Queensland, Australia

The Shire of Diamantina is a local government area in Central West Queensland, bordering South Australia and the Northern Territory. Its administrative centre is in the town of Bedourie.
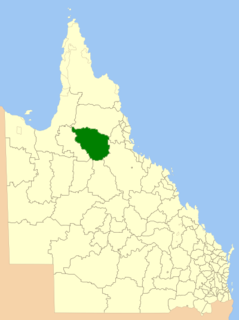
Shire of Etheridge Local government area in Queensland, Australia

The Shire of Etheridge is a local government area in Far North Queensland, Australia in what is known as the Savannah Gulf region. Its economy is based on cattle grazing and mining.

Shire of Croydon Local government area in Queensland, Australia

The Shire of Croydon is a local government area in western Queensland, Australia. The shire, administered from the town of Croydon, covers an area of 29,577.8 square kilometres (11,420.1 sq mi). The council consists of a mayor plus four councillors, each of whom represents the entire Shire.

Shire of Mornington (Queensland) Local government area in Queensland, Australia

Mornington Shire is a local government area in north-west Queensland, Australia. The Shire covers Mornington Island and neighbouring islands in the Wellesley Islands group in the Gulf of Carpentaria. The Shire Council employees are 93% local indigenous residents.

City of Ipswich Local government area in Queensland, Australia

The City of Ipswich is a local government area in Queensland, Australia, located in the southwest of the Brisbane metropolitan area, including the urban area surrounding the city of Ipswich and surrounding rural areas.

Maranoa Region Local government area in Queensland, Australia

Maranoa Region is a local government area in South West Queensland, Australia. Roma is the administrative headquarter of the region.

Cassowary Coast Region Local government area in Queensland, Australia

The Cassowary Coast Region is a local government area in the Far North Queensland region of Queensland, Australia, south of Cairns and centred on the towns of Innisfail, Cardwell and Tully. It was created in 2008 from a merger of the Shire of Cardwell and the Shire of Johnstone.

2009 Queensland state election

The Queensland state election was held to elect members to the unicameral Parliament of Queensland on 21 March 2009. The election saw the incumbent Labor government led by Premier Anna Bligh defeat the Liberal National Party of Queensland led by Opposition Leader Lawrence Springborg, and gain a fifth consecutive term in office for her party. Bligh thus became the first female Premier of any Australian State elected in her own right.

2012 Queensland state election

The 2012 Queensland state election was held on 24 March 2012 to elect all 89 members of the Legislative Assembly, a unicameral parliament.

Andrew Cary Powell is an Australian politician. He was first elected for the seat of Glass House to the Queensland Parliament for the Liberal National Party of Queensland at the 2009 Queensland election.

2015 Queensland state election

The 2015 Queensland state election was held on 31 January 2015 to elect all 89 members of the unicameral Legislative Assembly of Queensland.

This is a list of electoral results for the electoral district of Chatsworth in Queensland state elections.

This is a list of electoral results for the electoral district of Gaven in Queensland state elections.

This is a list of electoral results for the electoral district of Mansfield in Queensland state elections.

References