
The 2006 Pacific typhoon season was a destructive and deadly season, although it was near-average in terms of activity with a total of 23 named storms, 15 typhoons, and six super typhoons. Compared to the previous season, more typhoons inflicted damage across several countries, particularly China and the Philippines, some of which made landfall at higher intensities. The ratio of intense typhoons to all typhoons is at 0.73, the highest since 1970.

The 2007 Pacific typhoon season was a near average season which featured 24 named storms, fourteen typhoons, and five super typhoons. It was an event in the annual cycle of tropical cyclone formation, in which tropical cyclones form in the western Pacific Ocean. The season ran throughout 2007, though most tropical cyclones typically develop between May and November. The season's first named storm, Kong-rey, developed on March 30, while the season's last named storm, Mitag, dissipated on November 27. The season's first typhoon, Yutu, reached typhoon status on May 18, and became the first super typhoon of the year on the next day.

The 2001 Pacific typhoon season was an average season with twenty-six named storms, sixteen typhoons and three super typhoons, with a near normal Accumulated Cyclone Energy (ACE) of 307.3 units. It ran year-round in 2001, with most tropical cyclones in the northwestern Pacific Ocean tending between May and November.

The 2008 Pacific typhoon season was a below average season which featured 22 named storms, eleven typhoons, and two super typhoons. The season had no official bounds; it ran year-round in 2008, but most tropical cyclones tend to form in the northwestern Pacific Ocean between May and November. These dates conventionally delimit the period of each year when most tropical cyclones form in the northwestern Pacific Ocean.

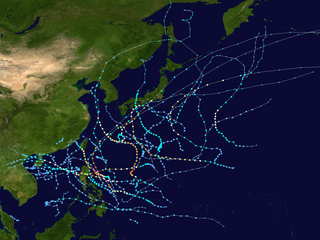
The 2012 Pacific typhoon season was a slightly above average season that produced 25 named storms, fourteen typhoons, and four intense typhoons. It was a destructive and the second consecutive year to be the deadliest season, primarily due to Typhoon Bopha which killed 1,901 people in the Philippines. It was an event in the annual cycle of tropical cyclone formation, in which tropical cyclones form in the western Pacific Ocean. The season ran throughout 2012, though most tropical cyclones typically develop between May and October. The season's first named storm, Pakhar, developed on March 28, while the season's last named storm, Wukong, dissipated on December 29. The season's first typhoon, Guchol, reached typhoon status on June 15, and became the first super typhoon of the year on June 17.
The 2009 Pacific typhoon season was a below average season that spawned only 22 named storms, 13 typhoons, and five super typhoons. Despite this, it was a very deadly season, with the Philippines having experienced its deadliest season in decades due to the impact of typhoons Ketsana and Parma, while typhoon Morakot went on to become the deadliest storm to impact Taiwan in its modern history. The first half of the season was very quiet, whereas the second half of the season was extremely active. The season's first named storm, Kujira, developed on May 3, while the season's last named storm, Nida, dissipated on December 3.
The 2010 Pacific typhoon season, with 14 named storms, was the least active Pacific typhoon season on record. Seven of them strengthened into typhoons while one reached super typhoon intensity. All of the 14 named storms developed west of 150°E.
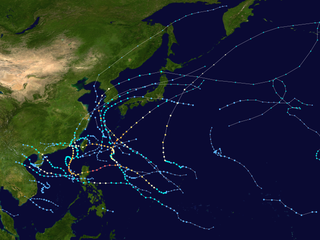
The 2011 Pacific typhoon season was a below average season that produced a total of 21 named storms, 8 typhoons, and four super typhoons. This season was much more active than the previous season, although both seasons were below the Pacific typhoon average of 26. The season ran throughout 2011, though most tropical cyclone tend to develop between May and October. The season's first named storm, Aere, developed on May 7 while the season's last named storm, Washi dissipated on December 19.

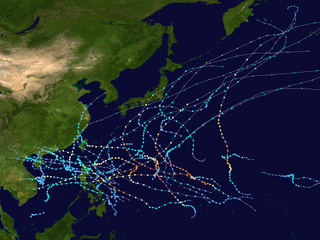
The 2013 Pacific typhoon season was a devastating and catastrophic season that was the most active since 2004, and the deadliest since 1975. It featured Typhoon Haiyan, one of the most powerful storms in history, as well as one of the strongest to make landfall on record. It featured 31 named storms, 13 typhoons, and five super typhoons. The season's first named storm, Sonamu, developed on January 4 while the season's last named storm, Podul, dissipated on November 15. Collectively, the storms caused 6,829 fatalities, while total damage amounted to at least $26.41 billion (USD), making it, at the time, the costliest Pacific typhoon season on record, until it was surpassed five years later. As of 2024, it is currently ranked as the fifth-costliest typhoon season.

The 2014 Pacific typhoon season was a slightly below average season in terms of named storms, but featured the highest amount of Category 5 typhoons since 1997. This was mainly due to a developing El Niño that favors multiple powerful storms to form in the basin. The season formed twenty-three tropical storms, eleven typhoons, eight super typhoons, and seven Category 5 typhoons. The season's peak months August and September saw minimal activity caused by an unusually strong and a persistent suppressing phase of the Madden–Julian oscillation (MJO). The season ran throughout 2014, though most tropical cyclones typically develop between May and October. The season began with the development of Tropical Storm Lingling on January 18, and ended after Tropical Storm Jangmi which dissipated on January 1 of the next year.

The 2015 Pacific typhoon season was a slightly above average season that produced twenty-seven tropical storms, eighteen typhoons, and nine super typhoons. The season ran throughout 2015, though most tropical cyclones typically develop between May and November. The season's first named storm, Mekkhala, developed on January 15, while the season's last named storm, Melor, dissipated on December 17. The season saw at least one named tropical system forming in each of every month, the first time since 1965. Similar to the previous season, this season saw a high number of super typhoons. Accumulated cyclone energy (ACE) during 2015 was extremely high, the third highest since 1970, and the 2015 ACE has been attributed in part to anthropogenic warming, and also the 2014-16 El Niño event, that led to similarly high ACE values in the East Pacific.

The 2017 Pacific typhoon season was a below-average season in terms of accumulated cyclone energy and the number of typhoons and super typhoons, and the first since the 1977 season to not produce a Category 5-equivalent typhoon on the Saffir–Simpson scale. The season produced a total of 27 named storms, 11 typhoons, and only two super typhoons, making it an average season in terms of storm numbers. It was an event in the annual cycle of tropical cyclone formation, in which tropical cyclones form in the western Pacific Ocean. The season runs throughout 2017, though most tropical cyclones typically develop between May and October. The season's first named storm, Muifa, developed on April 25, while the season's last named storm, Tembin, dissipated on December 26. This season also featured the latest occurrence of the first typhoon of the year since 1998, with Noru reaching this intensity on July 23.

The 2019 Pacific typhoon season was a devastating season that became the costliest on record, just ahead of the previous year and 2023, mainly due to the catastrophic damage wrought by typhoons Lekima, Faxai, and Hagibis. The season featured fairly above-average tropical cyclone activity for the second consecutive year, producing 29 named storms, 17 typhoons, and five super typhoons. The season's first named storm, Pabuk, reached tropical storm status on January 1, becoming the earliest-forming tropical storm of the western Pacific Ocean on record, breaking the previous record that was held by Typhoon Alice in 1979. The season's first typhoon, Wutip, reached typhoon status on February 20. Wutip further intensified into a super typhoon on February 23, becoming the strongest February typhoon on record, and the strongest tropical cyclone recorded in February in the Northern Hemisphere. The season's last named storm, Phanfone, dissipated on December 29 after it made landfall in the Philippines.
Most of the tropical cyclones of the 2013 Pacific typhoon season formed between May and November of that year. The scope of this article is the Pacific Ocean north of the equator, between 100°E and the International Date Line. Tropical storms which form in the Western Pacific basin are assigned a name by the Japan Meteorological Agency (JMA). Tropical depressions forming in this basin are given a number with a "W" suffix by the United States' Joint Typhoon Warning Center (JTWC). The Philippine Atmospheric, Geophysical and Astronomical Services Administration (PAGASA) assigns names to tropical cyclones that enter or form in the Philippine area of responsibility, but these names are not in common use outside the Philippines.
This timeline documents all of the events of the 2011 Pacific typhoon season, the period that tropical cyclones formed in the Western Pacific Ocean in 2011. Most of the tropical cyclones formed between May and November 2011. The scope of this article is limited to the Pacific Ocean, north of the equator between 100°E and the International Date Line. Tropical storms that form in the entire Western Pacific basin are assigned a name by the Japan Meteorological Agency (JMA). Tropical depressions that form in this basin are given a number with a "W" suffix by the United States' Joint Typhoon Warning Center (JTWC). In addition, the Philippine Atmospheric, Geophysical and Astronomical Services Administration (PAGASA) assigns names to tropical cyclones that enter or form in the Philippine area of responsibility. These names, however, are not in common use outside of the Philippines.
This timeline documents all of the events of the 2012 Pacific typhoon season. The scope of this article is limited to the Pacific Ocean, north of the equator between 100°E and the International Date Line. During the season, 34 systems were designated as tropical depressions by either the Japan Meteorological Agency (JMA), the Philippine Atmospheric, Geophysical and Astronomical Services Administration (PAGASA), the Joint Typhoon Warning Center (JTWC), or other National Meteorological and Hydrological Services such as the China Meteorological Administration and the Hong Kong Observatory. Since the JMA runs the Regional Specialized Meteorological Centre (RSMC) for the Western Pacific, they assigned names to tropical depressions which developed into tropical storms in the basin. PAGASA also assigned local names to systems which are active in their area of responsibility; however, these names are not in common use outside of the Philippines.
This timeline documents all of the events of the 2015 Pacific typhoon season. Most of the tropical cyclones formed between May and November. The scope of this article is limited to the Pacific Ocean, north of the equator between 100°E and the International Date Line. This area, called the Western Pacific basin, is the responsibility of the Japanese Meteorological Agency (JMA). They host and operate the Regional Specialized Meteorological Center (RSMC), located in Tokyo. The Japanese Meteorological Agency (JMA) is also responsible for assigning names to all tropical storms that are formed within the basin. However, any storm that enters or forms in the Philippine Area of Responsibility (PAR) will be named by the Philippine Atmospheric, Geophysical and Astronomical Services Administration (PAGASA) using a local name. Also of note - the Western Pacific basin is monitored by the United States' Joint Typhoon Warning Center (JTWC), which gives all Tropical depressions a number with a "W" suffix.

The 2023 Pacific typhoon season was the fourth and final consecutive below-average season and became the third-most inactive typhoon season on record in terms of named storms, with just 17 named storms developing, only ahead of 2010 and 1998. Despite the season occurring during an El Niño event, which typically favors activity in the basin, activity was abnormally low. This was primarily due to a consistent period of negative PDO, which typically discourages tropical storm formation in this basin. The season was less active than the 2023 Atlantic hurricane season in terms of named storms, the fourth such season on record, after 2005, 2010 and 2020. The season's number of storms also did not exceed that of the 2023 Pacific hurricane season. Only ten became typhoons, with four strengthening further into super typhoons. However, it was very destructive, primarily due to Typhoon Doksuri which devastated the northern Philippines, Taiwan, and China in July, becoming the costliest typhoon on record as well as the costliest typhoon to hit mainland China, and Typhoon Haikui in September, which devastated China, Taiwan, and Hong Kong. The season was less active in Southeast Asia, with no tropical storm making landfall in mainland Vietnam.

Typhoon Hagupit, known in the Philippines as Severe Tropical Storm Dindo, was a Category 1 typhoon that heavily impacted Eastern China and South Korea in August 2020. It was the fourth named storm and the second typhoon of the annual typhoon season. The JMA began monitoring a tropical depression that developed in the Philippine Sea on July 30, with PAGASA assigning the name “Dindo” to the storm, later that day it strengthened into a tropical storm, according to the JMA. PAGASA issued its final advisory on Dindo early on August 3, as it moved out of their area of responsibility. Hagupit intensified into a typhoon on August 3, before making landfall in Wenzhou, China at 19:30 UTC that day at peak intensity. Hagupit subsequently weakened over China, before degenerating into an extratropical low on August 5. Hagupit's remnants persisted for another several days, as the storm moved eastward, before dissipating south of Alaska on August 14.

The 2024 Pacific typhoon season was the fifth-latest starting Pacific typhoon season on record, yet featured average activity, ending the streak of below average typhoon seasons that started in 2020. It was also the deadliest season since 2013, and became the fourth-costliest Pacific typhoon season on record, mostly due to Typhoon Yagi. This season saw an unusually active November, with the month seeing four simultaneously active named storms. The season runs throughout 2024, though most tropical cyclones typically develop between May and October. The season's first named storm, Ewiniar, developed on May 25, and eventually intensified into the first typhoon of the season, while the last named storm, Pabuk, dissipated on December 26. This season was an event in the annual cycle of tropical cyclone formation in the western Pacific Ocean.


