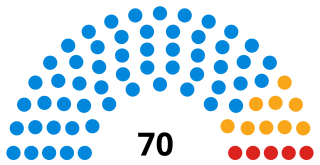
Elections to West Sussex County Council were held on 1 May 1997, alongside a parliamentary general election. The whole council was up for election, and the Conservative Party regained control of the council from the Liberal Democrats who had governed since 1993 as a minority administration . Turnout across the county ranged from 57.7% in Richmond to 78.6% in Lindfield.
West Sussex County Council (WSCC) is the authority that governs the non-metropolitan county of West Sussex. The county also contains 7 district and borough councils, and 159 town, parish and neighbourhood councils. The county council has 71 elected councillors. The Chief Executive and her/his team of Executive Directors are responsible for the day-to-day running of the council.
The Conservative Party, officially the Conservative and Unionist Party, is a centre-right political party in the United Kingdom. The governing party since 2010, it is the largest in the House of Commons, with 313 Members of Parliament, and also has 249 members of the House of Lords, 18 members of the European Parliament, 31 Members of the Scottish Parliament, 12 members of the Welsh Assembly, eight members of the London Assembly and 8,916 local councillors.
Party | Seats | Gains | Losses | Net gain/loss | Seats % | Votes % | Votes | +/− | |
---|---|---|---|---|---|---|---|---|---|
Conservative | 37 | 52.11 | 42.90 | 177,848 | |||||
Liberal Democrat | 24 | 33.80 | 33.10 | 137,191 | |||||
Labour | 9 | 12.68 | 21.49 | 89,099 | |||||
Independent | 1 | 1.41 | 1.68 | 6,494 | |||||
Green | 0 | 0 | 0 | 0 | 0.0 | 0.72 | 2,999 | ||
Referendum | 0 | 0 | 0 | 0 | 0.0 | 0.08 | 327 | ||
Worth Area Party | 0 | 0 | 0 | 0 | 0.0 | 0.03 | 110 |
Party | Candidate | Votes | % | ± | |
---|---|---|---|---|---|
Liberal Democrat | Sydney Little | 1,859 | 37.2 | ||
Conservative | Paul Sims | 1,639 | 32.9 | ||
Labour Co-op | Nigel Sweet | 1,491 | 29.9 | ||
Majority | 220 | ||||
Turnout | 72.3 |
Party | Candidate | Votes | % | ± | |
---|---|---|---|---|---|
Liberal Democrat | Clifford Robinson | 2,866 | 46.2 | ||
Conservative | Simon Craghill | 2,070 | 33.3 | ||
Labour | James Largue | 1,271 | 20.5 | ||
Majority | 794 | ||||
Turnout | 74.2 |
Party | Candidate | Votes | % | ± | |
---|---|---|---|---|---|
Conservative | Graham Jones | 2,562 | 45.2 | ||
Liberal Democrat | Jemima Robinson | 2,372 | 41.9 | ||
Labour Co-op | Richard Knight | 733 | 12.9 | ||
Majority | 190 | ||||
Turnout | 69.9 |
Party | Candidate | Votes | % | ± | |
---|---|---|---|---|---|
Conservative | Ian Elliott | 3,109 | 46.6 | ||
Liberal Democrat | Anthony Burtenshaw | 2,094 | 31.4 | ||
Labour Co-op | Geoffrey Howitt | 1,463 | 21.9 | ||
Majority | 1,015 | ||||
Turnout | 76.6 |
Party | Candidate | Votes | % | ± | |
---|---|---|---|---|---|
Liberal Democrat | Malcolm Brookes | 1,992 | 41.4 | ||
Conservative | Mark McCarthy | 1,492 | 31.4 | ||
Labour | Edward Luxford | 1,331 | 21.9 | ||
Majority | 500 | ||||
Turnout | 71.6 |
Party | Candidate | Votes | % | ± | |
---|---|---|---|---|---|
Labour Co-op | Brian Whipp | 1,856 | 35.8 | ||
Conservative | Robert Dunn | 1,827 | 35.3 | ||
Liberal Democrat | Derek Deedman | 1,497 | 28.9 | ||
Majority | 29 | ||||
Turnout | 74.5 |
Party | Candidate | Votes | % | ± | |
---|---|---|---|---|---|
Conservative | Christopher Sedgwick | 3,165 | 63.6 | ||
Liberal Democrat | John Hughes | 1,326 | 26.7 | ||
Labour | Frank Levy | 482 | 9.7 | ||
Majority | 1,839 | ||||
Turnout | 78.1 |
Party | Candidate | Votes | % | ± | |
---|---|---|---|---|---|
Conservative | Margaret Winn | 3,149 | 51.8 | ||
Liberal Democrat | John Barstow | 1,707 | 28.1 | ||
Labour | David Jones | 1,221 | 20.1 | ||
Majority | 1,442 | ||||
Turnout | 74.3 |
Party | Candidate | Votes | % | ± | |
---|---|---|---|---|---|
Liberal Democrat | Sylvia Olliver | 2,577 | 38.5 | ||
Conservative | Gary Boucher | 2,171 | 32.4 | ||
Labour | Jan Cosgrove | 1,948 | 29.1 | ||
Majority | 406 | ||||
Turnout | 67.5 |
Party | Candidate | Votes | % | ± | |
---|---|---|---|---|---|
Conservative | Robin Brown | 2,768 | 44.6 | ||
Liberal Democrat | Kenneth Scutt | 2,444 | 39.4 | ||
Labour | Gail Walker | 995 | 16.0 | ||
Majority | 324 | ||||
Turnout | 67.8 |
Party | Candidate | Votes | % | ± | |
---|---|---|---|---|---|
Independent | Dominica Smith | 3,035 | 54.6 | ||
Liberal Democrat | Walter Vanner | 1,621 | 29.2 | ||
Labour | Alison McIsacc | 899 | 16.2 | ||
Majority | 1,432 | ||||
Turnout | 70.5 |
Party | Candidate | Votes | % | ± | |
---|---|---|---|---|---|
Conservative | Harold Hall | 3,199 | 56.4 | ||
Liberal Democrat | Simon McDougall | 1,896 | 33.4 | ||
Labour | Thomas Oxtoby | 576 | 10.2 | ||
Majority | 1,297 | ||||
Turnout | 72.3 |
Party | Candidate | Votes | % | ± | |
---|---|---|---|---|---|
Liberal Democrat | Catherine Morrish | 1,975 | 39.7 | ||
Conservative | Luke Parker | 1,610 | 32.4 | ||
Labour | Derek Fane | 1,388 | 27.9 | ||
Majority | 365 | ||||
Turnout | 63.3 |
Party | Candidate | Votes | % | ± | |
---|---|---|---|---|---|
Labour | George O'Neill | 2,113 | 44.9 | ||
Conservative | John Forster | 1,508 | 32.0 | ||
Liberal Democrat | David Jones | 1,087 | 23.1 | ||
Majority | 606 | ||||
Turnout | 63.7 |
Party | Candidate | Votes | % | ± | |
---|---|---|---|---|---|
Conservative | Elizabeth Newell | 2,022 | 34.0 | ||
Liberal Democrat | Barbara Roberts | 1,730 | 29.1 | ||
Labour | David Dyball | 1,711 | 28.7 | ||
Independent | Andrew Hawkes | 492 | 8.3 | ||
Majority | 292 | ||||
Turnout | 63.7 |
Party | Candidate | Votes | % | ± | |
---|---|---|---|---|---|
Conservative | John Betteridge | 2,566 | 45.5 | ||
Liberal Democrat | John Matthews | 1,989 | 35.3 | ||
Labour | Peter Found | 884 | 15.7 | ||
Independent | Marjorie Widdowson | 202 | 3.6 | ||
Majority | 577 | ||||
Turnout | 71.9 |
Party | Candidate | Votes | % | ± | |
---|---|---|---|---|---|
Conservative | Christopher Gillings | 3,409 | 49.7 | ||
Liberal Democrat | Francis Oppler | 1,914 | 27.9 | ||
Labour | Michael Jones | 1,531 | 22.3 | ||
Majority | 1,576 | ||||
Turnout | 73.6 |
Party | Candidate | Votes | % | ± | |
---|---|---|---|---|---|
Conservative | Peter Moor | 3,610 | 54.7 | ||
Liberal Democrat | John Richards | 2,070 | 31.4 | ||
Labour | Peter Nightingale | 914 | 13.9 | ||
Majority | 1,540 | ||||
Turnout | 73.6 |
Party | Candidate | Votes | % | ± | |
---|---|---|---|---|---|
Liberal Democrat | James Walsh | 2,802 | 45.2 | ||
Conservative | Phillipa Bower | 2,563 | 41.3 | ||
Labour | John Singleton | 835 | 13.9 | ||
Majority | 239 | ||||
Turnout | 73.6 |
Party | Candidate | Votes | % | ± | |
---|---|---|---|---|---|
Conservative | Thomas Dunn | 2,503 | 40.5 | ||
Liberal Democrat | Roy Ford | 1,894 | 30.6 | ||
Independent | Stanley Bray | 986 | 15.9 | ||
Labour | Roger Humphrey | 801 | 13.0 | ||
Majority | 609 | ||||
Turnout | 73.6 |
Party | Candidate | Votes | % | ± | |
---|---|---|---|---|---|
Liberal Democrat | Colin Tupper | 2,246 | 45.7 | ||
Conservative | Jane Chevs | 1,742 | 35.5 | ||
Labour | Timothy Weeks | 925 | 18.8 | ||
Majority | 506 | ||||
Turnout | 68.5 |
Party | Candidate | Votes | % | ± | |
---|---|---|---|---|---|
Conservative | Alan Phillips | 2,386 | 45.5 | ||
Liberal Democrat | Edith Pingree | 2,232 | 42.6 | ||
Labour | James Moran | 625 | 11.9 | ||
Majority | 56 | ||||
Turnout | 76.2 |
Party | Candidate | Votes | % | ± | |
---|---|---|---|---|---|
Liberal Democrat | John Rankin | 2,589 | 44.1 | ||
Conservative | Mary-Louise Bassett | 2,338 | 39.8 | ||
Labour | Geoffrey Jones | 943 | 16.1 | ||
Majority | 251 | ||||
Turnout | 73.0 |
Party | Candidate | Votes | % | ± | |
---|---|---|---|---|---|
Conservative | Kathryn Ward | 2,947 | 46.2 | ||
Liberal Democrat | Jennifer Wright | 2,500 | 39.2 | ||
Labour | Ian Edwards | 926 | 14.5 | ||
Majority | 447 | ||||
Turnout | 76.3 |
Party | Candidate | Votes | % | ± | |
---|---|---|---|---|---|
Conservative | Terence Pemberton | 3,034 | 50.5 | ||
Liberal Democrat | Helena Lang | 2,395 | 39.9 | ||
Labour | David Morrison | 576 | 9.6 | ||
Majority | 639 | ||||
Turnout | 72.3 |
Party | Candidate | Votes | % | ± | |
---|---|---|---|---|---|
Conservative | Colin Walker | 3,753 | 55.9 | ||
Liberal Democrat | Robert Devreux | 2,090 | 31.1 | ||
Labour | Bernard Hollowood | 874 | 13.0 | ||
Majority | 1,763 | ||||
Turnout | 74.3 |
Party | Candidate | Votes | % | ± | |
---|---|---|---|---|---|
Conservative | Sarah Greenwell | 3,755 | 56.4 | ||
Independent | Brian Hooton | 1,779 | 26.7 | ||
Labour | Andrew Young | 1,128 | 16.9 | ||
Majority | 1,976 | ||||
Turnout | 76.8 |
Party | Candidate | Votes | % | ± | |
---|---|---|---|---|---|
Conservative | Peter Jones | 2,796 | 48.9 | ||
Labour | Terrence Prince | 1,394 | 24.4 | ||
Liberal Democrat | Michael Shone | 1,331 | 23.3 | ||
Green | Eric Paine | 191 | 3.3 | ||
Majority | 1,402 | ||||
Turnout | 69.9 |
Party | Candidate | Votes | % | ± | |
---|---|---|---|---|---|
Conservative | John Daws-Chew | 3,521 | 54.2 | ||
Liberal Democrat | Simon Green | 2,150 | 33.1 | ||
Labour | John Feeney | 830 | 12.8 | ||
Majority | 1,369 | ||||
Turnout | 72.2 |
Party | Candidate | Votes | % | ± | |
---|---|---|---|---|---|
Labour | Janet Scully | 3,771 | 70.6 | ||
Conservative | Lee Burke | 1,569 | 29.4 | ||
Majority | 2,202 | ||||
Turnout | 66.9 |
Party | Candidate | Votes | % | ± | |
---|---|---|---|---|---|
Labour | Michael Briggs | 3,012 | 59.1 | ||
Conservative | David Bowen | 1,458 | 28.6 | ||
Liberal Democrat | Linda Hamilton | 627 | 12.3 | ||
Majority | 1,552 | ||||
Turnout | 64.0 |
Party | Candidate | Votes | % | ± | |
---|---|---|---|---|---|
Conservative | Henry Smith | 3,839 | 44.8 | ||
Labour | Anne Todd | 3,521 | 41.1 | ||
Liberal Democrat | Darren Wise | 1,209 | 14.1 | ||
Majority | 318 | ||||
Turnout | 71.9 |
Party | Candidate | Votes | % | ± | |
---|---|---|---|---|---|
Labour | Anthony Edwards | 2,628 | 51.8 | ||
Conservative | Geoffrey Clarke | 1,749 | 34.5 | ||
Liberal Democrat | Josephine Hart | 696 | 13.7 | ||
Majority | 879 | ||||
Turnout | 71.9 |
Party | Candidate | Votes | % | ± | |
---|---|---|---|---|---|
Labour | John Mortimer | 2,532 | 59.4 | ||
Conservative | Corrine Bowen | 1,181 | 27.7 | ||
Liberal Democrat | Howard Llewelyn | 548 | 12.9 | ||
Majority | 1,351 | ||||
Turnout | 71.2 |
Party | Candidate | Votes | % | ± | |
---|---|---|---|---|---|
Labour | James Smith | 3,292 | 68.2 | ||
Conservative | Sthphen Wilkinson | 1,140 | 23.6 | ||
Liberal Democrat | Vipin Patel | 392 | 8.1 | ||
Majority | 2,152 | ||||
Turnout | 71.9 |
Party | Candidate | Votes | % | ± | |
---|---|---|---|---|---|
Labour | William Buck | 2,854 | 50.9 | ||
Conservative | Colin Coyston | 1,585 | 28.2 | ||
Liberal Democrat | Barry Hamilton | 1,172 | 20.9 | ||
Majority | 1,269 | ||||
Turnout | 74.5 |
Party | Candidate | Votes | % | ± | |
---|---|---|---|---|---|
Conservative | David Dewdney | 2,804 | 48.9 | ||
Labour | Raymond Calcot | 1,954 | 34.1 | ||
Liberal Democrat | Martin Hart | 866 | 15.1 | ||
Worth Area Party | Peter Temple-Smithson | 110 | 1.9 | ||
Majority | 850 | ||||
Turnout | 75.0 |
Party | Candidate | Votes | % | ± | |
---|---|---|---|---|---|
Labour | Douglas Mayne | 3,342 | 61.9 | ||
Conservative | David Withall | 1,372 | 25.4 | ||
Liberal Democrat | Richard Miller | 686 | 12.7 | ||
Majority | 1,970 | ||||
Turnout | 73.6 |
Party | Candidate | Votes | % | ± | |
---|---|---|---|---|---|
Conservative | Tara Podger | 2,116 | 44.1 | ||
Liberal Democrat | Geoffrey Lawes | 1,706 | 35.5 | ||
Labour | Philip Gander | 650 | 13.5 | ||
Referendum | Robert Lomas | 327 | 6.8 | ||
Majority | 410 | ||||
Turnout | 72.0 |
Party | Candidate | Votes | % | ± | |
---|---|---|---|---|---|
Conservative | William Cantello | 3,587 | 58.3 | ||
Liberal Democrat | Marcus Heawood | 1,607 | 26.1 | ||
Labour | Susan Erlam | 961 | 15.6 | ||
Majority | 1,970 | ||||
Turnout | 74.9 |
Party | Candidate | Votes | % | ± | |
---|---|---|---|---|---|
Conservative | Neil Matthewson | 4,207 | 51.9 | ||
Liberal Democrat | Derek Brundish | 2,639 | 32.6 | ||
Labour | Raymond Chapman | 1,254 | 15.5 | ||
Majority | 1,568 | ||||
Turnout | 73.7 |
Party | Candidate | Votes | % | ± | |
---|---|---|---|---|---|
Liberal Democrat | Nigel Dennis | 2,207 | 45.9 | ||
Conservative | Peter Tobutt | 2,043 | 42.5 | ||
Labour | Joan Thurston | 559 | 15.6 | ||
Majority | 164 | ||||
Turnout | 71.1 |
Party | Candidate | Votes | % | ± | |
---|---|---|---|---|---|
Conservative | Carmel Cain | 5,093 | 74.0 | ||
Labour | Christine Rees | 1,788 | 26.0 | ||
Majority | 3,305 | ||||
Turnout | 73.3 |
Party | Candidate | Votes | % | ± | |
---|---|---|---|---|---|
Liberal Democrat | Morwen Millson | 2,790 | 46.6 | ||
Conservative | Barbara Palmer | 2,405 | 40.2 | ||
Labour | George Burton | 788 | 13.2 | ||
Majority | 385 | ||||
Turnout | 72.6 |
Party | Candidate | Votes | % | ± | |
---|---|---|---|---|---|
Liberal Democrat | Jacobus Clausen | 2,606 | 40.8 | ||
Conservative | Brian Watson | 2,603 | 40.7 | ||
Labour | Roger Brown | 1,179 | 18.5 | ||
Majority | 3 | ||||
Turnout | 74.0 |
Party | Candidate | Votes | % | ± | |
---|---|---|---|---|---|
Liberal Democrat | Mary Beeson | 3,303 | 44.6 | ||
Conservative | Trevor Boud | 3,135 | 42.3 | ||
Labour | Diane Dumbrill | 968 | 13.1 | ||
Majority | 168 | ||||
Turnout | 73.8 |
Party | Candidate | Votes | % | ± | |
---|---|---|---|---|---|
Liberal Democrat | John Campbell | 2,956 | 47.3 | ||
Conservative | Anthony Dennis | 2,649 | 42.4 | ||
Labour | Julia Bridgewater | 639 | 10.2 | ||
Majority | 307 | ||||
Turnout | 74.2 |
Party | Candidate | Votes | % | ± | |
---|---|---|---|---|---|
Conservative | Frank Wilkinson | 2,781 | 51.3 | ||
Liberal Democrat | Kenneth Bates | 2,042 | 37.7 | ||
Labour | David Wickham | 594 | 11.0 | ||
Majority | 739 | ||||
Turnout | 72.8 |
Party | Candidate | Votes | % | ± | |
---|---|---|---|---|---|
Conservative | Norman Horton | 2,666 | 50.9 | ||
Liberal Democrat | David Wright | 1,990 | 38.0 | ||
Labour | Eric Brady | 583 | 11.1 | ||
Majority | 676 | ||||
Turnout | 74.6 |
Party | Candidate | Votes | % | ± | |
---|---|---|---|---|---|
Liberal Democrat | Angela Chapman | 3,258 | 45.8 | ||
Conservative | Peter Burgess | 2,532 | 35.6 | ||
Labour | Paul Mitchell | 1,170 | 16.4 | ||
Green | Hugh Stevens | 155 | 2.2 | ||
Majority | 906 | ||||
Turnout | 76.9 |
Party | Candidate | Votes | % | ± | |
---|---|---|---|---|---|
Liberal Democrat | Heather Ross | 2,903 | 51.3 | ||
Conservative | Michael Greenhow | 1,964 | 34.7 | ||
Labour | Lesley Whiting | 664 | 11.7 | ||
Green | Ruth Stevens | 128 | 2.3 | ||
Majority | 939 | ||||
Turnout | 77.2 |
Party | Candidate | Votes | % | ± | |
---|---|---|---|---|---|
Conservative | Michael Dennis | 3,066 | 51.8 | ||
Liberal Democrat | Jack Slaughter | 1,763 | 29.8 | ||
Labour | Frederick Harrison | 774 | 13.1 | ||
Green | Josephine Came | 317 | 5.4 | ||
Majority | 1,303 | ||||
Turnout | 78.0 |
Party | Candidate | Votes | % | ± | |
---|---|---|---|---|---|
Liberal Democrat | Margaret Collins | 2,645 | 45.6 | ||
Conservative | Margaret Ball | 2,239 | 38.6 | ||
Labour | Margaret Scott | 692 | 11.9 | ||
Green | Adrian Salmon | 226 | 3.9 | ||
Majority | 407 | ||||
Turnout | 76.9 |
Party | Candidate | Votes | % | ± | |
---|---|---|---|---|---|
Liberal Democrat | Andrew Brock | 2,470 | 44.1 | ||
Conservative | Allan Beal | 2,429 | 43.3 | ||
Labour | David Dickson | 705 | 12.6 | ||
Majority | 41 | ||||
Turnout | 76.7 |
Party | Candidate | Votes | % | ± | |
---|---|---|---|---|---|
Liberal Democrat | Tony Balsdon | 3,238 | 46.2 | ||
Conservative | David Terry | 2,494 | 35.6 | ||
Labour | Patricia Ashcroft | 1,102 | 15.7 | ||
Green | Carol Filby | 169 | 2.4 | ||
Majority | 744 | ||||
Turnout | 77.3 |
Party | Candidate | Votes | % | ± | |
---|---|---|---|---|---|
Conservative | Joan Gayler | 1,947 | 35.1 | ||
Labour | Mervyn Hamilton | 1,743 | 31.4 | ||
Liberal Democrat | Julia Brown | 1,735 | 31.3 | ||
Green | Edward Hasley | 125 | 2.3 | ||
Majority | 204 | ||||
Turnout | 78.2 |
Party | Candidate | Votes | % | ± | |
---|---|---|---|---|---|
Liberal Democrat | Brian Hall | 2,557 | 46.6 | ||
Conservative | John Wilson | 1,937 | 35.3 | ||
Labour | Paddy Henry | 835 | 15.2 | ||
Green | Simon Anderson | 156 | 2.8 | ||
Majority | 620 | ||||
Turnout | 77.5 |
Party | Candidate | Votes | % | ± | |
---|---|---|---|---|---|
Conservative | Phillip Coote | 3,573 | 46.3 | ||
Liberal Democrat | Dorothy Hatswell | 2,747 | 35.6 | ||
Labour | Roger Burgess | 1,179 | 15.3 | ||
Green | Stephanie Gibson | 223 | 2.9 | ||
Majority | 826 | ||||
Turnout | 76.6 |
Party | Candidate | Votes | % | ± | |
---|---|---|---|---|---|
Conservative | Margaret Johnson | 2,789 | 48.2 | ||
Liberal Democrat | Anne-Marie Lucraft | 2,019 | 34.9 | ||
Labour | Nicholas Lightbody | 761 | 13.2 | ||
Green | Peter Weymss-Gorman | 215 | 3.7 | ||
Majority | 770 | ||||
Turnout | 78.6 |
Party | Candidate | Votes | % | ± | |
---|---|---|---|---|---|
Conservative | William Acraman | 3,288 | 53.2 | ||
Liberal Democrat | Nicholas Dennis | 1,379 | 22.3 | ||
Labour | Joe Mitchell | 1,291 | 20.9 | ||
Green | Maurice Weeler | 223 | 3.6 | ||
Majority | 1,909 | ||||
Turnout | 74.2 |
Party | Candidate | Votes | % | ± | |
---|---|---|---|---|---|
Conservative | Barrington Mack | 3,112 | 56.0 | ||
Liberal Democrat | Anthony Davies | 1,477 | 26.6 | ||
Labour | Maureen Ryan | 795 | 14.3 | ||
Green | Nadia Seefreid | 176 | 3.2 | ||
Majority | 1,635 | ||||
Turnout | 78.1 |
Party | Candidate | Votes | % | ± | |
---|---|---|---|---|---|
Liberal Democrat | Amanda Claire | 2,362 | 46.3 | ||
Conservative | Celia Bettelley | 1,769 | 34.7 | ||
Labour | Michael Wooley | 974 | 19.1 | ||
Majority | 1,592 | 31.2 | |||
Turnout | 5,105 | 69.9 |
Party | Candidate | Votes | % | ± | |
---|---|---|---|---|---|
Conservative | Collingwood O'Neill | 3,241 | 51.8 | ||
Liberal Democrat | George Miller | 2,441 | 39.0 | ||
Labour | Teana Ashley | 577 | 9.2 | ||
Majority | 800 | ||||
Turnout | 74.0 |
Party | Candidate | Votes | % | ± | |
---|---|---|---|---|---|
Liberal Democrat | Nicholas Rodgers | 2,400 | 44.0 | ||
Conservative | Patricia Farrel | 2,326 | 42.6 | ||
Labour | Karen Hammond | 734 | 13.4 | ||
Majority | 74 | ||||
Turnout | 71.1 |
Party | Candidate | Votes | % | ± | |
---|---|---|---|---|---|
Liberal Democrat | Irene Richards | 2,009 | 41.0 | ||
Conservative | Tony Jackson | 1,737 | 35.4 | ||
Labour | Colin Marshall | 996 | 20.3 | ||
Green | Joan Glass | 161 | 3.3 | ||
Majority | 272 | ||||
Turnout | 62.7 |
Party | Candidate | Votes | % | ± | |
---|---|---|---|---|---|
Conservative | Graham Forshaw | 3,351 | 54.2 | ||
Liberal Democrat | Stewart McGurn-Stewart | 2,134 | 34.5 | ||
Labour | Olive Rand | 696 | 11.3 | ||
Majority | 2,217 | ||||
Turnout | 71.9 |
Party | Candidate | Votes | % | ± | |
---|---|---|---|---|---|
Liberal Democrat | Peter Green | 2,300 | 45.7 | ||
Conservative | Paul Bleasdale | 1,769 | 35.2 | ||
Labour | Peter Balderstone | 961 | 19.1 | ||
Majority | 531 | ||||
Turnout | 72.0 |
Party | Candidate | Votes | % | ± | |
---|---|---|---|---|---|
Conservative | John Livermore | 1,654 | 41.2 | ||
Liberal Democrat | Cyril Selby | 1,519 | 37.8 | ||
Labour | John Hammond | 665 | 16.6 | ||
Green | Derek Colkett | 179 | 4.5 | ||
Majority | 135 | ||||
Turnout | 57.7 |
Party | Candidate | Votes | % | ± | |
---|---|---|---|---|---|
Conservative | Clement Stevens | 2,601 | 46.1 | ||
Liberal Democrat | Dennis Rowley | 2,327 | 41.3 | ||
Labour | Jean Wicks | 713 | 12.6 | ||
Majority | 229 | ||||
Turnout | 72.3 |
Party | Candidate | Votes | % | ± | |
---|---|---|---|---|---|
Conservative | Esther Giddins | 3,177 | 53.6 | ||
Liberal Democrat | Helen Brown | 1,789 | 30.2 | ||
Labour | Julie Balderstone | 780 | 13.2 | ||
Green | Lucielle Cokett | 185 | 3.1 | ||
Majority | 1,388 | ||||
Turnout | 69.5 |
Party | Candidate | Votes | % | ± | |
---|---|---|---|---|---|
Liberal Democrat | John Rose | 2,432 | 48.5 | ||
Conservative | Henry Kemp | 1,657 | 33.0 | ||
Labour | John Parr | 759 | 15.1 | ||
Green | Stuart Colgate | 170 | 3.4 | ||
Majority | 585 | ||||
Turnout | 66.8 |
A county council is the elected administrative body governing an area known as a county. This term has slightly different meanings in different countries.
Barnet London Borough Council in London, England is elected every four years. Since the last boundary changes in 2002, 63 councillors have been elected from 21 wards.
Buckinghamshire County Council in England is elected every four years.
Oxfordshire County Council is elected every four years.
Lancashire County Council is the upper-tier local authority for the non-metropolitan county of Lancashire, England. It consists of 84 councillors. After the Lancashire County Council election, 2017, the council is under Conservative control, having been under no overall control from 2013-17 and under Conservative control from 2009-13.
Local elections took place in some parts of the UK on 7 June 2001. Elections took place for all of the English shire counties, some English unitary authorities and all of the Northern Ireland districts. The elections were delayed from the usual date of the first Thursday in May due to the 2001 UK foot and mouth crisis and were held on the same day as the general election.
The County Council of the City and County of Cardiff is the governing body for Cardiff, one of the Principal Areas of Wales. The council consists of 75 councillors, representing 29 electoral wards. The authority is properly styled as The County Council of the City and County of Cardiff or in common use Cardiff Council. No other style is sanctioned for use on Council Documents although it does occasionally appear wrongly as Cardiff County Council on documents and signage. The City & County itself is usually simply referred to as Cardiff.
Essex County Council in England is elected every four years. Since the last boundary changes in 2005, 75 councillors are elected from 70 wards.
The wards and electoral divisions in the United Kingdom are electoral districts at sub-national level represented by one or more councillors. The ward is the primary unit of English electoral geography for civil parishes and borough and district councils, electoral ward is the unit used by Welsh principal councils, while the electoral division is the unit used by English county councils and some unitary authorities. Each ward/division has an average electorate of about 5,500 people, but ward-population counts can vary substantially. As at the end of 2014 there were 9,456 electoral wards/divisions in the UK.
The first elections to the new local authorities established by the Local Government Act 1972 in England and Wales and the new Northern Ireland district councils created by the Local Government Act 1972 took place in 1973. Elections to the existing Greater London Council also took place.
The Council of the Isles of Scilly is a sui generis unitary local government authority covering the Isles of Scilly off the west coast of Cornwall. It is currently made up of 16 seats, with all councillors being Independents as of 2 May 2013. The council was created in 1890 as the Isles of Scilly Rural District Council and was renamed in 1974.
The 2008 United Kingdom local elections were held on 1 May 2008. These elections took place in 137 English Local Authorities and all Welsh Councils.
As a result of the 2009 structural changes to local government in England, the former Wiltshire County Council and the four districts within its geographical area were replaced by the new Wiltshire Council, which is a unitary authority covering the same area, with elections continuing to be held every four years, beginning in June 2009. Previously, Wiltshire County Council had been elected between 1889 and 2005, initially every three years, later every four years.
Wiltshire Council is a council for the unitary authority of Wiltshire in South West England, created in 2009. It is the successor authority to Wiltshire County Council (1889–2009) and the four district councils of Kennet, North Wiltshire, Salisbury, and West Wiltshire, all of which were created in 1974 and abolished in 2009.
Shropshire Council is the local authority of Shropshire in England. It is a unitary authority, having the powers of a non-metropolitan county and district council combined.
Shropshire Council is elected in full every four years.
Middlesex County Council was the principal local government body in the administrative county of Middlesex, England from 1889 to 1965.
Essex is a county in the south-east of England, north-east of London. One of the home counties, it borders Suffolk and Cambridgeshire to the north, Hertfordshire to the west, Kent across the estuary of the River Thames to the south, and London to the south-west. The county town is Chelmsford, the only city in the county. For government statistical purposes Essex is placed in the East of England region.
The 2017 United Kingdom local elections were held on Thursday 4 May 2017. Local elections were held across Great Britain, with elections to 35 English local authorities and all councils in Scotland and Wales.