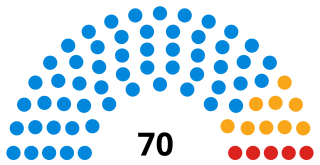
Elections to West Sussex County Council were held on 5 May 2005. The whole council was up for election and the Conservatives held overall control.
West Sussex County Council (WSCC) is the authority that governs the non-metropolitan county of West Sussex. The county also contains 7 district and borough councils, and 159 town, parish and neighbourhood councils. The county council has 71 elected councillors. The Chief Executive and her/his team of Executive Directors are responsible for the day-to-day running of the council.
The Conservative Party, officially the Conservative and Unionist Party, is a centre-right political party in the United Kingdom. The governing party since 2010, it is the largest in the House of Commons, with 313 Members of Parliament, and also has 249 members of the House of Lords, 18 members of the European Parliament, 31 Members of the Scottish Parliament, 12 members of the Welsh Assembly, eight members of the London Assembly and 8,916 local councillors.
Party | Seats | Gains | Losses | Net gain/loss | Seats % | Votes % | Votes | +/− | |
---|---|---|---|---|---|---|---|---|---|
Conservative | 46 | +6 | 65.71 | 43.17 | 192,328 | ||||
Liberal Democrat | 17 | -2 | 24.29 | 32.72 | 145,767 | ||||
Labour | 7 | -4 | 10.00 | 17.76 | 79,139 | ||||
UKIP | 0 | 0.00 | 2.98 | 13,283 | |||||
Green | 0 | 0.00 | 2.28 | 10,145 | |||||
Independent | 0 | -1 | 0.00 | 0.84 | 3,761 | ||||
BNP | 0 | 0.00 | 0.20 | 888 | |||||
Monster Raving Loony | 0 | 0.00 | 0.04 | 192 |
Party | Candidate | Votes | % | ± | |
---|---|---|---|---|---|
Conservative | Mr P A Graysmark | 1,674 | 36.9 | ||
Labour Co-op | Mr A P Bray | 1,315 | 29.0 | ||
Liberal Democrat | Mrs J Goldsbrough-Jones | 1,065 | 23.5 | ||
UKIP | Mr M C Henn | 256 | 5.6 | ||
Green | Mr V Tilsley | 227 | 5.0 | ||
Majority | 359 | 7.9 | |||
Turnout | 4,537 | 61.9 |
Party | Candidate | Votes | % | ± | |
---|---|---|---|---|---|
Conservative | Mr C R Albury | 2,201 | 37.4 | ||
Liberal Democrat | Mr R T Burt | 1,799 | 30.6 | ||
Labour | Mr K G Bashford | 1,470 | 25.0 | ||
UKIP | Mr L W Parsons | 413 | 7.0 | ||
Majority | 731 | 6.8 | |||
Turnout | 5,883 | 59.5 |
Party | Candidate | Votes | % | ± | |
---|---|---|---|---|---|
Conservative | Mr R B Dunn | 2,106 | 43.3 | ||
Liberal Democrat | Ms D G Martin | 1,377 | 28.3 | ||
Labour Co-op | Mr D J Yates | 1,155 | 23.7 | ||
UKIP | Mr D M Pledge | 227 | 4.7 | ||
Majority | 729 | 15.0 | |||
Turnout | 4,865 | 63.4 |
Party | Candidate | Votes | % | ± | |
---|---|---|---|---|---|
Conservative | Mr C R Williams | 2,359 | 47.1 | ||
Liberal Democrat | Mr A C Stuart | 1,055 | 21.1 | ||
Labour Co-op | Mr N R Sweet | 965 | 19.3 | ||
Green | Ms M A Martin | 430 | 8.6 | ||
UKIP | Mr P R Drayton-Morris | 202 | 4.0 | ||
Majority | 1,304 | 26.0 | |||
Turnout | 5,011 | 70.0 |
Party | Candidate | Votes | % | ± | |
---|---|---|---|---|---|
Conservative | Mrs V M Woolhead | 1,635 | 40.0 | ||
Liberal Democrat | Mr S H Martin | 1,230 | 30.1 | ||
Labour | Mr P Berry | 1,226 | 30.0 | ||
Majority | 405 | 9.9 | |||
Turnout | 4,091 | 61.1 |
Party | Candidate | Votes | % | ± | |
---|---|---|---|---|---|
Conservative | Mr K G Eade | 1,966 | 40.1 | ||
Labour Co-op | Ms A Lowe | 1,423 | 29.0 | ||
Liberal Democrat | Mr A J Mortimer | 959 | 19.5 | ||
UKIP | Ms J C Greig | 317 | 6.5 | ||
Green | Ms S E Board | 243 | 5.0 | ||
Majority | 543 | 11.1 | |||
Turnout | 4,908 | 64.0 |
Party | Candidate | Votes | % | ± | |
---|---|---|---|---|---|
Conservative | Mr O V Wingrove | 2,454 | 50.2 | ||
Liberal Democrat | Mr T J Richards | 1,847 | 37.8 | ||
UKIP | Mr P Russo | 588 | 12.0 | ||
Majority | 607 | 12.4 | |||
Turnout | 4,889 | 66.8 |
Party | Candidate | Votes | % | ± | |
---|---|---|---|---|---|
Conservative | Mr D N Britton | 1,723 | 37.5 | ||
Liberal Democrat | Mr D E Leggatt | 1,254 | 27.3 | ||
Labour | Mr D F Dyball | 1,206 | 26.3 | ||
UKIP | Mr H F Whitaker | 411 | 8.9 | ||
Majority | 469 | 10.2 | |||
Turnout | 4,594 | 64.9 |
Party | Candidate | Votes | % | ± | |
---|---|---|---|---|---|
Liberal Democrat | Mr S E McDougall | 1,684 | 30.4 | ||
Labour | Mr S Holland | 1,661 | 30.0 | ||
Conservative | Mr B W Widger | 1,600 | 28.9 | ||
UKIP | Mr J R W Spencer | 598 | 10.8 | ||
Majority | 23 | 0.4 | |||
Turnout | 5,543 | 58.9 |
Party | Candidate | Votes | % | ± | |
---|---|---|---|---|---|
Liberal Democrat | Mr F R J Oppler | 1,331 | 32.0 | ||
Labour | Mr M G Jones | 1,228 | 29.5 | ||
Conservative | Mr D M Machonachie | 1,206 | 29.0 | ||
UKIP | Mr A Otton | 398 | 9.6 | ||
Majority | 103 | 2.5 | |||
Turnout | 4,163 | 55.2 |
Party | Candidate | Votes | % | ± | |
---|---|---|---|---|---|
Conservative | Mr R B Brown | 2,171 | 46.1 | ||
Liberal Democrat | Mr B Dodd | 1,860 | 39.5 | ||
UKIP | Mr I A Fraser | 679 | 14.4 | ||
Majority | 311 | 6.6 | |||
Turnout | 4,710 | 61.9 |
Party | Candidate | Votes | % | ± | |
---|---|---|---|---|---|
Conservative | Mr P C Evans | 3,781 | 57.2 | ||
Liberal Democrat | Mr J M Richards | 1,464 | 22.2 | ||
Labour | Mr H E Miller | 1,015 | 15.4 | ||
UKIP | Mr P V Skinner | 348 | 5.3 | ||
Majority | 2,317 | 35.0 | |||
Turnout | 6,608 | 69.8 |
Party | Candidate | Votes | % | ± | |
---|---|---|---|---|---|
Conservative | Mr G G Blampied | 2,371 | 45.2 | ||
Liberal Democrat | Mr M J Harvey | 1,663 | 31.7 | ||
Labour | Mr J B Cosgrove | 727 | 13.9 | ||
UKIP | Mr A J Richardson | 482 | 9.2 | ||
Majority | 708 | 13.5 | |||
Turnout | 5,243 | 68.5 |
Party | Candidate | Votes | % | ± | |
---|---|---|---|---|---|
Conservative | Mr D R Whittington | 2,775 | 49.9 | ||
Liberal Democrat | Mr I S Menzies | 2,055 | 37.0 | ||
UKIP | Mr J Dunning | 728 | 13.1 | ||
Majority | 720 | 12.9 | |||
Turnout | 5,558 | 65.5 |
Party | Candidate | Votes | % | ± | |
---|---|---|---|---|---|
Liberal Democrat | Dr J M M Walsh | 2,132 | 37.1 | ||
Conservative | Mr G M Tyler | 1,837 | 32.0 | ||
Labour | Mr M J Thomson | 1,246 | 21.7 | ||
UKIP | Mr R H East | 524 | 9.1 | ||
Majority | 295 | 5.1 | |||
Turnout | 5,739 | 62.3 |
Party | Candidate | Votes | % | ± | |
---|---|---|---|---|---|
Labour | Mr G K O’Neill | 1,399 | 37.1 | ||
Conservative | Mr A W Gammon | 1,016 | 26.9 | ||
Liberal Democrat | Mr D M Jones | 903 | 24.0 | ||
UKIP | Ms M E Lees | 452 | 12.0 | ||
Majority | 383 | 10.2 | |||
Turnout | 3,770 | 53.5 |
Party | Candidate | Votes | % | ± | |
---|---|---|---|---|---|
Conservative | Mrs C A Freeman | 2,528 | 49.0 | ||
Liberal Democrat | Ms R A Kissell | 1,181 | 22.9 | ||
Labour | Mr S B McConnell | 989 | 19.2 | ||
UKIP | Mr A C Sutcliffe | 459 | 8.9 | ||
Majority | 1,347 | 26.1 | |||
Turnout | 5,157 | 63.6 |
Party | Candidate | Votes | % | ± | |
---|---|---|---|---|---|
Conservative | Mr M W G Coleman | 3,263 | 47.7 | ||
Labour | Ms P P Nash | 1,468 | 21.5 | ||
Liberal Democrat | Mr G C Burt | 1,450 | 21.2 | ||
UKIP | Mr S D Porter | 649 | 9.5 | ||
Majority | 1,795 | 26.2 | |||
Turnout | 6,830 | 68.1 |
Party | Candidate | Votes | % | ± | |
---|---|---|---|---|---|
Conservative | Mr P T Moor | 2,817 | 46.1 | ||
Liberal Democrat | Mr A S D Lauretani | 1,971 | 32.3 | ||
Labour | Mr A J Dines | 904 | 14.8 | ||
UKIP | Ms J A Penn | 413 | 6.8 | ||
Majority | 846 | 13.8 | |||
Turnout | 6,105 | 68.0 |
Party | Candidate | Votes | % | ± | |
---|---|---|---|---|---|
Conservative | Mr T M E Dunn | 2,377 | 40.5 | ||
Liberal Democrat | Mr R A Gowlett | 1,922 | 32.8 | ||
Labour | Mr J Baker | 841 | 14.3 | ||
Independent | Mrs C H Phillips | 375 | 6.4 | ||
UKIP | Mrs A R Denny | 347 | 5.9 | ||
Majority | 455 | 7.7 | |||
Turnout | 5,862 | 65.6 |
Party | Candidate | Votes | % | ± | |
---|---|---|---|---|---|
Liberal Democrat | Mr A R H Smith | 2,191 | 40.8 | ||
Conservative | Mr S I King | 1,765 | 32.9 | ||
Labour | Mr B Earnshaw-Mansell | 1,047 | 19.5 | ||
UKIP | Mr A S Preater-Cole | 368 | 6.9 | ||
Majority | 426 | 7.9 | |||
Turnout | 5,371 | 59.2 |
Party | Candidate | Votes | % | ± | |
---|---|---|---|---|---|
Liberal Democrat | Mr M N Hall | 2,628 | 48.7 | ||
Conservative | Mrs H A Flynn | 1,884 | 34.9 | ||
Labour | Mr D Morrison | 593 | 11.0 | ||
UKIP | Mr M A H Mason | 290 | 5.4 | ||
Majority | 744 | 13.8 | |||
Turnout | 5,395 | 68.4 |
Party | Candidate | Votes | % | ± | |
---|---|---|---|---|---|
Liberal Democrat | Mr A D Chaplin | 2,244 | 40.5 | ||
Conservative | Mr A P Dignum | 2,034 | 36.7 | ||
Labour | Mr M J Few | 891 | 16.1 | ||
UKIP | Mr N D W Sitwell | 374 | 6.7 | ||
Majority | 210 | 3.8 | |||
Turnout | 5,543 | 65.3 |
Party | Candidate | Votes | % | ± | |
---|---|---|---|---|---|
Conservative | Ms M L Goldsmith | 2,446 | 39.4 | ||
Liberal Democrat | Mr J R Campling | 2,051 | 33.0 | ||
Labour | Mr R J Hastings | 875 | 14.1 | ||
UKIP | Mr J McCulloch | 367 | 5.9 | ||
Independent | Mr A J Phillips | 268 | 4.3 | ||
Independent | Mr R I Apel | 202 | 3.3 | ||
Majority | 395 | 6.4 | |||
Turnout | 6,209 | 68.9 |
Party | Candidate | Votes | % | ± | |
---|---|---|---|---|---|
Conservative | Lt Con T Pemberton | 3,022 | 52.3 | ||
Liberal Democrat | Mr K V Rowsell | 1,848 | 32.0 | ||
Labour | Mr B R D Hollowood | 616 | 10.7 | ||
UKIP | Mr D E Denny | 295 | 5.1 | ||
Majority | 1,174 | 20.3 | |||
Turnout | 5,781 | 70.5 |
Party | Candidate | Votes | % | ± | |
---|---|---|---|---|---|
Conservative | Ms N J Hendon | 2,222 | 38.5 | ||
Independent | Mr A M Shaxson | 1,653 | 28.7 | ||
Liberal Democrat | Ms J R Fowler | 1,612 | 28.0 | ||
UKIP | Mr P J Cole | 280 | 4.9 | ||
Majority | 569 | 9.8 | |||
Turnout | 5,767 | 68.1 |
Party | Candidate | Votes | % | ± | |
---|---|---|---|---|---|
Conservative | Mr P W J Moffatt | 3,524 | 54.2 | ||
Liberal Democrat | Mr R Cooper | 1,968 | 30.3 | ||
Labour | Ms J Miller | 651 | 10.0 | ||
UKIP | Ms V A Moran | 354 | 5.4 | ||
Majority | 1,556 | 23.9 | |||
Turnout | 6,497 | 69.7 |
Party | Candidate | Votes | % | ± | |
---|---|---|---|---|---|
Conservative | Mr P E Jones | 2,155 | 40.2 | ||
Liberal Democrat | Mr J E Shade | 1,386 | 25.9 | ||
Labour | Ms M M Lawson | 1,214 | 22.6 | ||
UKIP | Mr B A Smith | 605 | 11.3 | ||
Majority | 769 | 14.3 | |||
Turnout | 5,360 | 64.6 |
Party | Candidate | Votes | % | ± | |
---|---|---|---|---|---|
Conservative | Mr J M Daws-Chew | 2,339 | 45.3 | ||
Liberal Democrat | Mr A G Wells | 993 | 19.2 | ||
Independent | Mr R J Norris | 755 | 14.6 | ||
Labour | Mr P J O’Sullivan | 632 | 12.2 | ||
UKIP | Mr R L Wilson | 450 | 8.7 | ||
Majority | 1,346 | 26.1 | |||
Turnout | 5,169 | 66.3 |
Party | Candidate | Votes | % | ± | |
---|---|---|---|---|---|
Labour | Mr C J Mullins | 3,674 | 23.8 | ||
Labour | Mrs J C Sully | 2,856 | 18.5 | ||
Conservative | Mr B K Blake | 2,763 | 17.9 | ||
Conservative | Mr H S Bloom | 2,707 | 17.6 | ||
Liberal Democrat | Mr J C Bonner | 1,526 | 9.9 | ||
Liberal Democrat | Mr D C Wise | 1,142 | 7.4 | ||
Green | Rev M D Liles | 747 | 4.8 | ||
Turnout | 15,415 | 54.8 |
Party | Candidate | Votes | % | ± | |
---|---|---|---|---|---|
Labour | Mr J McGough | 1,861 | 45.5 | ||
Conservative | Mr M T Head | 1,291 | 31.6 | ||
Liberal Democrat | Mr M R Scott | 723 | 17.7 | ||
UKIP | Mr D A Hardman | 212 | 5.2 | ||
Majority | 570 | 13.9 | |||
Turnout | 4,087 | 49.2 |
Party | Candidate | Votes | % | ± | |
---|---|---|---|---|---|
Labour | Mr J Mortimer | 3,906 | 25.5 | ||
Labour | Mr J G T Smith | 3,173 | 20.7 | ||
Conservative | Mr J I Denman | 2,295 | 15.0 | ||
Conservative | Mr C J Skinner | 2,075 | 13.6 | ||
Liberal Democrat | Mr B J Hamilton | 1,411 | 9.2 | ||
Liberal Democrat | Mr K J R Osborne | 1,175 | 7.7 | ||
BNP | Mr G W Baldwin | 673 | 4.4 | ||
Green | Mr A S D Graham | 586 | 3.8 | ||
Turnout | 15,294 | 55.7 |
Party | Candidate | Votes | % | ± | |
---|---|---|---|---|---|
Labour | Ms G D Joyce | 1,719 | 36.8 | ||
Conservative | Ms B J Burgess | 1,546 | 33.1 | ||
Liberal Democrat | Mr D J Barry | 1,049 | 22.5 | ||
BNP | Mr R N Grice | 215 | 4.6 | ||
Green | Mrs M F Liles | 143 | 3.1 | ||
Majority | 173 | 3.7 | |||
Turnout | 4,672 | 60.1 |
Party | Candidate | Votes | % | ± | |
---|---|---|---|---|---|
Conservative | Mr H E M Smith | 5,532 | 29.1 | ||
Conservative | Mr D G Dewdney | 4,804 | 25.3 | ||
Labour | Ms J Skudder | 2,307 | 12.1 | ||
Labour | Mr E M Sully | 2,218 | 11.7 | ||
Liberal Democrat | Mr E Reay | 1,853 | 9.7 | ||
Liberal Democrat | Mr P S Bannister | 1,528 | 8.0 | ||
Green | Mr B T A Liles | 782 | 4.1 | ||
Turnout | 19,024 | 63.4 |
Party | Candidate | Votes | % | ± | |
---|---|---|---|---|---|
Conservative | Mr D G Crow | 2,302 | 40.6 | ||
Labour | Mr W A Ward | 2,127 | 37.5 | ||
Liberal Democrat | Mr R J McMurray | 963 | 17.0 | ||
Green | Ms V Dore | 283 | 5.0 | ||
Majority | 175 | 3.1 | |||
Turnout | 5,675 | 63.5 |
Party | Candidate | Votes | % | ± | |
---|---|---|---|---|---|
Conservative | Mr O J Davies | 2,950 | 50.6 | ||
Liberal Democrat | Mr G F H Lawes | 2,078 | 35.7 | ||
Labour | Ms S Morton | 797 | 13.7 | ||
Majority | 872 | 14.9 | |||
Turnout | 5,825 | 66.5 |
Party | Candidate | Votes | % | ± | |
---|---|---|---|---|---|
Liberal Democrat | Mr D R Deedman | 3,056 | 48.8 | ||
Conservative | Mr A N Whall | 2,473 | 39.5 | ||
Labour | Mr P Hilditch | 737 | 11.8 | ||
Majority | 583 | 9.3 | |||
Turnout | 6,266 | 70.4 |
Party | Candidate | Votes | % | ± | |
---|---|---|---|---|---|
Conservative | Mr L H Barnard | 3,381 | 61.8 | ||
Liberal Democrat | Mr F W S Taylor | 2,086 | 38.2 | ||
Majority | 1,295 | 23.6 | |||
Turnout | 5,467 | 67.7 |
Party | Candidate | Votes | % | ± | |
---|---|---|---|---|---|
Conservative | Mr P C Catchpole | 2,546 | 44.4 | ||
Liberal Democrat | Mr L J C Crosbie | 2,374 | 41.4 | ||
Labour | Mr R E Chapman | 815 | 14.2 | ||
Majority | 172 | 3.0 | |||
Turnout | 5,734 | 68.7 |
Party | Candidate | Votes | % | ± | |
---|---|---|---|---|---|
Liberal Democrat | Dr N P S Dennis | 3,018 | 51.6 | ||
Conservative | Ms E A Ostacchini | 2,013 | 34.4 | ||
Labour | Ms K J Goddard | 815 | 13.9 | ||
Majority | 1,005 | 17.2 | |||
Turnout | 5,846 | 67.9 |
Party | Candidate | Votes | % | ± | |
---|---|---|---|---|---|
Liberal Democrat | Mrs M E Millson | 3,015 | 52.0 | ||
Conservative | Mr N R M Lowson | 1,915 | 33.0 | ||
Labour | Mr J D Thomas | 873 | 15.0 | ||
Majority | 1,100 | 19.0 | |||
Turnout | 5,803 | 67.3 |
Party | Candidate | Votes | % | ± | |
---|---|---|---|---|---|
Conservative | Mrs P A C Arculus | 3,826 | 63.7 | ||
Liberal Democrat | Mr D B C Wright | 2,177 | 36.3 | ||
Majority | 1,649 | 27.4 | |||
Turnout | 6,003 | 68.2 |
Party | Candidate | Votes | % | ± | |
---|---|---|---|---|---|
Liberal Democrat | Mr W J Hellawell | 2,751 | 45.5 | ||
Conservative | Mr J W Charles | 2,347 | 38.8 | ||
Labour | Mr R M Wilson | 946 | 15.7 | ||
Majority | 404 | 6.7 | |||
Turnout | 6,044 | 64.3 |
Party | Candidate | Votes | % | ± | |
---|---|---|---|---|---|
Conservative | Mr B R A D Watson | 3,057 | 48.4 | ||
Liberal Democrat | Mr P J Stainton | 2,608 | 41.3 | ||
Labour | Mr T C Parker | 646 | 10.2 | ||
Majority | 449 | 7.1 | |||
Turnout | 6,311 | 69.0 |
Party | Candidate | Votes | % | ± | |
---|---|---|---|---|---|
Conservative | Mr F T Wilkinson | 3,767 | 58.8 | ||
Liberal Democrat | Mr A G Hughes | 1,619 | 25.3 | ||
Labour | Ms P J Banks | 1,020 | 15.9 | ||
Majority | 2,148 | 33.5 | |||
Turnout | 6,406 | 70.1 |
Party | Candidate | Votes | % | ± | |
---|---|---|---|---|---|
Conservative | Mr M P S Hodgson | 3,217 | 56.5 | ||
Liberal Democrat | Mr T H Pearce | 1,645 | 28.9 | ||
Labour | Ms J A Battersby | 832 | 14.6 | ||
Majority | 1,572 | 27.6 | |||
Turnout | 5,694 | 67.3 |
Party | Candidate | Votes | % | ± | |
---|---|---|---|---|---|
Liberal Democrat | Mrs S Knight | 4,940 | 22.4 | ||
Conservative | Mr A J Barrett-Miles | 4,677 | 21.2 | ||
Liberal Democrat | Mrs J M Henwood | 4,627 | 20.9 | ||
Conservative | Mrs J A Landriani | 4,445 | 20.1 | ||
Labour | Mr I Renshaw | 1,495 | 6.8 | ||
Labour | Mr A L West | 977 | 4.4 | ||
Green | Mrs M J McGregor | 930 | 4.2 | ||
Turnout | 22,091 | 67.9 |
Party | Candidate | Votes | % | ± | |
---|---|---|---|---|---|
Conservative | Mrs A M Morris | 2,633 | 53.0 | ||
Liberal Democrat | Mrs I Balls | 1,556 | 31.3 | ||
Labour | Mr D W Davies | 423 | 8.5 | ||
Green | Mr P B Wemyss-Gorman | 354 | 7.1 | ||
Majority | 1,077 | 21.7 | |||
Turnout | 4,966 | 72.8 |
Party | Candidate | Votes | % | ± | |
---|---|---|---|---|---|
Liberal Democrat | Mrs M E Collins | 4,802 | 23.8 | ||
Conservative | Mrs M M Ball | 4,680 | 23.2 | ||
Conservative | Mr A G Bass | 4,449 | 22.0 | ||
Liberal Democrat | Mr A N Brock | 4,138 | 20.5 | ||
Labour | Mr S D Fallowell | 1,257 | 6.2 | ||
Labour | Mr D A Irvine | 875 | 4.3 | ||
Turnout | 20,201 | 66.6 |
Party | Candidate | Votes | % | ± | |
---|---|---|---|---|---|
Liberal Democrat | Dr C E Wilsdon | 2,818 | 42.9 | ||
Conservative | Mr S K J Bell | 2,632 | 40.1 | ||
Labour | Mrs A P Piercy | 697 | 10.6 | ||
Green | Mr D M Hammond | 423 | 6.4 | ||
Majority | 186 | 2.8 | |||
Turnout | 6,570 | 69.9 |
Party | Candidate | Votes | % | ± | |
---|---|---|---|---|---|
Conservative | Mr A J De-Mierre | 1,779 | 36.3 | ||
Liberal Democrat | Ms J Brown | 1,615 | 33.0 | ||
Labour | Mr P J Henry | 1,504 | 30.7 | ||
Majority | 164 | 3.3 | |||
Turnout | 4,898 | 67.6 |
Party | Candidate | Votes | % | ± | |
---|---|---|---|---|---|
Liberal Democrat | Mr B Hall | 2,096 | 39.4 | ||
Conservative | Mrs M N Baker | 2,052 | 38.6 | ||
Labour | Mr R Goddard | 846 | 15.9 | ||
Green | Mr P P Smith | 324 | 6.1 | ||
Majority | 44 | 0.8 | |||
Turnout | 5,318 | 70.0 |
Party | Candidate | Votes | % | ± | |
---|---|---|---|---|---|
Conservative | Mr P A D Griffiths | 2,816 | 53.8 | ||
Liberal Democrat | Mr N C S Cook | 1,479 | 28.3 | ||
Labour | Mr M P Uhlhorn | 745 | 14.2 | ||
Monster Raving Loony | Mr P B Berry | 192 | 3.7 | ||
Majority | 1,337 | 25.5 | |||
Turnout | 5,232 | 70.7 |
Party | Candidate | Votes | % | ± | |
---|---|---|---|---|---|
Conservative | Mr P A C Coote | 2,533 | 48.5 | ||
Liberal Democrat | Mr E A Matthews | 1,312 | 25.1 | ||
Green | Ms C W Edminson | 805 | 15.4 | ||
Labour | Mr M Briggs | 578 | 11.1 | ||
Majority | 1,221 | 23.4 | |||
Turnout | 5,228 | 71.9 |
Party | Candidate | Votes | % | ± | |
---|---|---|---|---|---|
Conservative | Mrs M D Johnson | 3,586 | 52.0 | ||
Liberal Democrat | Ms A Lucraft | 2,045 | 29.7 | ||
Green | Mr P E M Brown | 646 | 9.4 | ||
Labour | Mr J M Crawford | 613 | 8.9 | ||
Majority | 1,514 | 22.3 | |||
Turnout | 6,890 | 73.5 |
Party | Candidate | Votes | % | ± | |
---|---|---|---|---|---|
Conservative | Mr W E Acraman | 3,208 | 53.4 | ||
Liberal Democrat | Mr G E Knight | 1,327 | 22.1 | ||
Labour | Mr R M Burgess | 1,025 | 17.0 | ||
Green | Mr M B Weller | 452 | 7.5 | ||
Majority | 1,881 | 31.3 | |||
Turnout | 6,012 | 68.5 |
Party | Candidate | Votes | % | ± | |
---|---|---|---|---|---|
Liberal Democrat | Mr P E Green | 5,012 | 24.0 | ||
Liberal Democrat | Mr D R M Lissenburg | 4,238 | 20.3 | ||
Conservative | Mrs M F Lermitte | 3,452 | 16.5 | ||
Conservative | Mr J L Rogers | 3,413 | 16.4 | ||
Labour | Mr J S Gardiner | 1,736 | 8.3 | ||
Labour | Mr J M Turley | 1,465 | 7.0 | ||
Green | Ms M Hillcoat | 1,117 | 5.4 | ||
Independent | Mr I D Sandell | 426 | 2.0 | ||
Turnout | 20,859 | 58.4 |
Party | Candidate | Votes | % | ± | |
---|---|---|---|---|---|
Conservative | Mr K C R Mercer | 4,024 | 21.5 | ||
Conservative | Mr S G Waight | 3,766 | 20.2 | ||
Liberal Democrat | Mr N C Rodgers | 3,279 | 17.6 | ||
Liberal Democrat | Mr R T Rogers | 3,078 | 16.5 | ||
Labour | Mr A Bignell | 1,384 | 7.4 | ||
Labour | Mr N T Duffy | 1,302 | 7.0 | ||
Green | Mr A M Stace | 698 | 3.7 | ||
UKIP | Mr R G Bater | 628 | 3.4 | ||
UKIP | Mr C M Woodward | 515 | 2.8 | ||
Turnout | 18,674 | 61.0 |
Party | Candidate | Votes | % | ± | |
---|---|---|---|---|---|
Conservative | Mr C A O’Neill | 5,265 | 28.1 | ||
Conservative | Mr C H Stevens | 5,061 | 27.0 | ||
Liberal Democrat | Mr M D Donin | 3,404 | 18.2 | ||
Liberal Democrat | Mr K D R Sunderland | 3,191 | 17.0 | ||
Labour | Ms H Rennie | 1,797 | 9.6 | ||
Turnout | 18,718 | 62.7 |
Party | Candidate | Votes | % | ± | |
---|---|---|---|---|---|
Liberal Democrat | Mrs I C Richards | 1,866 | 41.9 | ||
Conservative | Mr M Saheid | 1,764 | 39.6 | ||
Labour | Ms A Saunders | 828 | 18.6 | ||
Majority | 102 | 2.3 | |||
Turnout | 4,458 | 57.5 |
Party | Candidate | Votes | % | ± | |
---|---|---|---|---|---|
Conservative | Mr C B Roberts | 1,678 | 40.4 | ||
Liberal Democrat | Ms C B Brown | 1,434 | 34.5 | ||
Labour | Mr P H Barnes | 694 | 16.7 | ||
Green | Mr D H Colkett | 351 | 8.4 | ||
Majority | 244 | 5.9 | |||
Turnout | 4,157 | 52.5 |
Party | Candidate | Votes | % | ± | |
---|---|---|---|---|---|
Conservative | Mr J Livermore | 2,357 | 45.22 | ||
Liberal Democrat | Mr A S Rice | 1,295 | 24.8 | ||
Labour | Mr B F Slater | 820 | 15.7 | ||
Green | Mrs L Colkett | 392 | 7.5 | ||
UKIP | Mr P A Ruddock | 266 | 5.1 | ||
Independent | Mr J D Robers | 82 | 1.6 | ||
Majority | 1,062 | 20.4 | |||
Turnout | 5,212 | 60.5 |
West Sussex County Council in England is elected every four years.
East Sussex County Council is the local authority for the non-metropolitan county of East Sussex.
The West Sussex County Council election, 2009 were elections to West Sussex County Council which took place on 4 June 2009, having been delayed from 7 May, in order to coincide with elections to the European Parliament.
Angmering & Findon is an electoral division of West Sussex in the United Kingdom and returns one member to sit on West Sussex County Council. The current County Councillor, Deborah Urquhart, is also Cabinet Member for Environment & Economy.
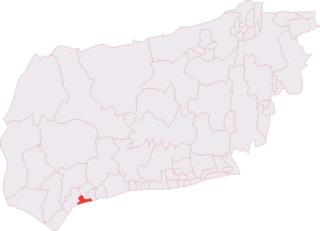
Bognor Regis West & Aldwick is an electoral division of West Sussex in the United Kingdom and returns one member to sit on West Sussex County Council.
Bourne is an electoral division of West Sussex in the United Kingdom, and returns one member to sit on West Sussex County Council. The former County Councillor, Mark Dunn, was also Chairman of West Sussex County Council. He lost his seat in 2013 to Sandra James of the United Kingdom Independence Party.
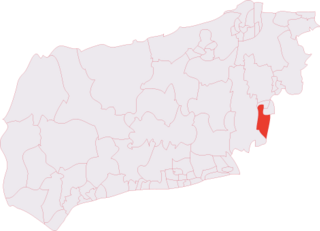
Hassocks & Victoria was an electoral division of West Sussex in the United Kingdom, and returned one member to sit on West Sussex County Council from 1997 to 2017. In 2017 it was replaced by a new division, Hassocks & Burgess Hill South.
Haywards Heath East is an electoral division of West Sussex in the United Kingdom, and returns one member to sit on West Sussex County Council.
Henfield is an electoral division of West Sussex in the United Kingdom and returns one member to sit on West Sussex County Council. The current County Councillor, Lionel Barnard, is also Deputy Leader of West Sussex County Council.
Holbrook is an electoral division of West Sussex in the United Kingdom and returns one member to sit on West Sussex County Council. The current County Councillor, Peter Catchpole, is also Cabinet Member for Adults' Services.
Hurstpierpoint & Bolney is an electoral division of West Sussex in the United Kingdom, and returns one member to sit on West Sussex County Council.
Imberdown is an electoral division of West Sussex in the United Kingdom, and returns one member to sit on West Sussex County Council.
Lindfield & High Weald is an electoral division of West Sussex in the United Kingdom, and returns one member to sit on West Sussex County Council.
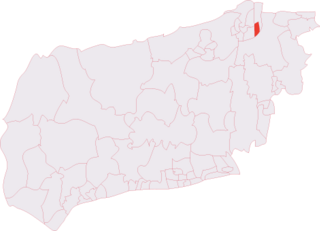
Maidenbower is an electoral division of West Sussex in the United Kingdom, and returns one member to sit on West Sussex County Council. The current County Councillor, is Robert Lanzer who won the seat in a by-election after the resignation of the former Leader of West Sussex County Council Henry Smith upon being elected as Member of Parliament for Crawley.
Pulborough is an electoral division of West Sussex in the United Kingdom and returns one member to sit on West Sussex County Council. The current County Councillor, Pat Arculus, is also Cabinet Member for Children and Young People's Services.
Storrington is an electoral division of West Sussex in the United Kingdom and returns one member to West Sussex County Council.
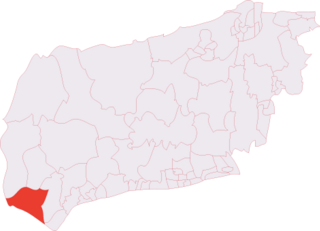
The Witterings is an electoral division of West Sussex in the United Kingdom, and returns one member to sit on West Sussex County Council.
Warnham & Rusper is an electoral division of West Sussex in the United Kingdom and returns one member to sit on West Sussex County Council. The current County Councillor, Mick Hodgson, is also Vice-Chairman of West Sussex County Council.
Worth Forest is an electoral division of West Sussex in the United Kingdom, and returns one member to sit on West Sussex County Council.
Elections to West Sussex County Council were held on 7 June 2001, alongside a parliamentary general election. The whole council was up for election, and the Conservative Party remained in control of the council. Turnout across the county ranged from 42.7% in Broadfield to 69.6% in Midhurst, with the county average standing at 60.8%.