The topic of this article may not meet Wikipedia's general notability guideline .(April 2023) |
This article has multiple issues. Please help improve it or discuss these issues on the talk page . (Learn how and when to remove these template messages)
|
Elections to Runnymede Borough Council were held on 3 May 1979, alongside both other UK local elections and the general election of that year. One third of the council was up for election and the Conservative party retained overall control of the council, gaining a seat from the Liberals.
After the election, the composition of the council was
Runnymede Borough Council Election 1979 | ||||||||||
---|---|---|---|---|---|---|---|---|---|---|
Party | This election | Full council | This election | |||||||
Seats | Net | Seats % | Other | Total | Total % | Votes | Votes % | +/− | ||
Conservative | 12 | 1 | 80.0 | 19 | 31 | 73.8 | 20,437 | 49.2 | -9.5% | |
Labour | 2 | 0 | 13.3 | 5 | 7 | 16.7 | 9,935 | 23.9 | +1.4% | |
Residents | 1 | 0 | 6.7 | 2 | 3 | 7.1 | 1,718 | 4.1 | -0.2% | |
Liberal | 0 | 1 | 0 | 1 | 1 | 2.4 | 8,902 | 21.4 | +6.9% | |
Independent | 0 | 0 | 0 | 0 | 0 | 0.0 | 580 | 1.4 | New |
Party | Candidate | Votes | % | ±% | |
---|---|---|---|---|---|
Conservative | G. Morley | 1,269 | 44.2 | -3.1 | |
Conservative | A. Read | 1,252 | |||
Labour | S. O'Byrne | 1,073 | 37.4 | -1.4 | |
Labour | G. Honeyball | 944 | |||
Liberal | M. Beal | 526 | 18.3 | +4.4 | |
Liberal | H. Fotheringham | 473 | |||
Majority | 196 | 6.8 | |||
Turnout | 74.4 | +35.1 | |||
Conservative hold | Swing | -0.9 | |||
Party | Candidate | Votes | % | ±% | |
---|---|---|---|---|---|
Conservative | R. Taylor | 1,390 | 50.8 | -6.0 | |
Labour | C. Watts | 782 | 28.6 | +0.9 | |
Liberal | Geoffrey Pyle | 563 | 20.6 | +5.2 | |
Majority | 608 | 22.2 | |||
Turnout | 2,735 | 75.4 | +34.5 | ||
Conservative hold | Swing | -3.4 | |||
Party | Candidate | Votes | % | ±% | |
---|---|---|---|---|---|
Conservative | A. Strike | 1,613 | 51.2 | -8.3 | |
Liberal | K. Lloyd | 827 | 26.2 | +5.8 | |
Labour | A. Anderson | 711 | 22.6 | +2.4 | |
Majority | 786 | 24.9 | |||
Turnout | 3,151 | 77.6 | +36.2 | ||
Conservative gain from Liberal | Swing | -7.1 | |||
Party | Candidate | Votes | % | ±% | |
---|---|---|---|---|---|
Conservative | G. Paris | 1,976 | 55.4 | -13.7 | |
Labour | J. Capper | 1,014 | 28.4 | New | |
Liberal | I. Geary | 578 | 16.2 | -15.7 | |
Majority | 962 | 27.0 | |||
Turnout | 3,568 | 74.0 | +38.8 | ||
Conservative hold | Swing | -21.1 | |||
Party | Candidate | Votes | % | ±% | |
---|---|---|---|---|---|
Labour | D. Hughes | 1,006 | 41.5 | -3.7 | |
Conservative | P. Jones | 883 | 36.4 | +4.8 | |
Liberal | J. Elfer | 535 | 22.1 | -1.1 | |
Majority | 123 | 5.1 | |||
Turnout | 2,424 | 71.3 | +36.1 | ||
Labour hold | Swing | -4.3 | |||
Party | Candidate | Votes | % | ±% | |
---|---|---|---|---|---|
Conservative | B. Tomlinson | 1,752 | 56.1 | -19.3 | |
Labour | N. Williams | 726 | 23.2 | -1.4 | |
Liberal | N. Stuart | 646 | 20.7 | New | |
Majority | 1,026 | 32.8 | |||
Turnout | 3,124 | 71.8 | +33.7 | ||
Conservative hold | Swing | -9.0 | |||
Party | Candidate | Votes | % | ±% | |
---|---|---|---|---|---|
Conservative | C. Clarke | 1,359 | 65.0 | -14.8 | |
Liberal | T. Palm | 438 | 20.9 | New | |
Labour | J. Purbrick | 295 | 14.1 | -6.1 | |
Majority | 921 | 44.0 | |||
Turnout | 2,092 | 66.5 | +32.0 | ||
Conservative hold | Swing | -17.9 | |||
Party | Candidate | Votes | % | ±% | |
---|---|---|---|---|---|
Conservative | S. Pert | 946 | 40.8 | -17.7 | |
Labour | M. Smith | 766 | 33.1 | -8.4 | |
Liberal | S. Thatcher | 605 | 26.1 | New | |
Majority | 180 | 7.8 | |||
Turnout | 2,317 | 71.3 | +34.0 | ||
Conservative hold | Swing | -4.6 | |||
Party | Candidate | Votes | % | ±% | |
---|---|---|---|---|---|
Conservative | D. Clarke | 1,434 | 59.1 | -12.6 | |
Liberal | C. Boyde | 642 | 26.5 | -1.8 | |
Labour | C. Matthews | 349 | 14.4 | New | |
Majority | 792 | 32.7 | |||
Turnout | 2,425 | 72.9 | +41.1 | ||
Conservative hold | Swing | -5.4 | |||
Party | Candidate | Votes | % | ±% | |
---|---|---|---|---|---|
Labour | E. Austin | 1,684 | 48.9 | -5.6 | |
Conservative | D. Dormer | 792 | 39.8 | -5.7 | |
Liberal | W. Burnip | 605 | 11.3 | New | |
Majority | 315 | 9.2 | |||
Turnout | 3,441 | 72.5 | +48.0 | ||
Labour hold | Swing | -5.5 | |||
Party | Candidate | Votes | % | ±% | |
---|---|---|---|---|---|
Conservative | G. Skipper | 1,293 | 45.2 | +1.6 | |
Liberal | K. Norris | 1,182 | 41.3 | -3.3 | |
Labour | R. Dove | 388 | 13.6 | +1.7 | |
Majority | 111 | 3.9 | |||
Turnout | 2,863 | 78.6 | +31.2 | ||
Conservative hold | Swing | +2.4 | |||
Party | Candidate | Votes | % | ±% | |
---|---|---|---|---|---|
Residents | A. Wreglesworth | 1,718 | 63.2 | +13.5 | |
Conservative | E. Stamp | 804 | 29.6 | -14.0 | |
Labour | A. Sandey | 197 | 7.2 | +0.5 | |
Majority | 914 | 33.6 | |||
Turnout | 2,719 | 74.4 | +23.7 | ||
Residents hold | Swing | +13.8 | |||
Party | Candidate | Votes | % | ±% | |
---|---|---|---|---|---|
Conservative | J. Allen | 2,026 | 77.7 | -12.4 | |
Independent | J. Weedon | 580 | 22.3 | New | |
Majority | 1,446 | 55.5 | |||
Turnout | 2,606 | 74.4 | +32.6 | ||
Conservative hold | Swing | -17.3 | |||
Party | Candidate | Votes | % | ±% | |
---|---|---|---|---|---|
Conservative | R. Darby | 1,648 | 56.2 | -9.8 | |
Liberal | A. Brentnall | 1,282 | 43.8 | +24.1 | |
Majority | 366 | 12.5 | |||
Turnout | 2,930 | 78.7 | +36.9 | ||
Conservative hold | Swing | -16.9 | |||
The 2007 council elections in Guildford saw the Conservatives retain control over Guildford Borough Council. Full results for each ward can be found at Guildford Council election, full results, 2007.
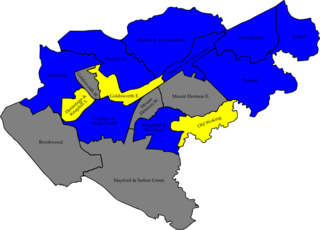
The 2007 Woking Council election took place on 3 May 2007 to elect members of Woking Borough Council in Surrey, England. One third of the council was up for election and the Conservative Party gained overall control of the council from no overall control.
The 2010 St Albans City and District Council election took place on 6 May 2010 to elect members of St Albans District Council in Hertfordshire, England. One third of the council was up for election and the Liberal Democrats stayed in overall control of the council.
The 1999 Pendle Borough Council election took place on 6 May 1999 to elect members of Pendle Borough Council in Lancashire, England. One third of the council was up for election and the Liberal Democrats lost overall control of the council to no overall control.
The 2006 Basingstoke and Deane Council election took place on 4 May 2006 to elect members of Basingstoke and Deane Borough Council in Hampshire, England. One third of the council was up for election and the council stayed under no overall control.
The 2007 Basingstoke and Deane Council election took place on 3 May 2007 to elect members of Basingstoke and Deane Borough Council in Hampshire, England. One third of the council was up for election and the Conservative Party stayed in overall control of the council.
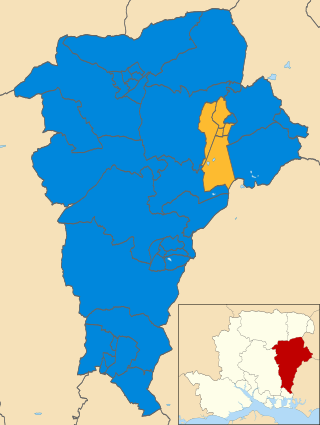
The 2011 East Hampshire District Council election took place on 5 May 2011 to elect members of East Hampshire District Council in Hampshire England. The whole council was up for election and the Conservative Party stayed in overall control of the council.
The 2011 Eastbourne Borough Council election took place on 5 May 2011 to elect members of Eastbourne Borough Council in East Sussex, England. The whole council was up for election and the Liberal Democrats stayed in overall control of the council.
The 2008 Colchester Borough Council election took place on 1 May 2008 to elect members of Colchester Borough Council in Essex, England. One third of the council was up for election and the Conservative party lost overall control of the council to no overall control.
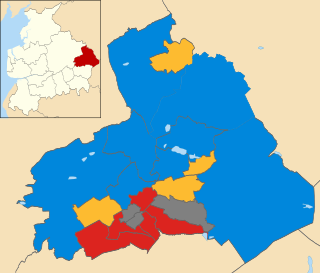
The 2011 Pendle Borough Council election took place on 5 May 2011 to elect members of Pendle Borough Council in Lancashire, England. One third of the council was up for election and the council stayed under no overall control.
The 2012 Pendle Borough Council election took place on 3 May 2012 to elect members of Pendle Borough Council in Lancashire, England. One third of the council was up for election and the council stayed under no overall control.
The 2014 Pendle Borough Council election took place on 22 May 2014 to elect members of Pendle Borough Council in Lancashire, England. One third of the council was up for election and the council stayed under no overall control.
The 2007 Huntingdonshire District Council election took place on 3 May 2007 to elect members of Huntingdonshire District Council in Cambridgeshire, England. One third of the council was up for election and the Conservative Party stayed in overall control of the council.
The 2010 Harlow District Council election took place on 6 May 2010 to elect members of Harlow District Council in Essex, England. One third of the council was up for election and the Conservative party stayed in overall control of the council.
The 2011 Harlow District Council election took place on 5 May 2011 to elect members of Harlow District Council in Essex, England. One third of the council was up for election and the Conservative Party stayed in overall control of the council.
The 2014 Brent London Borough Council election took place on 22 May 2014 to elect members of Brent London Borough Council in London, England. The whole council was up for election and the Labour Party stayed in overall control of the council.
The 2007 Wychavon District Council election took place on 3 May 2007 to elect members of Wychavon District Council in Worcestershire, England. The whole council was up for election and the Conservative party stayed in overall control of the council.
The 2011 Wychavon District Council election took place on 5 May 2011 to elect members of Wychavon District Council in Worcestershire, England. The whole council was up for election and the Conservative Party stayed in overall control of the council.
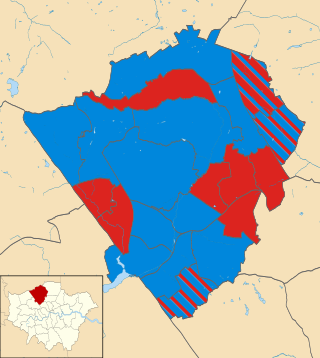
The 2018 Barnet Borough Council election took place on 3 May 2018 to elect members of Barnet Borough Council in England. It took place on the same day as other local elections in 2018. In the last election, the Conservatives won control of the council with 32 seats, compared to 30 for Labour and 1 for the Liberal Democrats. On 15 March 2018, following the resignation of a Conservative councillor, the council was in a state of no overall control. The election on 3 May 2018 saw the Conservatives take back overall control with a majority of 13.
The 2019 St Albans City and District Council election took place on 2 May 2019 to elect members of St Albans City and District Council in England. This was on the same day as other local elections. At the elections, the Conservatives lost control of the council