
The City of Winchester is a local government district in Hampshire, England, with a city status.
The 2010 Brentwood council election took place on 6 May 2010 to elect members of Brentwood District Council in Essex, England as part of the 2010 United Kingdom local elections. One third of the council was up for election with the council previously having a majority for the Conservative party. The Conservative Party lost two seats to the Liberal Democrats in Brentwood North and Brentwood West respectively.
The 1998 Brent London Borough Council election took place on 7 May 1998 to elect members of Brent London Borough Council in London, England. The whole council was up for election and the Labour party gained overall control of the council from no overall control.

The United Kingdom local elections took place on 1 May 1997. Elections took place for all of the English country councils, some English unitary authorities and all of the Northern Ireland districts. The elections were held on the same day as the general election.

The 2007 Harlow District Council election took place on 3 May 2007 to elect members of Harlow District Council in Essex, England. One third of the council was up for election and the council stayed under no overall control.

The 2010 Barnet Council election took place on 6 May 2010 to elect members of Barnet London Borough Council in London, England. The whole council was up for election and the Conservative party stayed in overall control of the council.
The 2010 Rossendale Borough Council election took place on 6 May 2010 to elect members of Rossendale Borough Council in Lancashire, England. One third of the council was up for election and the Conservative Party stayed in overall control of the council.
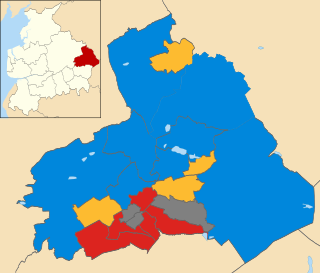
The 1999 Pendle Borough Council election took place on 6 May 1999 to elect members of Pendle Borough Council in Lancashire, England. One third of the council was up for election and the Liberal Democrats lost overall control of the council to no overall control.

The 2007 Basildon District Council election took place on 3 May 2007 to elect members of Basildon District Council in Essex, England. One third of the council was up for election and the Conservative party stayed in overall control of the council.

The 2012 St Albans City and District Council election took place on 3 May 2012 to elect members of St Albans District Council in Hertfordshire, England. One third of the council was up for election and the council stayed under no overall control.

The 2013 United Kingdom local elections took place on Thursday 2 May 2013. Elections were held in 35 English councils: all 27 non-metropolitan county councils and eight unitary authorities, and in one Welsh unitary authority. Direct mayoral elections took place in Doncaster and North Tyneside. These elections last took place on the 4 June 2009 at the same time as the 2009 European Parliament Elections, except for County Durham, Northumberland and the Anglesey where elections last took place in 2008.

The 2011 St Albans City and District Council election took place on 5 May 2011 to elect members of St Albans District Council in Hertfordshire, England. One third of the council was up for election and the Liberal Democrats lost overall control of the council to no overall control.

The 2008 Colchester Borough Council election took place on 1 May 2008 to elect members of Colchester Borough Council in Essex, England. One third of the council was up for election and the Conservative party lost overall control of the council to no overall control.
The 2011 Pendle Borough Council election took place on 5 May 2011 to elect members of Pendle Borough Council in Lancashire, England. One third of the council was up for election and the council stayed under no overall control.

The 2012 Pendle Borough Council election took place on 3 May 2012 to elect members of Pendle Borough Council in Lancashire, England. One third of the council was up for election and the council stayed under no overall control.

The 2012 Havant Borough Council election took place on 3 May 2012 to elect members of Havant Borough Council in Hampshire, England. One third of the council was up for election and the Conservative Party stayed in overall control of the council.

The 2014 Harlow District Council election took place on 22 May 2014 to elect members of Harlow District Council in Essex, England. One third of the council was up for election and the Labour Party stayed in overall control of the council.

The 2015 Wychavon District Council election took place on 7 May 2015 to elect members of Wychavon District Council in Worcestershire, England. The whole council was up for election and the Conservative Party stayed in overall control of the council.
Elections to Liverpool City Council were held on 1 November 1937. One third of the council seats were up for election, the term of office of each councillor being three years.

A by-thirds Hyndburn Borough Council local election, was held on Thursday 2 May 2019. Approximately one third of the local council's 35 seats fell up for election on that day.
