The topic of this article may not meet Wikipedia's general notability guideline .(April 2023) |
This article includes a list of references, related reading, or external links, but its sources remain unclear because it lacks inline citations .(April 2023) |
Elections to the newly created Runnymede District Council were held on 7 June 1973 alongside other 1973 United Kingdom local elections. The Conservative party won control of the council by winning a majority of 23 out of the 40 seats.
After the election, the composition of the council was
1973 Runnymede District Council election | ||||||||||
---|---|---|---|---|---|---|---|---|---|---|
Party | Candidates | Seats | Gains | Losses | Net gain/loss | Seats % | Votes % | Votes | +/− | |
Conservative | 40 | 23 | 57.5 | 46.1 | 44,405 | |||||
Labour | 32 | 15 | 37.5 | 36.9 | 35,534 | |||||
Residents | 2 | 2 | 5.0 | 1.4 | 1,373 | |||||
Liberal | 17 | 0 | 0.0 | 15.0 | 14,431 | |||||
Communist | 2 | 0 | 0.0 | 0.5 | 435 | |||||
Independent | 1 | 0 | 0.0 | 0.1 | 119 |
Party | Candidate | Votes | % | ±% | |
---|---|---|---|---|---|
Labour | C. Farrant | 1,401 | 35.0 | New | |
Conservative | P. Dennis | 1,379 | 34.4 | New | |
Labour | G. Tucker | 1,373 | |||
Conservative | D. Genet | 1,340 | |||
Conservative | E. Shaw | 1,333 | |||
Conservative | C. Hamel-Cooke | 1,318 | |||
Labour | J. Keene | 1,314 | |||
Labour | L. Taylor | 1,296 | |||
Labour | C. Watts | 1,295 | |||
Conservative | S. Jones | 1,281 | |||
Labour | G. Honeyball | 1,272 | |||
Conservative | G. Skipper | 1,270 | |||
Conservative | P. Vergette | 1,262 | |||
Conservative | D. Tuckwood | 1,255 | |||
Labour | G. Rees | 1,242 | |||
Labour | J. Webb | 1,235 | |||
Liberal | K. Lloyd | 1,228 | 30.6 | New | |
Liberal | A. Brentnall | 1,134 | |||
Liberal | B. Cain | 1,000 | |||
Liberal | A. Shore | 993 | |||
Liberal | J. Harmsworth | 986 | |||
Liberal | Geoffrey Pyle | 973 | |||
Majority | 22 | 0.5 | |||
Turnout | 38.4 | ||||
Labour win (new seat) | |||||
Conservative win (new seat) | |||||
Labour win (new seat) | |||||
Conservative win (new seat) | |||||
Labour win (new seat) | |||||
Labour win (new seat) |
Party | Candidate | Votes | % | ±% | |
---|---|---|---|---|---|
Labour | Ray Lowther | 2,233 | 49.0 | New | |
Labour | D. Leach | 1,729 | |||
Labour | D. Light | 1,682 | |||
Labour | A. Kemp | 1,677 | |||
Labour | R. Palmer | 1,584 | |||
Labour | A. Anderson | 1,524 | |||
Conservative | W. Collett | 1,382 | 30.4 | New | |
Conservative | R. Taylor | 1,340 | |||
Conservative | G. Chase Paris | 1,254 | |||
Conservative | S. Gardener | 1,205 | |||
Conservative | L. Stark | 1,178 | |||
Conservative | M. Wise | 1,147 | |||
Liberal | J. Elfer | 938 | 20.6 | New | |
Liberal | K. Joy | 704 | |||
Liberal | M. Wainoff | 654 | |||
Majority | 851 | 18.7 | |||
Turnout | 50.5 | ||||
Labour win (new seat) | |||||
Labour win (new seat) |
Party | Candidate | Votes | % | ±% | |
---|---|---|---|---|---|
Conservative | P. Barry | 1,480 | 37.3 | New | |
Labour | C. Slater | 1,460 | 36.8 | New | |
Conservative | G. Hinton-Lever | 1,405 | |||
Conservative | D. Head | 1,394 | |||
Conservative | P. Godwin | 1,372 | |||
Labour | H. Gunns | 1,302 | |||
Labour | L. Carey | 1,250 | |||
Labour | J. Holder | 1,150 | |||
Liberal | E. Bates | 906 | 22.8 | New | |
Independent | W. Whithear | 119 | 3.0 | New | |
Majority | 20 | 0.5 | |||
Turnout | 62.3 | ||||
Conservative win (new seat) | |||||
Labour win (new seat) | |||||
Conservative win (new seat) | |||||
Conservative win (new seat) |
Party | Candidate | Votes | % | ±% | |
---|---|---|---|---|---|
Conservative | B. Jarvis | 873 | 57.6 | New | |
Conservative | G. Tollett | 817 | |||
Conservative | J. Walbridge | 773 | |||
Liberal | C. Boyde | 399 | 26.3 | New | |
Labour | Sylvia Heal | 243 | 16.0 | New | |
Labour | J. Pierce | 180 | |||
Majority | 474 | 31.3 | |||
Turnout | 43.1 | ||||
Conservative win (new seat) | |||||
Conservative win (new seat) |
Party | Candidate | Votes | % | ±% | |
---|---|---|---|---|---|
Labour | E. Austin | 1,135 | 50.9 | New | |
Labour | D. Baker | 1,076 | |||
Labour | K. Capper | 1,061 | |||
Labour | K. Thompson | 845 | |||
Liberal | N. Smithers | 580 | 26.0 | New | |
Conservative | D. Cox | 516 | 35.3 | New | |
Conservative | E. Kelham | 419 | |||
Conservative | S. McQuown | 413 | |||
Conservative | S. Munday | 393 | |||
Majority | 555 | 24.9 | |||
Turnout | 41.5 | ||||
Labour win (new seat) | |||||
Labour win (new seat) |
Party | Candidate | Votes | % | ±% | |
---|---|---|---|---|---|
Conservative | A. Blowers | 1,670 | 43.8 | New | |
Conservative | P. Clark | 1,479 | |||
Conservative | E. Hargreaves | 1,426 | |||
Conservative | R. Button | 1,414 | |||
Conservative | F. Todd | 1,379 | |||
Liberal | R. Norrall | 1,044 | 27.4 | New | |
Liberal | D. Peet | 1,034 | |||
Liberal | P. Robson | 975 | |||
Labour | J. Taylor | 873 | 22.9 | New | |
Labour | J. Hassard | 837 | |||
Communist | E. Lavender | 223 | 5.9 | New | |
Communist | K. Ruddock | 212 | |||
Majority | 626 | 16.4 | |||
Turnout | 51.5 | ||||
Conservative win (new seat) | |||||
Conservative win (new seat) |
Party | Candidate | Votes | % | ±% | |
---|---|---|---|---|---|
Residents | J. Smith | 712 | 69.1 | New | |
Residents | L. Uncles | 661 | |||
Conservative | J. Hargrave-Wright | 319 | 30.9 | New | |
Conservative | C. Clarke | 309 | |||
Majority | 393 | 32.6 | |||
Turnout | 39.1 | ||||
Residents win (new seat) | |||||
Residents win (new seat) |
Party | Candidate | Votes | % | ±% | |
---|---|---|---|---|---|
Conservative | R. Elliott | 1,238 | 50.6 | New | |
Conservative | A. Collins | 1,102 | |||
Conservative | R. Try | 1,055 | |||
Conservative | A. Maude | 1,036 | |||
Labour | J. Capper | 763 | 31.2 | New | |
Labour | Keith Heal | 746 | |||
Labour | D. Keen | 746 | |||
Labour | M. Thompson | 663 | |||
Liberal | J. Smith | 446 | 18.2 | New | |
Majority | 475 | 19.4 | |||
Turnout | 53.2 | ||||
Conservative win (new seat) | |||||
Conservative win (new seat) |
Party | Candidate | Votes | % | ±% | |
---|---|---|---|---|---|
Conservative | L. Cook | 1,076 | 63.7 | New | |
Conservative | D. Morris | 1,053 | |||
Conservative | K. Spring | 1,039 | |||
Conservative | R. Hervey | 1,011 | |||
Liberal | A. Landmann | 437 | 25.9 | New | |
Labour | A. Sandey | 175 | 10.4 | New | |
Labour | A. Coleman | 172 | |||
Majority | 639 | 37.9 | |||
Turnout | 38.0 | ||||
Conservative win (new seat) | |||||
Conservative win (new seat) |
The Borough of Runnymede is a local government district with borough status in the English county of Surrey. It is a very prosperous part of the London commuter belt, with some of the most expensive housing in the United Kingdom outside central London, such as the Wentworth Estate.
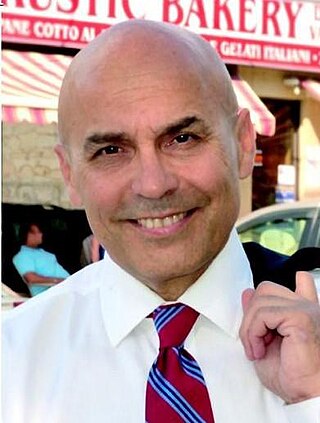
John Nunziata is a Canadian lawyer and former politician. He first served as an Alderman in the Borough of York from 1978 to 1982. He served three terms as a Liberal MP in the House of Commons of Canada from York South-Weston and in 1997 was elected as an Independent MP. As of March, 2013, he was a partner in the lobbying firm The Parliamentary Group.
Runnymede Independent Residents' Group was founded in 2001; it has held exactly one seventh of councillors' seats and formed the largest opposition party since the election it first contested in 2002.
One third of Runnymede Borough Council in Surrey, England is elected each year, followed by one year where there is an election to Surrey County Council instead. The council is divided up into 14 wards, electing 41 councillors, since the last boundary changes in 2019.
Elections to Runnymede Council were held on 7 May 1998. One third of the council was up for election and the Conservative party gained overall control of the council from no overall control.
Elections to Runnymede Council were held on 6 May 1999. One third of the council was up for election and the Conservative party stayed in overall control of the council.
Elections to Runnymede Council were held on 2 May 2002. One third of the council was up for election and the Conservative Party stayed in overall control of the council.
Elections to Runnymede Council were held on 1 May 2003. One third of the council was up for election and the Conservative Party stayed in overall control of the council.
Elections to Runnymede Council were held on 10 June 2004. One third of the council was up for election and the Conservative Party stayed in overall control of the council.
Elections to Runnymede Council were held on 4 May 2006. One third of the council was up for election and the Conservative Party stayed in overall control of the council.
Elections to Runnymede Council were held on 3 May 2007. One third of the council was up for election and the Conservative Party stayed in overall control of the council.
Elections to Runnymede Council were held on 1 May 2008. One third of the council was up for election and the Conservative Party stayed in overall control of the council.
The 2012 Runnymede Borough Council election took place on 3 May 2012 to elect members of the Runnymede Borough District Council. The Conservative Party won 12 of the seats and the local Runnymede Independent Residents' Group won 2; both parties held onto their seats from the 2011 elections.
The 2015 Runnymede Borough Council election took place on 7 May 2015 to elect one third of members to Runnymede Borough Council in England. The election coincided with other local elections held simultaneously with a General Election and resulted in increased turnout compared to the election four years before. In Addlestone North a by-election added to seats vacant. All currently drawn wards of the United Kingdom in this area are three-member, with the different members' seats contested three years out of four.
The 2015 Tandridge District Council election took place on 7 May 2015 to elect one third of members to Tandridge District Council in England coinciding with other local elections held simultaneously with a General Election which resulted in increased turnout compared to the election four years before. Elections in each ward, depending on size are held in two or three years out of four.
The 2016 Runnymede Borough Council election took place on 5 May 2016 to elect 15 members of Runnymede Borough Council in Surrey, England. This was on the same day as other local elections.
The 2021 Runnymede Borough Council election was held on 6 May 2021 to elect members of Runnymede Borough Council in England. This was on the same day as other local elections, and was the second election on new electoral boundaries, following the 2019 Runnymede Borough Council election. The elections were postponed from May 2020 due to the COVID-19 pandemic Englefield Green East was not contested.
The 2011 Runnymede Borough Council election took place in May 2011 to fill 14 open seats on the Runnymede Borough District Council. The Conservative Party swept the elections, earning nearly 86% of the seats with only 53% of votes cast.
Elections for Runnymede Borough Council took place on 3 May 2018 alongside nationwide local elections. A third of the council was up for election, and the Conservatives retained control. Labour won their first seat on the council for over 20 years.
The 2022 Runnymede Borough Council election took place on 5 May 2022 to elect one-third of members of the Runnymede Borough Council in England. This was on the same day as other local elections in the U.K.