Related Research Articles

A heat wave or heatwave, sometimes described as extreme heat, is a period of abnormally hot weather. Definitions vary but are similar. A heat wave is usually measured relative to the usual climate in the area and to normal temperatures for the season. Temperatures that humans from a hotter climate consider normal, can be regarded as a heat wave in a cooler area. This would be the case if the warm temperatures are outside the normal climate pattern for that area. High humidity often occurs during heat waves as well. This is especially the case in oceanic climate countries. Heat waves have become more frequent, and more intense over land, across almost every area on Earth since the 1950s, the increase in frequency and duration being caused by climate change.
The July 1995 Chicago heat wave led to 739 heat-related deaths in Chicago over a period of five days. Most of the victims of the heat wave were elderly poor residents of the city, who did not have air conditioning, or had air conditioning but could not afford to turn it on, and did not open windows or sleep outside for fear of crime. The heat wave also heavily impacted the wider Midwestern region, with additional deaths in both St. Louis, Missouri and Milwaukee, Wisconsin.

The climate of Chicago is classified as hot-summer humid continental with hot humid summers and cold, occasionally snowy winters. All four seasons are distinctly represented: Winters are cold and often see snow with below 0 Celsius temperatures and windchills, while summers are warm and humid with temperatures being hotter inland, spring and fall bring bouts of both cool and warm weather and fairly sunny skies. Annual precipitation in Chicago is moderate and relatively evenly distributed, the driest months being January and February and the wettest July and August. Chicago's weather is influenced during all four seasons by the nearby presence of Lake Michigan.

The Western Wisconsin Derecho was a derecho, or severe weather system, that occurred through several counties of Western Wisconsin on July 15, 1980. It caused $240 million in damage -- the largest storm damage total in Wisconsin history to that point. Three people died. The storm is still referred to as The July 15th Storm,July 15th, 1980, or simply The Storm.

The Summer 2006 North American heat wave was a severe heat wave that affected most of the United States and Canada, killing at least 225 people and bringing extreme heat to many locations. At least three died in Philadelphia, Arkansas, and Indiana. In Maryland, the state health officials reported that three people died of heat-related causes. Another heat related death was suspected in Chicago.

The 2006 European heat wave was a period of exceptionally hot weather that arrived at the end of June 2006 in certain European countries. The United Kingdom, France, Belgium, the Netherlands, Luxembourg, Italy, Poland, the Czech Republic, Hungary, Germany and western parts of Russia were most affected.

Aided by drought, a heat wave persisted in the late summer of 2000 along the southern tier of the United States from August to early September. Near the end of the period, daily, monthly, and even all-time record high temperatures were broken, with highs commonly peaking well over 100 °F (38 °C). On August 30, Memphis saw its second highest temperature of 107 degrees, just one degree short of its all time high of 108 degrees set in 1980. On September 4, Houston hit 109 °F (43 °C) and Dallas peaked at 111 °F (44 °C). On September 5, Corpus Christi peaked at 109 °F (43 °C) and San Antonio rose to an all-time high of 111 °F (44 °C), while College Station and Austin reached 112 °F (44 °C). Damage totaled $4 billion, mainly due to wildfires and crop losses, and there were 140 deaths.

The 1936 North American heat wave was one of the most severe heat waves in the modern history of North America. It took place in the middle of the Great Depression and Dust Bowl of the 1930s and caused more than 5,000 deaths. Many state and city record high temperatures set during the 1936 heat wave stood until the 2012 North American heat wave. Many more endure to this day; as of 2022, 13 state record high temperatures were set in 1936. The 1936 heat wave followed one of the coldest winters on record.
Dallas is located in North Texas, built along the Trinity River. It has a humid subtropical climate that is characteristic of the southern plains of the United States. Dallas experiences mild winters and hot summers.
The 2007 North American heat wave started at the end of July and lasted into the first weeks of August. It was associated with severe drought over regions of the southeastern United States and parts of the Great Lakes region.

North Dakota's climate is typical of a continental climate with cold winters and warm-hot summers. The state's location in the Upper Midwest allows it to experience some of the widest variety of weather in the United States, and each of the four seasons has its own distinct characteristics. The eastern half of the state has a humid continental climate with warm to hot, somewhat humid summers and cold, windy winters, while the western half has a semi-arid climate with less precipitation and less humidity but similar temperature profiles. The areas east of the Missouri River get slightly colder winters, while those west of the stream get higher summer daytime temperatures. In general, the diurnal temperature difference is prone to be more significant in the west due to higher elevation and less humidity.

The 2010 Northern Hemisphere summer heat waves included severe heat waves that impacted most of the United States, Kazakhstan, Mongolia, China, Hong Kong, North Africa and the European continent as a whole, along with parts of Canada, Russia, Indochina, South Korea and Japan during July 29, 2010. The first phase of the global heatwaves was caused by a moderate El Niño event, which lasted from June 2009 to May 2010. This lasted only from April 2010 to June 2010 and caused only moderate above-average temperatures in the affected regions, but it also set new record high temperatures for most of the area affected in the Northern Hemisphere.
The 2011 North American heat wave was a deadly summer 2011 heat wave that affected the Southern Plains, the Midwestern United States, Eastern Canada, the Northeastern United States, and much of the Eastern Seaboard, and had Heat index/Humidex readings reaching upwards of 131 °F (55 °C). On a national basis, the heat wave was the hottest in 75 years.

The Summer 2012 North American heat wave was one of the most severe heat waves in modern North American history. It resulted in more than 82 heat-related deaths across the United States and Canada, and an additional twenty-two people died in the resultant June 2012 North American derecho. This long-lived, straight-line wind and its thunderstorms cut electrical power to 3.7 million customers. Over 500,000 were still without power on July 6, as the heat wave continued. Temperatures generally decreased somewhat the week of July 9 in the east, but the high pressure shifted to the west, causing the core of the hot weather to build in the Mountain States and the Southwestern United States shifting eastwards again by mid-July. By early August, the core of the heat remained over the Southern Plains.

The 2021 Western North America heat wave was an extreme heat wave that affected much of Western North America from late June through mid-July 2021. The heat wave affected Northern California, Idaho, Western Nevada, Oregon, and Washington in the United States, as well as British Columbia, and in its latter phase, Alberta, Manitoba, the Northwest Territories, Saskatchewan, and Yukon, all in Canada. It also affected inland regions of Central and Southern California, Nevada, and Montana, though the temperature anomalies were not as extreme as in the regions farther north.

In 2022, several areas of the world experienced heat waves. Heat waves were especially notable in East Asia, the Indian subcontinent, Australia, western Europe, the United States, and southern South America. 2022 heat waves accounted for record-breaking temperatures and, in some regions, heat-related deaths. Heat waves were worsened by the effects of climate change, and they exacerbated droughts and wildfires.
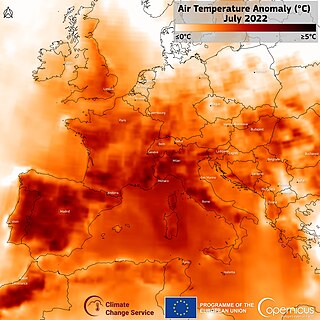
From June to August 2022, persistent heatwaves affected parts of Europe, causing evacuations and killing tens of thousands. These heat waves were the deadliest meteorological events in 2022. The highest temperature recorded was 47.0 °C (116.6 °F) in Pinhão, Portugal, on 14 July.
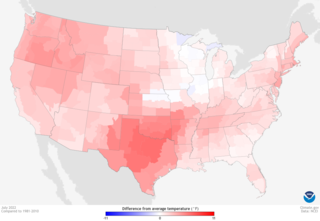
From late spring to late summer heat waves in 2022 smashed many records in North America between May and September of that year. Dozens of temperature records were surpassed in the United States.
This page documents notable droughts and heat waves worldwide in 2020.
References
- ↑ "Impacts of Temperature Extremes". sciencepolicy.colorado.edu.
- ↑ 1634–1699: McCusker, J. J. (1997). How Much Is That in Real Money? A Historical Price Index for Use as a Deflator of Money Values in the Economy of the United States: Addenda et Corrigenda (PDF). American Antiquarian Society. 1700–1799: McCusker, J. J. (1992). How Much Is That in Real Money? A Historical Price Index for Use as a Deflator of Money Values in the Economy of the United States (PDF). American Antiquarian Society. 1800–present: Federal Reserve Bank of Minneapolis. "Consumer Price Index (estimate) 1800–" . Retrieved February 29, 2024.
- ↑ "National Climatic Data Center - Chronological List of U.S. Billion Dollar Events - 22-Jul-2008". Archived from the original on 2001-09-15. Retrieved 2008-07-25.
- 1 2 "Fort Worth/Dallas, TX". www.srh.noaa.gov. US Department of Commerce, NOAA, National Weather Service.
- ↑ "Change Is in the Air as the 80s Unfold". www.achrnews.com.
- ↑ Myatt, Kevin (July 11, 2020). "A silent killer, the heat wave of 1980 remains among the nation's deadliest weather events". Washington Post.