2006 North American heat wave

Last updated
North American heat wave of 2006
NOAA Temp July20 8pmEDT.png
AreasLower 48 U.S. states and lower parts of Canada
Start dateJuly 15, 2006
End dateAugust 27, 2006
Peak temp. 119 °F (48 °C)
Losses
DeathsAt least 225 [1] [2] [3]

The Summer 2006 North American heat wave was a severe heat wave that affected most of the United States and Canada, killing at least 225 people and bringing extreme heat to many locations. At least three died in Philadelphia, Arkansas, and Indiana. [4] In Maryland, the state health officials reported that three people died of heat-related causes. [5] Another heat related death was suspected in Chicago. [6]

Contents

Although many heat related deaths go unreported, by July 19, the Associated Press reported that the soaring heat was blamed for 12 deaths from Oklahoma City to the Philadelphia area. [7] [8] Reports by early morning July 20 raised the death toll to at least 16 in seven states. [9]

This period of heat also saw a wind storm (derecho) in St. Louis that caused widespread power outages, including for cooling centers designed to provide relief for those suffering from the heat. In addition, places on the West Coast, like California's Central Valley and Southern California experienced humid heat, which is unusual for the area. [10] [11]

Mortality

By July 21, when the first phase of this heat wave came to an end, 22 reported fatalities had occurred in ten states. [12] Reports of deaths trailed off over the week-end of July 21–23, though high temperatures persisted and power outages remained in a number of areas including New York, Missouri, and Illinois. In St. Louis, half the city was without power due to severe thunderstorms, prompting requests for volunteer nurses to help cope with the situation. Though temperatures were somewhat cooler, [13] there still was at least one further reported heat death in Missouri. [14]

At least 31 deaths due to the heat were reported in New York City by August 16. [15] At least 13 died in Queens, 9 in Brooklyn, 5 in Manhattan and 1 in The Bronx. [16] By the end of August, authorities totaled 40 deaths in New York, however a later mortality review in November 2006 revealed that heat was a factor in 140 deaths. [17] [18]

In the early August heat, Chicago saw at least 23 deaths, [19] [20] but the City was widely praised [21] for avoiding the disaster that occurred in the 1995 Chicago heat wave which saw over 700 deaths. The City took steps to ensure vulnerable residents were protected, and individuals took responsibility for their neighbors.

By August 13, 28 heat-related deaths were reported in Cook County, which includes Chicago. [ permanent dead link ]

Deaths in California

The most severe death toll was in California, principally in the interior region. [22] By the end of July, the sweltering heat in California subsided, although the number of confirmed or suspected heat-related deaths climbed to 163 as county coroners worked through a backlog of cases. [1] A report from California Climate Change Center published in 2009 determined that the heat caused two to three times the number of deaths estimated by coroners in seven California counties. [23]

By July 25, California authorities documented at least 38 deaths related to the heat in 11 counties. Temperatures reached 110–115 °F (43–46 °C) in the central valley of California July 23–24. [24] State officials said it was the worst heat wave to hit Northern and Southern California simultaneously in 57 years. [25] Front-page newspaper coverage described some individual deaths. [26] By July 29, the mounting death toll left the coroner's office in Fresno overwhelmed and double-stacking bodies. [27]

There were also widespread animal deaths in California, with a veterinarian reporting 15 heat-related pet deaths as early as July 24. [28] The impact on farm animals and agriculture was also becoming apparent, with the death of more than 25,000 cattle and 700,000 fowl, prompting emergency measures by the state. [29]

Meteorology

Annual temperature departures for the year 2006. 2006 was one of the warmer years on record since 1895. 2006 noaa hottest year.jpg
Annual temperature departures for the year 2006. 2006 was one of the warmer years on record since 1895.

Temperatures hit 118 °F (48 °C) on July 21 in Phoenix, making it the hottest day since 1995 and one of the 11 hottest since 1895, when temperature records were first kept in the city. [13] California temperatures began reaching record levels by July 22. In one section of the City of Los Angeles, Woodland Hills, the temperature reached 119 °F (48 °C) making it the highest recorded temperature in the county and within the city border breaking the old record of 118 °F (48 °C) in Canoga Park. The unusual daytime heat resulted in extremely high overnight temperatures. Needles, California recorded a low temperature for Sunday, July 23 at 5 am., of 100 °F (38 °C) and in the LA basin the same night, Burbank recorded an overnight low of 77 °F (25 °C). [30]

The California heat wave broke local records. According to some reports it was "hotter for longer than ever before, and the weather patterns that caused the scorching temperatures were positively freakish." [11] [31] Fresno, in the central California valley, had six consecutive days of 110 degree-plus Fahrenheit temperatures. [32]

Beginning July 31 and into early August, the Midwest, Ontario, and Atlantic states also began experiencing the heat. [33] [34] Temperatures approached the 100 mark in Rochester, New York on August 1 and were coupled with the highest dew points the area has experienced in over 51 years. The heat index reached 110 °F (43 °C) that day. La Guardia Airport in New York City recorded three consecutive days above 100 °F (38 °C). The temperature peaked at 102 °F (39 °C) on August 2. Colonial Downs, a horse track in New Kent County, Virginia, canceled horse racing because of the 100 °F (38 °C) heat. [35] The Saratoga Race Course, north of Albany, canceled racing at the horse track for the first time in its history on August 2. [36] By August 8, the heat wave had passed for most areas, but persisted in the South and Southeast, with continued reports of mortality in Oklahoma. [20]

Timeline

The heat wave went through several distinct periods:

Reported physical damage

Dallas, Texas; Shreveport, Louisiana; the New England region; and other areas have reported damage such as ruptured water lines and buckled roads. The heat wave has been blamed for the damage. Interstate 44 had two traffic lanes temporarily closed in Oklahoma City after they buckled under the heat. [13] In addition, overworked power transformers have been damaged or rendered useless because of the heat, resulting in blackouts, notably in St. Louis, Missouri; Queens, New York; Los Angeles, California; and the Delaware Valley. Some wildfires, including forest fires, and greater thunderstorm intensity, have both been blamed on the heat wave.

Canadian heat

Parts of Canada, mostly areas of provinces located close to the U.S. border (Saskatchewan, Manitoba, Ontario and Quebec) had been affected in waves by the persistent heat over the continent building from west to east during the month of July, which progressed into August 2006. Persistent heat and drought had plagued some of the same regions of the country during the previous summers of 2002, 2003, and 2005, although large, frequent storms brought above normal rainfall to many areas in Ontario and Quebec during those years.

By mid-month, temperatures had soared to 42.1 °C (107.8 °F) at Lytton, British Columbia, with three straight days topping 41 °C (106 °F). Although various daily records were broken, the only overall monthly record in a major city was in Winnipeg, Manitoba where July was not only the driest on record but also had the highest average maximum temperature of any July. In Val Marie, Saskatchewan, the average daily maximum July temperature was 32.3 °C (90.1 °F), about 5 °C (41 °F) higher than average. [40]

Just north of Toronto at Buttonville Airport, the temperature reached 37.8 °C (100.0 °F) on August 2, 2006. On the same day, the nighttime minimum temperature in Toronto was the highest ever recorded, only dropping to 27.2 °C (81.0 °F). In Ottawa, the temperature reached 36.3 °C (97.3 °F), but with close to 80% humidity factored in, it reached an all-time humidex record of 48 °C (118 °F). [41]

Record power consumption was recorded in Ontario when close to 27,000 MW were used by consumers, beating out a record from the previous summer. [42]

Powerful thunderstorms affected parts of Ontario and Quebec on July 17 and July 30 in Peterborough, in eastern Ontario (Ottawa area) in the early morning hours of August 1 and again in Quebec, centred around Montreal that same evening. More than 450,000 people lost power in Quebec in that storm. [43] On August 2, more storms associated with a relieving cool front caused heavy damage over a wide swath of central and eastern Ontario, resulting in 175,000 residents losing power and thousands of felled trees blocking roads. Seventeen tornadoes were confirmed for August 2–3 ranging from F0-F2 in strength, the largest single day tornado outbreak in Ontario eclipsing the 14 recorded during a 1985 outbreak. The intensity of these storms was fueled by the heat bubble to the south. These series of storms killed at least four people and injured many others, in addition to extensive property damage and forest destruction.

After early August 2006, the heat only had a sporadic impact through the remainder of the month, mostly in the West. Temperatures returned to normal or even below average in other parts of the country for the remainder of the summer.

Impact of heat waves

Although comparatively little reporting is made about the health effects of extraordinarily hot conditions, heat waves are responsible for more deaths annually than more energetic natural disasters such as lightning, rain, floods, hurricanes, and tornadoes. [44] Supporting this conclusion, Karl Swanberg, a forecaster with the National Weather Service, reported that between 1936 and 1975, about 20,000 U.S. residents died of heat. [11] "Heat and solar radiation on average kill more U.S. residents each year than lightning, tornadoes, hurricanes, floods or earthquakes," said Karl Swanberg. This finding is also referenced in a publication of the National Oceanic and Atmospheric Administration, giving guidance on how to avoid health problems due to heat. [45]

See also

Related Research Articles

<span class="mw-page-title-main">Heat wave</span> Prolonged period of excessively hot weather

A heat wave, sometimes described as extreme heat, is a period of abnormally hot weather. High humidity often accompanies heat waves. This is especially the case in oceanic climate countries. Definitions vary but are similar. A heat wave is usually measured relative to the usual climate in the area and to normal temperatures for the season. Temperatures that humans from a hotter climate consider normal, can be regarded as a heat wave in a cooler area. This would be the case if the warm temperatures are outside the normal climate pattern for that area. Heat waves have become more frequent, and more intense over land, across almost every area on Earth since the 1950s. This is due to climate change.

The July 1995 Chicago heat wave led to 739 heat-related deaths in Chicago over a period of five days. Most of the victims of the heat wave were elderly poor residents of the city, who did not have air conditioning, or had air conditioning but could not afford to turn it on, and did not open windows or sleep outside for fear of crime. The heat wave also heavily impacted the wider Midwestern region, with additional deaths in both St. Louis, Missouri and Milwaukee, Wisconsin.

The heat wave of 2006 derecho series were a set of derechos — severe winds with powerful thunderstorms — that occurred on July 17–21, 2006. The first storms hit a wide swath of north-central and northeastern North America that stretched from the Upper Midwest through much of Ontario and into the northeastern United States. Another round struck the middle Mississippi River Valley, including two derechos that hit St. Louis, Missouri. The storms left more than three million people without power, some more than once and some for weeks.

The 2007 North American heat wave started at the end of July and lasted into the first weeks of August. It was associated with severe drought over regions of the southeastern United States and parts of the Great Lakes region.

<span class="mw-page-title-main">2010 Northern Hemisphere heat waves</span> Summer heat waves

The 2010 Northern Hemisphere summer heat waves included severe heat waves that impacted most of the United States, Kazakhstan, Mongolia, China, Hong Kong, North Africa and the European continent as a whole, along with parts of Canada, Russia, Indochina, South Korea and Japan during July 29 2010. The first phase of the global heatwaves was caused by a moderate El Niño event, which lasted from June 2009 to May 2010. The first phase lasted only from April 2010 to June 2010, and caused only moderate above average temperatures in the areas affected. But it also set new record high temperatures for most of the area affected, in the Northern Hemisphere. The second phase was caused by a very strong La Niña event, which lasted from June 2010 to June 2011. According to meteorologists, the 2010–11 La Niña event was one of the strongest La Niña events ever observed. That same La Niña event also had devastating effects in the Eastern states of Australia. The second phase lasted from June 2010 to October 2010, caused severe heat waves, and multiple record-breaking temperatures. The heatwaves began in April 2010, when strong anticyclones began to develop, over most of the affected regions, in the Northern Hemisphere. The heatwaves ended in October 2010, when the powerful anticyclones over most of the affected areas dissipated.

<span class="mw-page-title-main">1911 Eastern North America heat wave</span> 1911 severe heat wave in the northeastern United States

The 1911 Eastern North America heat wave was an 11-day severe heat wave that killed at least 380 people, though estimates have put the death toll as high as 2,000 people. The heat wave began on July 4, 1911 and didn't cease until July 15. In Nashua, New Hampshire, the temperature peaked at 106 °F (41 °C). In New York City alone, 158 people and 600 horses died.

The 2011 North American heat wave was a deadly summer 2011 heat wave that affected the Southern Plains, the Midwestern United States, Eastern Canada, the Northeastern United States, and much of the Eastern Seaboard, and had Heat index/Humidex readings reaching upwards of 131 °F (55 °C). On a national basis, the heat wave was the hottest in 75 years.

<span class="mw-page-title-main">2012 North American heat wave</span> Weather event in North America

The Summer 2012 North American heat wave was one of the most severe heat waves in modern North American history. It resulted in more than 82 heat-related deaths across the United States and Canada, and an additional twenty-two people died in the resultant June 2012 North American derecho. This long-lived, straight-line wind and its thunderstorms cut electrical power to 3.7 million customers. Over 500,000 were still without power on July 6, as the heat wave continued. Temperatures generally decreased somewhat the week of July 9 in the east, but the high pressure shifted to the west, causing the core of the hot weather to build in the Mountain States and the Southwestern United States shifting eastwards again by mid-July. By early August, the core of the heat remained over the Southern Plains.

<span class="mw-page-title-main">Weather of 2013</span>

The 2013 extreme weather events included several all-time temperature records in Northern and Southern Hemisphere. The February extent of snow cover in Eurasia and North America was above average, while the extent of Arctic ice in the same month was 4.5% below the 1981–2010 average. The Northern Hemisphere weather extremes have been linked to the melting of Arctic sea ice, which alters atmospheric circulation in a way that leads to more snow and ice.

<span class="mw-page-title-main">January–March 2014 North American cold wave</span> Extreme weather event affecting parts of Canada and the United States

The January–March 2014 North American cold wave was an extreme weather event that extended through the late winter months of the 2013–2014 winter season, and was also part of an unusually cold winter affecting parts of Canada and parts of the north-central and northeastern United States. The event occurred in early 2014 and was caused by a southward shift of the North Polar Vortex. Record-low temperatures also extended well into March.

The 2018 North American heat wave affected regions of Canada, where at least 70 deaths in Quebec were heat-related, the United States, where 18 states between Michigan and New Mexico issued heat advisories to a population of over 60 million people, and of Mexico, particularly the northwest and central regions.

<span class="mw-page-title-main">February 13–17, 2021 North American winter storm</span> Category 3 winter storm and ice storm in the United States

The February 13–17, 2021 North American winter storm was a crippling, large and major winter and ice storm that had widespread impacts across the United States, Northern Mexico, and parts of Canada from February 13 to 17, 2021. The storm, unofficially referred to as Winter Storm Uri by the Weather Channel, started out in the Pacific Northwest and quickly moved into the Southern United States, before moving on to the Midwestern and Northeastern United States a couple of days later.

<span class="mw-page-title-main">February 2021 North American cold wave</span> Cold wave in 2021

The February 2021 North American cold wave was an extreme weather event that brought record low temperatures to a significant portion of Canada, the United States and parts of northern Mexico during the first two-thirds of February 2021. The cold was caused by a southern migration of the polar vortex, likely caused by a sudden stratospheric warming event that occurred the prior month. Temperatures fell as much as 25–50 °F below average as far south as the Gulf Coast. Severe winter storms also were associated with the bitter cold, which allowed for heavy snowfall and ice accumulations to places as far south as Houston, Texas, and contributing to one of the snowiest winters ever in some areas in the Deep South.

<span class="mw-page-title-main">2021 Western North America heat wave</span> 2021 heat wave in the Pacific Northwest and Western Canada

The 2021 Western North America heat wave was an extreme heat wave that affected much of Western North America from late June through mid-July 2021. The heat wave affected Northern California, Idaho, Western Nevada, Oregon, and Washington in the United States, as well as British Columbia, and in its latter phase, Alberta, Manitoba, the Northwest Territories, Saskatchewan, and Yukon, all in Canada. It also affected inland regions of Central and Southern California, Northwestern and Southern Nevada and parts of Montana, though the temperature anomalies were not as extreme as in the regions farther north.

<span class="mw-page-title-main">2021 heat waves</span> List of heatwaves

This page documents notable heat waves worldwide in 2021.

<span class="mw-page-title-main">Weather of 2022</span>

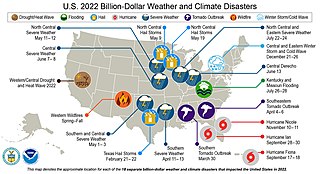
The following is a list of weather events that occurred on Earth in the year 2022. The year began with a La Niña. There were several natural disasters around the world from various types of weather, including blizzards, cold waves, droughts, heat waves, wildfires, floods, tornadoes, and tropical cyclones. The deadliest weather event of the year were the European heat waves, which killed over 26,000 people, 11,000 of which were in France. The costliest weather event of the year was Hurricane Ian, which caused at least $112.9 billion in damages in Florida and Cuba. Another significant weather event was the Pakistan floods, which killed 1,739 people and a total of $14.9 billion in damages.

<span class="mw-page-title-main">2022 North American heat waves</span> Heat wave affecting North America

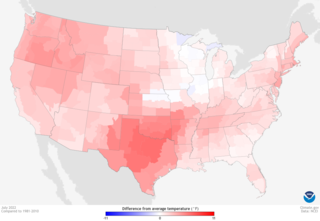
From late spring to late summer heat waves in 2022 smashed many records in North America between May and September of that year. Dozens of temperature records were surpassed in the United States.
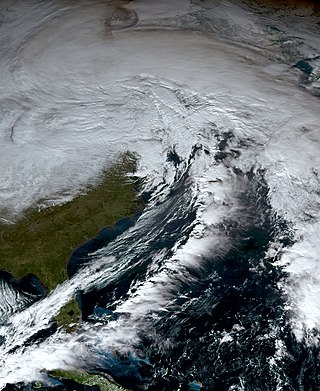
<span class="mw-page-title-main">December 2022 North American winter storm</span> North American winter storm in 2022

From December 21 to 26, 2022, a historic extratropical cyclone created crippling winter storm conditions, including blizzards, high winds, snowfall, and record cold temperatures across the majority of the United States and parts of Canada. Areas which experienced blizzard conditions included parts of Minnesota, Iowa, Wisconsin, Michigan, Ohio, Pennsylvania, New York and Ontario, with the Buffalo area of New York and the Fort Erie and Kingston areas of Ontario experiencing almost two full days of blizzard/zero-visibility conditions starting from December 23. The cold wave affected all U.S. states from Colorado to the Eastern Seaboard, with effects felt as far south as Miami, Florida. On December 24, 110 million people across 36 states were subject to wind chill alerts.

<span class="mw-page-title-main">Weather of 2023</span>

The following is a list of weather events that occurred on Earth in the year 2023. The year saw a transition from La Niña to El Niño, with record high global average surface temperatures. The several weather events which had a significant impact were blizzards, cold waves, droughts, heat waves, wildfires, floods, tornadoes, and tropical cyclones.

References

  1. 1 2 Midwest suffers as heat bears down Carla Johnson, Associated Press, appearing in Houston Chronicle, July 31, 2006 (July 21 total + 163).
  2. Triple-digit heat hangs on in East, Midwest Desmond Butler, Associated Press, appearing in the Houston Chronicle, August 3, 2006 (July 21 + Cal at 164 + 13).
  3. Front brings East Coast temperatures down, Verena Dobnik, Associated Press, appearing in the Houston Chronicle, August 4, 2006 (July 21 + Cal at 164 + 39). Note, however that later United Press International reporting on August 9 quotes California state Office of Emergency Services as counting 106 confirmed deaths, with 35 deaths "believed to be caused by heat stress or exhaustion.
  4. Nation Swelters In Heat Wave CBS News, July 18, 2006.
  5. Heat blamed for 3 recent deaths in Md., Baltimore Sun, July 18, 2006, afternoon edition (note: this story includes heat related deaths for July 14 and 16).
  6. Sizzling weather puts heat on ComEd Chicago Sun Times, July 18, 2006. ("A 50-year-old woman who was found unresponsive by her landlady in the 4800 block of North Troy was suspected of dying from heat complications, said Chicago Fire Department spokesman Larry Langford.")
  7. Heat wave blamed for 11 deaths, Colleen Long, Associated Press, appearing in the Houston Chronicle, July 19, 2006, 10 am.
  8. Heat Wave Ebbs in Parts of U.S. [ dead link ], Colleen Long, Associated Press, appearing in Forbes, July 19, 2006, 1 pm.
  9. Heat wave's death toll rises to at least 16, Shaun Schafer, Associated Press, as reported in the Houston Chronicle, 5 am (this article gives better location references).
  10. BAY AREA: Don't pack up the shorts yet: Heat still on. Sweltering conditions forecast to continue through weekend, with no relief in sight for days Archived 2010-05-07 at the Wayback Machine , Michael Cabanatuan and Cicero A. Estrella, San Francisco Chronicle, July 22, 2006.
  11. 1 2 3 The heat wave that was, S.F. Chronicle, July 27, 2006 (75 California deaths + 25 non-Cal.) Archived December 13, 2007, at the Wayback Machine
  12. Guard to St. Louis; Heat Deaths Rise, Jim Salter, Associated Press, retrieved from ABC News, July 21, 2006, am; same story appeared in the Kansas City Star, with more details, death toll described as "nearly two dozen", noting death of homeless man, two without air conditioning.
  13. 1 2 3 Battered St. Louis seeks volunteer nurses, Jim Salter, Associated Press, appearing in the Houston Chronicle, July 22, 2006.
  14. Cooler weather brings relief for St. Louis, Jim Salter, Associated Press, appearing in the Kansas City Star, July 22, 2006
  15. Pérez-Peña, Richard (August 17, 2006). "Manhattan: 4 More Deaths Tied to Heat Wave". The New York Times.
  16. Pérez-Peña, Richard (August 8, 2006). "Manhattan: Death Toll From Heat Increases". The New York Times.
  17. Pérez-Peña, Richard (November 16, 2006). "Heat Wave Was Factor in 140 deaths, New York Says". The New York Times.
  18. Campanile, Carl (November 16, 2006). "Heat wave was City's silent killer". New York Post. Archived from the original on 2007-09-29. Retrieved 2006-11-18.
  19. "Heat wave victims fall through cracks". Chicago Tribune. August 3, 2006.[ permanent dead link ]
  20. 1 2 "Heat wave continues in Arkansas, Oklahoma, Tennessee and Mississippi". The Albuquerue Tribune. August 8, 2006. Archived from the original on August 13, 2006. Retrieved August 9, 2006.
  21. "City learned lesson from deadly '95 heat wave". Chicago Sun Times. August 3, 2006.
  22. "Heat blamed for 4 deaths in California". USA Today. July 24, 2006.
  23. Estimating The Mortality Effect Of The July 2006 California Heat Wave, California Climate Change Center, Draft March 2009. Accessed 2009-07-23. Archived 2009-07-25.
  24. Heat claims as many as 38 people, tests state energy supply Aaron Davis, Associated Press, appearing in San Jose Mercury News, July 25, 2006. (when added to 25 non-California deaths, total reaches 63.)
  25. Heat wave not ready to ease up on state; Weather death toll rises to 41 -- forecast cooldown didn't kick in San Francisco Chronicle, July 26, 2006 (raises Cal. death toll to 41, total bumps to 66)
  26. Bulwa, Demian; Kuruvila, Matthai Chakko (July 26, 2006). "Killer Heat/At least 41 deaths blamed on high temperatures, isolated lower-income elderly are most at risk". San Francisco Chronicle.
  27. Steinhauer, Jennifer (July 28, 2006). "In California, Heat Is Blamed for 100 Deaths". The New York Times.
  28. Heat Wave Proving Deadly for Pets, KCBS, San Leandro, Calif., posted July 24
  29. California's Cattle Death Toll Surpasses 25,000 [ permanent dead link ] USAgNet, July 31, 2006.
  30. High Nighttime Temperatures Set Records Too, Los Angeles Times, July 25, 2006
  31. Bay Area Record Breaking Heat [ permanent dead link ], National Oceanic and Atmospheric Administration
  32. Klatell, James (July 25, 2006). "California Heat Wave Nears End". CBS News.
  33. New York, Boston Brace for Record-Breaking Heat Wave, by Shannon D. Harrington, Bloomberg LP, August 1, 2006
  34. Martin, Nick (August 1, 2006). "Warnings issued as East Coast residents expect record temps". USA Today.
  35. "Stifling heat wave spreads over eastern U.S." NBC News. August 1, 2006.
  36. "Soaring heat halts racing Wednesday at Saratoga Race Course". The Business Review (Albany). August 2, 2006.
  37. National Weather Service Climate, Bismarck, N.D.
  38. Watson, Sara Kiley. "The hottest days in history and record temperatures in each US state". Insider. Retrieved 21 August 2020.
  39. Heat wave continued for parts of South, Murray Evans, Associated Press, as reported in the Houston Chronicle, August 7, 2006.
  40. Daily Data
  41. Saunders, Terri (July 5, 2010). "Utilities confident they can handle hydro demand". Toronto Sun.
  42. "Ontario hits record high for power use". CBC News . 2006-08-01. Archived from the original on 2022-01-06.
  43. "2 killed in Quebec storm, thousands without power". CBC News . 2006-08-02. Archived from the original on 2023-04-11.
  44. Klinenberg, Eric. (2002). Heat Wave: A Social Autopsy of Disaster in Chicago. Chicago, IL: Chicago University Press. ISBN   9780226276182
  45. "Heat–The Number One Non-Severe Weather Related Killer In The United States". NOAA Magazine. August 2, 2006. Archived from the original on August 8, 2006. Retrieved August 8, 2006.