You can help expand this article with text translated from the corresponding article in Chinese. (January 2019)Click [show] for important translation instructions.
Machine translation, like DeepL or Google Translate, is a useful starting point for translations, but translators must revise errors as necessary and confirm that the translation is accurate, rather than simply copy-pasting machine-translated text into the English Wikipedia.
Do not translate text that appears unreliable or low-quality. If possible, verify the text with references provided in the foreign-language article.
You must provide copyright attribution in the edit summary accompanying your translation by providing an interlanguage link to the source of your translation. A model attribution edit summary is Content in this edit is translated from the existing Chinese Wikipedia article at [[:zh:臺灣空氣污染]]; see its history for attribution.
You may also add the template {{Translated|zh|臺灣空氣污染}} to the talk page.
The urban landscape in a suburb of Taipei on 15 April 2010, seemingly featuring heavy air pollution.
Air pollution in Taiwan is mostly derived from sources of domestic combustion, primarily the burning of fossil fuels.[1] Taiwan's topography has been noted to be a contributing factor to its air pollution problem, leading to poor dispersal and trapping pollutants. Taipei, Taiwan's capital and largest city for example, is surrounded by mountains, and other industrial centers along the northern and western coasts of Taiwan are surrounded by high mountains.[2]
In March 2014, Taiwanese legislators and the Taiwan Healthy Air Action Alliance claimed, based on reports by the World Health Organization, that the air quality in Taiwan was the worst out of the Four Asian Tigers. Attention was mainly drawn to the annual mean PM10 level of Taiwan's air (54 micrograms per cubic meter). This annual mean of Taipei (47.1 micrograms per cubic meter), made the city rank 1,089 out of 1,600 when compared to the air quality of other cities around the world.[3] Based on 2004 data by Taiwan's Department of Environmental Protection, the annual mean PM10 level for Taiwan had, for the last decade, been worse than the European Union limit value (40 micrograms per cubic meter) every year.[4]
Fugitive dust
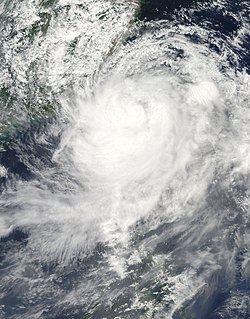
A picture of 4 June 2013 showing a landslide reportedly caused by the Nantou earthquake of 2 June 2013.Satellite imagery of 9 August 2009 showing typhoon Morakot over Taiwan. Southern Taiwan is reported to have recorded a record 244 centimetres (8.01ft) of rain, causing flooding and landslides.
In the winter of 2013-2014, the Environmental Protection Administration's (EPA) Department of Environmental Monitoring and Information Management, examined the air pollution of the country. It was revealed that stations in Yunlin, Chiayi and Greater Tainan, had the worst pollution concentrations. According to the EPA Department's Deputy Director, Chang Shuenn-chin (張順欽), this pollution is primarily caused by fugitive dust found at the riverbanks during the low-flow season of winter. These particles — suspended in the air by wind action and human activities — can be stirred up by the strong northeastern winds occurring in winter. This is also known as the northeastern monsoon. Therefore, wind speeds exceeding three meters per second are likely to cause gusts of fugitive dust with PM10 concentration levels above 250μg/m3. High maximum readings in PM10 concentration levels in Yunlin County's Lunbei Township (崙背) in 2015 (2,532μg/m3) and in Chiayi County's Puzih City (朴子) in 2009 (1,793μg/m3) and; in 2013; in Puzih (497μg/m3) and in Lunbei (497μg/m3) are claimed to be heavily influenced by heavy rainfall and mudslides during Typhoon Morakot in 2009 as well as by the 6.2 MwJune 2013 Nantou earthquake. Earthquakes can shake up loose soil on upstream slope areas. This can later be washed downstream by torrential rains during the summer thereby increasing the likelihood for land collapse and mud slides, which in turn creates dust on riverbanks.[5]
PM2.5
With regards to research conducted on PM2.5 particles in Taiwan, the National Taiwan University in March 2015 claimed that traffic is the major source of air pollutants in Taipei. In central Taiwan, on the other hand, fine particles are primarily produced by thermal power plants.
While presenting this research, the National Taiwan University stated that the annual mean concentration of PM2.5 particles in Taipei City and New Taipei City is 20μg/m3, while being 30μg/m3 in Kaohsiung. Further more, in greater Taipei, the outdoor PM2.5 concentration in the air at ground-level up until the height of three-stories is around ten to twenty times higher than the concentration in the air at the height of four-story buildings and above. Levels of other hazardous suspended particles such as silicon and iron were all found to be significantly lower with increasing altitude. Professor Chang-Fu Wu (吳章甫) of the same university attributed this to dust and traffic pollution.
The normative limit value of PM2.5 in Taiwan is set at 15μg/m3, which is no longer the same standard as that of the United States, having revised its standard to 12μg/m3 in 2013.[6] The WHO suggested maximum exposure limit is lower still at 10μg/m3.[7]
By November 2015, it was claimed that the EPA's PM2.5 Index indicated poor air qualities for almost one-third of Taiwan's cities for more than one hundred days that year, with Nantou topping the list at 147 such days. On November 8, central Taiwan, along with the Yunlin and Chiayi regions, reached the hazardous purple alert.[8]
Based on data from 2016, the Environmental group Air Clean Taiwan claimed in 2017 that Kaohsiung's Zuoying District, Yunlin's Lunbei Township and Pingtung were amongst the worst affected city (districts) in the country, with Lunbei topping the list regarding high levels of PM2.5, often prompting the red and purple alerts issued by the EPA.[9]
NO2
In 2004, data was presented by Taiwan's Department of Environmental Protection. The data showed that during the last decade, the average annual mean concentration of Nitrogen Dioxide NO2 in Taiwan had equally surpassed the European Union limit value of 40 micrograms per cubic meter, every consecutive year.[4]
SO2
Sulfur dioxide (SO2) is a gas primarily released into the air when fossil fuels like coal and oil are burned, especially in power plants and industrial facilities. High SO2 levels can lead to the formation of fine particulate matter, which can harm respiratory health, particularly for those with asthma. Additionally, SO2 can lower visibility, creating haze that impacts scenic areas.[10]
Sources of pollution
Cross-border pollution from China
MODIS imagery, captured by NASA's Terra satellite on 7 January 2002, showing most of south-eastern China being covered in a thick greyish shroud of aerosol pollution (a phenomenon which had been ongoing for several weeks). The smog extends eastwards, blanketing Taiwan.SeaWiFS imagery of 15 February 2004 showing a continuing haze of air pollution concentrated over eastern China and blowing over eastwards to areas such as Taiwan.
In February 2014, the Environmental Protection Administration's (EPA) Department of Environmental Monitoring and Information Management Director Chu Yu-chi (朱雨其) claimed there had been seven haze and dust storms since December 2013, some of which may be linked to regional phenomena like Asian Dust. Chu also reported that, for the largest part based on recent weather phenomena and air pollutant monitoring data from China's major cities, China's air pollution generally deteriorates the air quality in Taiwan significantly every winter. The EPA concluded that air pollutants brought in from China by strong winds was directly responsible for drastically rising the detected concentration levels of particles under 2.5 micrometers in diameter (PM2.5) at close to all of Taiwan's seventy-six monitoring stations. During the periods of cross-border haze, referring to pollution blown over from China, the pollution standards index (PSI) readings — which are based on the highest concentration value of five major air pollutants PM10 (particulate matter 10 micrometers or less in diameter), sulfur dioxide, nitrogen dioxide, carbon monoxide and ground-level ozone — at most stations reached unhealthy levels, while some stations in central and southern Taiwan even reached hazardous levels.
During those winter months, short-term health hazards due to the northeastern winds included mild symptoms of eye irritation, sneezing or coughing.[5] Epidemiological statistics also show that the short-term increase of air pollutant levels during the winter coincide with sudden spikes in hospitalization for cerebrovascular disease.[7]
With regards to spikes in PM10 particles concentration during periods of strong winds in the winter, fugitive dust and phenomena such as earthquakes, typhoons and other domestic geographical or meteorological factors must be taken into account.
The Taichung Power Plant at various dates, seemingly featuring polluted air surrounding it.
13 October 2007.
16 April 2010.
Some buildings of the heavily polluting Sixth Naphtha Cracker Plant of the Formosa Plastics GroupMail-Liao Industrial Complex in northwestern Yunlin County, Taiwan, on 15 March 2014.
During warnings by the scientific community about increasing prevalence of lung cancer in Taiwan in December 2015, it was claimed that Taichung Power Plant (operated by Taiwan Power Company), along with the Sixth Naphtha Cracking Plant of the Formosa Plastics Group account for roughly seventy percent of the air pollution in the Central Taiwan region of the country, emitting large quantities of sulfur oxides.[11]
Scooters
Many people travelling by scooters in Taipei, reportedly going home after the New Year's Eve celebrations of 31 December 2006/1 January 2007.
In a 1996 article, it was claimed that there were 8.8 million motorcycles and 4.8 million cars on Taiwan's roads, with motorcycles being called the primary means of transport for the majority of the island's adult population. Motorcycles with two-stroke engines were claimed to be the biggest single source of vehicular pollution in Taiwan, while also being the majority of the motorcycles operating in Taiwan.
You Yii-der of the Environmental Protection Foundation and Jay Fang of the Green Consumer Foundation were noted to propagate that all motorcycles powered by two-stroke engines should be banned.[12]
Religious rituals
In 2014 a study by Academia Sinica's Research Center for Environmental Changes claimed that, due to the burning of ghost money (also known as Joss paper) and incense during religious ceremony days (occurring mostly on the first and 15th days of the lunar calendar month), values of PM10 particles at large temples are at five to sixteen times the normal value of a regular household's environment. Equally, due to the burning of ghost money and incense, the households of communities with a nearby temple show an increase in PM2.5 particles value at an average of 15.1 micrograms per cubic meter.[13]
Smoke from burning plants has traditionally been used as a natural mosquito repellent and is also common in religious rituals. In Taiwan, substances such as wormwood, agarwood incense, and joss paper are burned during festivals and ceremonies. Some believe that the smoke may help reduce insect-borne diseases due to its repellent properties. However, burning these materials can contribute to air pollution, particularly in enclosed spaces, as the smoke contains fine particulate matter that may affect respiratory health. Researchers have noted that while the smoke releases insect-repelling volatile compounds, these are unlikely to cause significant harm at typical exposure levels. The primary concern is the fine particles present in the smoke rather than the repellent chemicals themselves.[14]
Monitoring
Taiwan Air Quality Monitoring Network (TAQMN)
When the domestic Environmental Protection Administration's (EPA) Taiwan Air Quality Monitoring Network (TAQMN) was established in 1990, it entailed nineteen air quality monitoring stations, having increased to sixty-six in 1993 and to seventy-two in 1998. In 2003, the pollutants which it monitored included NO2, CO, PM, O3, SO2 and HCs.[4]
In November 2015, the Conservation Mothers Foundation criticized the EPA, arguing that it was urging people to stay at home during periods of bad air quality, when they should rather be "inspecting and fining the major parties responsible for air pollution".[8]
Alongside the Taiwan Air Quality Monitoring Network (TAQMN), Taiwan employs AirBoxes, affordable sensors that track local air quality. Despite being less precise than the EPA’s monitoring stations due to their use of optical sensors, AirBoxes compensate with their extensive reach and frequent five-minute data updates, offering broad spatial and temporal coverage. By combining AirBox data with government monitoring station data through advanced data fusion techniques, Taiwan enhances the precision of its pollution assessments. This integrated approach offers finer spatial resolution and helps pinpoint localized pollution patterns more effectively.[15]
Solving Taiwan's Air Pollution
For a long time now, there have been serious issues with air pollution in the central and southern regions of Taiwan.[16] In hopes of rectifying this issues, in 2017 Taiwan Healthy Air Action Alliance launched the "Anti-Air Pollution and Blue Sky Parade".[17][18] The Director of Environmental Protection, Li Yingyuan, responded to an appeal stating "the actual air pollution of China Steel, Taipower, and China National Petroleum Corporation have all been reduced. Please join our Environmental Group and supervise the amount of emission. It is, however, difficult to reduce emissions by 50% within 3 years. Instead we can reduce emissions by 25%. In terms of PM2.5, that can be reduced to 18 micrograms in 2020".[19]
The Tsai Ing-wen government has agreed to conduct a health risk assessment of Dalinpu and it is in progress. As for the Linyuan area, it is considered as a health risk area; SOx and NOx have increased by 30-40%.
Taipei's Mass Rapid Transit (MRT) system: A key part of reducing air pollution in the city by offering a cleaner alternative to cars and buses, helping to lower emissions in the process.
The country's top 30 pollution sources are mainly from state-owned enterprises and other steel, electric and petrochemical companies.[20] An emission reduction management has been implemented for the top 20 factories in state-owned enterprises. Air pollution charges will also be implemented. Plans have been made to phase out diesel trucks. They will be replaced with electric trucks. Public transportation will also be used when companies are transporting things like fruits and vegetables.
Mass Rapid Transit (MRT) Expansion and its Impact
One active solution that has already been implemented is the expansion of the MRT (Mass Rapid Transit) system, which began in 1996. This expansion has contributed in mitigating urban air pollution, particularly in the metropolitan area of Taipei City, by providing a cleaner alternative to both private and public vehicles, thus lowering emissions from the transportation sector. Studies haven shown a significant reduction of approximately 1.5 times in carbon monoxide (CO) and NO2 levels between 1996 and 2012. However, the same analyses also reveal a notable increase in ozone (O3) concentration following the MRT system's expansion.[21]
Vertical Greening as a Sustainable Solution
In exploring more innovative solutions to improve air quality, vertical greening, which includes green walls and roof greening, has gained attention in recent years as a sustainable approach to improving urban environments, with examples seen in Europe, America, Singapore, and Japan. Likewise, Taiwan has also explored vertical greening, and several studies have indicated its effectiveness in enhancing building designs, particularly through green walls. In the country, green walls are commonly incorporated into both public and private spaces, with two primary types: pixel-type and vine-type. Pixel-type walls involve placing plants in designated containers or spaces, while vine-type walls use climbing plants that naturally grow along frames, making them easier to maintain. In addition to their environmental benefits, green walls can contribute to biodiversity by creating small habitats for local wildlife. They also improve air quality and have potential economic advantages, such as lowering electricity costs and enhancing property value.[22]
As Taiwan’s economy continues to expand and energy demand rises, particularly with the government’s focus on non-nuclear energy, the Taichung and Datan Thermal Power Plants have become key players in the country’s power grid. Taipower reports that thermal power generation has steadily increased, making up 79.18% of Taiwan's total energy supply in 2019 with almost 80% of Taiwan's electricity generated by thermal power plants, their contribution has played a major role in exacerbating air pollution. To address this, efforts to reduce electricity use, limit the greenhouse effect, and lower indoor temperatures to decrease air conditioning demand are becoming increasingly important.[22]
Government Investments in Pollution Prevention
Gong Mingxin, the Deputy Minister of Government Affairs of the Ministry of Economic Affairs, said that state-owned enterprises such as Taipower, China Petroleum and Zhonglong will have to invest about 58.4 billion Taiwan dollars to implement pollution prevention. These enterprises will also have to improve their production processes in hopes of reducing emissions by 20 to 40%. This is just the start, there are more improvement plans that need to be discussed.[18]
Impact of Local Government Investment and Regional Cooperation on Air Quality
A study on the country's air pollution management have suggested that government spending can influence air quality. It examined air pollution management across 20 counties in Taiwan from 2013 to 2018, revealing that local government investments in environmental protection was associated with lower PM2.5 levels. The impact was greater when local funding was backed by resources from the central government. The study further highlighted that pollution in one county could be affected by neighboring areas, suggesting that regional cooperation might be key to tackling air quality issues effectively. According to additional data from Taiwan’s Environmental Protection Administration, both PM2.5 and SO2 emissions have been on the decline, especially in central and southern regions. Southern Taiwan still records the highest levels of SO2, while the eastern part of the island enjoys the cleanest air, with the lowest concentrations of both pollutants. The data highlights the potential benefits of increasing investments in environmental protection, better managing industrial emissions, and addressing issues like the frequency of fires, all of which could further contribute to improving air quality.[23]
1 2 3 Schwela, Dieter; Haq, Gary; Huizenga, Cornie; Han, Wha-Jin; Fabian, Herbert; Ajero, May (2006). Urban Air Pollution in Asian Cities: Status, Challenges and Management. Stockholm Environment Institute and the Clean Air Initiative for Asian Cities. London: Earthscan. ISBN978-1-84407-375-7.
This page is based on this Wikipedia article Text is available under the CC BY-SA 4.0 license; additional terms may apply. Images, videos and audio are available under their respective licenses.


 13 October 2007.
 16 April 2010.


