Bayabas, Surigao del Sur

Last updated

Bayabas
Municipality of Bayabas
Bayabas surigao del sur 1.jpg
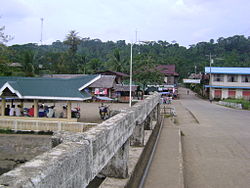
Highway showing a bridge on the main road of Bayabas
Flag of Bayabas, Surigao del Sur.png
Bayabas surigao del sur.jpg
Etymology: Guava
Ph locator surigao del sur bayabas.png
Map of Surigao del Sur with Bayabas highlighted
OpenStreetMap
Bayabas, Surigao del Sur
Philippines location map (square).svg
Red pog.svg
Bayabas
Location within the Philippines
Coordinates: 8°58′04″N126°16′54″E / 8.9678°N 126.2817°E / 8.9678; 126.2817
Country Philippines
Region Caraga
Province Surigao del Sur
District 1st district
Barangays 7 (see Barangays)
Government
[1]
  Type Sangguniang Bayan
   Mayor Apolonio B. Lozada
   Vice Mayor Maria Clarita Garcia-Limbaro
   Representative Romeo S. Momo Sr.
   Electorate 7,226 voters (2025)
Area
[2]
  Total
117.84 km2 (45.50 sq mi)
Elevation
31 m (102 ft)
Highest elevation
275 m (902 ft)
Lowest elevation
0 m (0 ft)
Population
 (2024 census) [3]
  Total
9,016
  Density77/km2 (200/sq mi)
   Households
2,133
Economy
   Income class 5th municipal income class
   Poverty incidence
37.53
% (2021) [4]
   Revenue 115.2 million (2022)
   Assets 218.7 million (2022)
   Expenditure 96.81 million (2022)
   Liabilities 90.07 million (2022)
Service provider
  ElectricitySurigao del Sur 2 Electric Cooperative (SURSECO 2)
Time zone UTC+8 (PST)
ZIP code
8303
PSGC
IDD : area code +63(0)86
Native languages Surigaonon
Agusan
Cebuano
Tagalog
Website www.bayabas.gov.ph

Bayabas, officially the Municipality of Bayabas (Surigaonon: Lungsod nan Bayabas; Tagalog : Bayan ng Bayabas), is a municipality in the province of Surigao del Sur, Philippines. According to the 2020 census, it has a population of 8,979 people, making it the least populated municipality in the province. [5]

Contents

History

World War II

During 1943 and 1944 much of the east coast of Mindanao was occupied by the Japanese. Bayabas was not occupied, although at times Japanese navy ships anchored in the harbor off the coast of the town. As the Japanese occupied an increasing number of area coastal towns, refugees trickled into town. The prewar rector of San Nicolas School, in Surigao City, was one of a number of priests who sought refuge in Bayabas. Food supplies soon failed to reach town from the outside, since Japanese troops disrupted distribution. [6]

Geography

Bayabas is located between Tago and Cagwait. The Tago River separates the municipalities of Tago and Bayabas. Bayabas is consist of seven barangays mostly located along the coastlines. Though Bayabas is a small municipality, it is also abundant in natural resources especially seafoods.

Barangays

Bayabas seawall Bayabas surigao del sur 2.jpg
Bayabas seawall

Bayabas is politically subdivided into 7 barangays. Each barangay consists of puroks while some have sitios.

Climate

Climate data for Bayabas
MonthJanFebMarAprMayJunJulAugSepOctNovDecYear
Mean daily maximum °C (°F)28.9
(84.0)
29.1
(84.4)
30.0
(86.0)
31.0
(87.8)
31.8
(89.2)
31.7
(89.1)
31.7
(89.1)
32.0
(89.6)
32.0
(89.6)
31.4
(88.5)
30.5
(86.9)
29.5
(85.1)
30.8
(87.4)
Daily mean °C (°F)25.6
(78.1)
25.6
(78.1)
26.3
(79.3)
27.0
(80.6)
27.7
(81.9)
27.5
(81.5)
27.4
(81.3)
27.7
(81.9)
27.6
(81.7)
27.2
(81.0)
26.6
(79.9)
26.0
(78.8)
26.9
(80.3)
Mean daily minimum °C (°F)22.3
(72.1)
22.2
(72.0)
22.6
(72.7)
23.0
(73.4)
23.7
(74.7)
23.4
(74.1)
23.2
(73.8)
23.4
(74.1)
23.2
(73.8)
23.1
(73.6)
22.8
(73.0)
22.6
(72.7)
23.0
(73.3)
Average rainfall mm (inches)730
(28.7)
616
(24.3)
456
(18.0)
328
(12.9)
260
(10.2)
181
(7.1)
186
(7.3)
152
(6.0)
169
(6.7)
208
(8.2)
454
(17.9)
629
(24.8)
4,369
(172.1)
Source: Climate-Data.org [7]

Bayabas has a tropical rainforest climate (Af) with heavy to very heavy rainfall year-round and with extremely heavy rainfall in January.

Demographics

Population census of Bayabas
YearPop.±% p.a.
1970 4,810    
1975 4,859+0.20%
1980 5,881+3.89%
1990 6,259+0.62%
1995 6,423+0.49%
2000 7,706+3.98%
2007 7,439−0.49%
2010 7,779+1.64%
2015 8,164+0.92%
2020 8,979+2.02%
2024 9,016+0.10%
Source: Philippine Statistics Authority [8] [9] [10] [11] [12]

Economy

Poverty incidence of Bayabas

10
20
30
40
50
60
2000
55.63
2003
56.29
2006
44.30
2009
39.44
2012
28.73
2015
41.10
2018
31.10
2021
37.53

Source: Philippine Statistics Authority [13] [14] [15] [16] [17] [18] [19] [20]

References

  1. Municipality of Bayabas | (DILG)
  2. "2015 Census of Population, Report No. 3 – Population, Land Area, and Population Density" (PDF). Philippine Statistics Authority. Quezon City, Philippines. August 2016. ISSN   0117-1453. Archived (PDF) from the original on May 25, 2021. Retrieved July 16, 2021.
  3. "2024 Census of Population (POPCEN) Population Counts Declared Official by the President". Philippine Statistics Authority. July 17, 2025. Retrieved July 18, 2025.
  4. "PSA Releases the 2021 City and Municipal Level Poverty Estimates". Philippine Statistics Authority. April 2, 2024. Retrieved April 28, 2024.
  5. "2024 Census of Population (POPCEN) Population Counts Declared Official by the President". Philippine Statistics Authority. July 17, 2025. Retrieved July 18, 2025.
  6. Virginia Hansen Holmes, Guerrilla Daughter (Kent, Ohio: Kent State U. Press, 2009), pp. 141-1, 166, 205.
  7. "Climate: Bayabas". Climate-Data.org. Retrieved October 26, 2020.
  8. "2024 Census of Population (POPCEN) Population Counts Declared Official by the President". Philippine Statistics Authority. July 17, 2025. Retrieved July 18, 2025.
  9. Census of Population (2015). "Caraga". Total Population by Province, City, Municipality and Barangay. Philippine Statistics Authority . Retrieved June 20, 2016.
  10. Census of Population and Housing (2010). "Caraga" (PDF). Total Population by Province, City, Municipality and Barangay. National Statistics Office . Retrieved June 29, 2016.
  11. Censuses of Population (1903–2007). "Caraga". Table 1. Population Enumerated in Various Censuses by Province/Highly Urbanized City: 1903 to 2007. National Statistics Office.
  12. "Province of". Municipality Population Data. Local Water Utilities Administration Research Division. Retrieved December 17, 2016.
  13. "Poverty incidence (PI):". Philippine Statistics Authority. Retrieved December 28, 2020.
  14. "Estimation of Local Poverty in the Philippines" (PDF). Philippine Statistics Authority. November 29, 2005.
  15. "2003 City and Municipal Level Poverty Estimates" (PDF). Philippine Statistics Authority. March 23, 2009.
  16. "City and Municipal Level Poverty Estimates; 2006 and 2009" (PDF). Philippine Statistics Authority. August 3, 2012.
  17. "2012 Municipal and City Level Poverty Estimates" (PDF). Philippine Statistics Authority. May 31, 2016.
  18. "Municipal and City Level Small Area Poverty Estimates; 2009, 2012 and 2015". Philippine Statistics Authority. July 10, 2019.
  19. "PSA Releases the 2018 Municipal and City Level Poverty Estimates". Philippine Statistics Authority. December 15, 2021. Retrieved January 22, 2022.
  20. "PSA Releases the 2021 City and Municipal Level Poverty Estimates". Philippine Statistics Authority. April 2, 2024. Retrieved April 28, 2024.