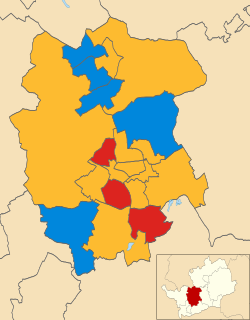
The 2003 Cherwell District Council election took place on 1 May 2003 to elect members of Cherwell District Council in Oxfordshire, England. One third of the council was up for election and the Conservative party stayed in overall control of the council. [1]
Non-metropolitan districts, or colloquially "shire districts", are a type of local government district in England. As created, they are sub-divisions of non-metropolitan counties in a two-tier arrangement.
Oxfordshire is a county in South East England. The ceremonial county borders Warwickshire to the north-west, Northamptonshire to the north-east, Buckinghamshire to the east, Berkshire to the south, Wiltshire to the south-west and Gloucestershire to the west.
England is a country that is part of the United Kingdom. It shares land borders with Wales to the west and Scotland to the north-northwest. The Irish Sea lies west of England and the Celtic Sea lies to the southwest. England is separated from continental Europe by the North Sea to the east and the English Channel to the south. The country covers five-eighths of the island of Great Britain, which lies in the North Atlantic, and includes over 100 smaller islands, such as the Isles of Scilly and the Isle of Wight.
Before the election the Conservatives were expected to lose seats after a recent large council tax rise. [2] The results saw the Conservative keep a majority but suffer a net loss of 3 seats after losing 2 seats each to Labour and the Liberal Democrats. [3] The Labour winners included John Hanna who won by 44 votes after losing in the 2002 election by 8 votes. [3] However the Conservatives did gain a seat in Banbury Grimsbury & Castle from Labour for the first in over 20 years. [3] Meanwhile, the National Front stood a candidate for the first time to Cherwell Council and said that they would stand in all of the Bicester wards in the next election in 2004. [3]
The Labour Party is a centre-left political party in the United Kingdom which has been described as an alliance of social democrats, democratic socialists and trade unionists. The party's platform emphasises greater state intervention, social justice and strengthening workers' rights.
The Liberal Democrats are a liberal political party in the United Kingdom. They presently have 11 Members of Parliament in the House of Commons, 96 members of the House of Lords, and one member of the European Parliament. They also have five Members of the Scottish Parliament and a member each in the Welsh Assembly and London Assembly. The party reached the height of its influence in the early 2010s, forming a junior partner in a coalition government from 2010 to 2015. It is presently led by Vince Cable.
Banbury is a historic market town on the River Cherwell in Oxfordshire, England. The town is situated 64 miles (103 km) northwest of London, 37 miles (60 km) southeast of Birmingham, 25 miles (40 km) south-by-southeast of Coventry and 22 miles (35 km) north-by-northwest of the county town of Oxford. It had a population of 46,853 at the 2011 census.
After the election, the composition of the council was
Party | Seats | Gains | Losses | Net gain/loss | Seats % | Votes % | Votes | +/− | |
---|---|---|---|---|---|---|---|---|---|
Conservative | 9 | 1 | 4 | -3 | 56.3 | 47.7 | 9,457 | -3.6% | |
Labour | 4 | 2 | 1 | +1 | 25.0 | 25.4 | 5,034 | -6.3% | |
Liberal Democrat | 3 | 2 | 0 | +2 | 18.8 | 23.8 | 4,719 | +7.8% | |
Independent | 0 | 0 | 0 | 0 | 0 | 1.5 | 306 | +1.1% | |
Green | 0 | 0 | 0 | 0 | 0 | 0.8 | 155 | +0.2% | |
National Front | 0 | 0 | 0 | 0 | 0 | 0.7 | 142 | +0.7% |
Party | Candidate | Votes | % | ± | |
---|---|---|---|---|---|
Conservative | Andrew Fulljames | 517 | 73.6 | +8.7 | |
Liberal Democrat | Ralph Rookwood | 185 | 26.4 | +1.5 | |
Majority | 332 | 47.2 | +7.2 | ||
Turnout | 702 | ||||
Conservative hold | Swing |
Party | Candidate | Votes | % | ± | |
---|---|---|---|---|---|
Liberal Democrat | Richard Makepeace | 718 | 51.2 | ||
Conservative | Terence Miall | 684 | 48.8 | ||
Majority | 34 | 2.4 | |||
Turnout | 1,402 | ||||
Liberal Democrat gain from Conservative | Swing | ||||
Party | Candidate | Votes | % | ± | |
---|---|---|---|---|---|
Conservative | Nigel Morris | 870 | 47.9 | ||
Labour | David Bullock | 340 | 18.7 | ||
Independent | Gordon Gerry | 306 | 16.8 | ||
Liberal Democrat | Daphne Nash | 223 | 12.3 | ||
Green | Michael Cull-Dodd | 79 | 4.3 | ||
Majority | 530 | 29.2 | |||
Turnout | 1,818 | ||||
Conservative hold | Swing |
Party | Candidate | Votes | % | ± | |
---|---|---|---|---|---|
Conservative | Stephen Back | 704 | 50.7 | ||
Labour | Gordon Ross | 684 | 49.3 | ||
Majority | 20 | 1.4 | |||
Turnout | 1,388 | ||||
Conservative gain from Labour | Swing | ||||
Party | Candidate | Votes | % | ± | |
---|---|---|---|---|---|
Conservative | Nicholas Turner | 504 | 60.4 | ||
Labour | Andrew Coles | 331 | 39.6 | ||
Majority | 173 | 20.8 | |||
Turnout | 835 | ||||
Conservative hold | Swing |
Party | Candidate | Votes | % | ± | |
---|---|---|---|---|---|
Labour | Janet Justice | 676 | 50.9 | ||
Conservative | Keith Strangwood | 652 | 49.1 | ||
Majority | 24 | 1.8 | |||
Turnout | 1,328 | ||||
Labour hold | Swing |
Party | Candidate | Votes | % | ± | |
---|---|---|---|---|---|
Labour | John Hanna | 542 | 46.6 | ||
Conservative | Anthony Kempton | 498 | 42.8 | ||
Liberal Democrat | Olatunde Afilaka | 124 | 10.7 | ||
Majority | 44 | 3.8 | |||
Turnout | 1,164 | ||||
Labour gain from Conservative | Swing | ||||
Party | Candidate | Votes | % | ± | |
---|---|---|---|---|---|
Conservative | Eamonn Gilmore | 564 | 57.4 | ||
Labour | Wendy Spencer | 273 | 27.8 | ||
Liberal Democrat | Stephen Creed | 146 | 14.9 | ||
Majority | 291 | 29.6 | |||
Turnout | 983 | ||||
Conservative hold | Swing |
Party | Candidate | Votes | % | ± | |
---|---|---|---|---|---|
Conservative | Rose Stratford | 405 | 42.6 | ||
Liberal Democrat | Nicholas Cotter | 387 | 40.7 | ||
Labour | Nicholas Cherry | 159 | 16.7 | ||
Majority | 18 | 1.9 | |||
Turnout | 951 | ||||
Conservative hold | Swing |
Party | Candidate | Votes | % | ± | |
---|---|---|---|---|---|
Conservative | Diana Edwards | 564 | 52.3 | ||
Labour | John Broad | 341 | 31.6 | ||
Liberal Democrat | Neil Walton | 173 | 16.0 | ||
Majority | 223 | 20.7 | |||
Turnout | 1,078 | ||||
Conservative hold | Swing |
Party | Candidate | Votes | % | ± | |
---|---|---|---|---|---|
Labour | Leslie Sibley | 774 | 43.3 | ||
Conservative | Russell Hurle | 690 | 38.6 | ||
Liberal Democrat | Lorraine Read | 181 | 10.1 | ||
National Front | James Starkey | 142 | 7.9 | ||
Majority | 84 | 4.7 | |||
Turnout | 1,787 | ||||
Labour gain from Conservative | Swing | ||||
Party | Candidate | Votes | % | ± | |
---|---|---|---|---|---|
Conservative | Rosemarie Higham | 704 | 77.5 | ||
Liberal Democrat | Peter Davis | 204 | 22.5 | ||
Majority | 500 | 55.0 | |||
Turnout | 908 | ||||
Conservative hold | Swing |
Party | Candidate | Votes | % | ± | |
---|---|---|---|---|---|
Conservative | Derrick Gasson | 597 | 77.6 | ||
Liberal Democrat | Martin Squires | 172 | 22.4 | ||
Majority | 425 | 55.2 | |||
Turnout | 769 | ||||
Conservative hold | Swing |
Party | Candidate | Votes | % | ± | |
---|---|---|---|---|---|
Liberal Democrat | John Wyse | 786 | 54.6 | ||
Conservative | Susan Goodgame | 408 | 28.4 | ||
Labour | Catharine Arakelian | 245 | 17.0 | ||
Majority | 378 | 26.2 | |||
Turnout | 1,439 | ||||
Liberal Democrat hold | Swing |
Party | Candidate | Votes | % | ± | |
---|---|---|---|---|---|
Labour | John Stansby | 669 | 37.6 | ||
Liberal Democrat | Devena Rae | 602 | 33.9 | ||
Conservative | Barry Carter | 507 | 28.5 | ||
Majority | 67 | 3.7 | |||
Turnout | 1,778 | ||||
Labour hold | Swing |
Party | Candidate | Votes | % | ± | |
---|---|---|---|---|---|
Liberal Democrat | Paul Evans | 818 | 55.2 | ||
Conservative | Maurice Billington | 589 | 39.7 | ||
Green | Nicholas Goodwin | 76 | 5.1 | ||
Majority | 229 | 15.5 | |||
Turnout | 1,483 | ||||
Liberal Democrat gain from Conservative | Swing | ||||
The 2002 Redditch Borough Council election of 2 May 2002 elected members of Redditch Borough Council in the West Midlands region, England. One third of the council stood for re-election and the Labour party lost overall control of the council to no overall control for the first time in many years.
The 2003 Redditch Borough Council election took place on 1 May 2003 to elect members of Redditch Borough Council in the West Midlands region, England. One third of the council was up for election and the council stayed under no overall control.
Elections to Barrow-in-Furness Borough Council was held on 1 May 2008. The whole of the council was up for election, with the number of councillors falling from 38 to 36, as a result of ward boundary changes enacted in February 2008. Councillors were elected for terms ranging between two and four years; where more than one councillor was elected in a ward, the councillor with the highest number of votes was granted the longer term.
The 2003 Worthing Borough Council election took place on 1 May 2003 to elect members of Worthing Borough Council in West Sussex, England. One third of the council was up for election and the Liberal Democrats lost overall control of the council to no overall control. Overall turnout was 28.61%.
The 1998 Cherwell District Council election took place on 7 May 1998 to elect members of Cherwell District Council in Oxfordshire, England. One third of the council was up for election and the council stayed under no overall control.
The 1999 Cherwell District Council election took place on 6 May 1999 to elect members of Cherwell District Council in Oxfordshire, England. One third of the council was up for election and the council stayed under no overall control.
The 2000 Cherwell District Council election took place on 4 May 2000 to elect members of Cherwell District Council in Oxfordshire, England. One third of the council was up for election and the Conservative party gained overall control of the council from no overall control.
The 2002 Cherwell District Council election took place on 2 May 2002 to elect members of Cherwell District Council in Oxfordshire, England. The whole council was up for election with boundary changes since the last election in 2000 reducing the number of seats by 2. The Conservative party stayed in overall control of the council.
The 2006 Cherwell District Council election took place on 4 May 2006 to elect members of Cherwell District Council in Oxfordshire, England. One third of the council was up for election and the Conservative party stayed in overall control of the council.
The 2007 Cherwell District Council election took place on 3 May 2007 to elect members of Cherwell District Council in Oxfordshire, England. One third of the council was up for election and the Conservative party stayed in overall control of the council.
The 2008 Cherwell District Council election took place on 1 May 2008 to elect members of Cherwell District Council in Oxfordshire, England. One third of the council was up for election and the Conservative party stayed in overall control of the council.
The 2003 St Albans City and District Council election took place on 1 May 2003 to elect members of St Albans District Council in Hertfordshire, England. One third of the council was up for election and the council stayed under no overall control.
The 2007 St Albans City and District Council election took place on 3 May 2007 to elect members of St Albans District Council in Hertfordshire, England. One third of the council was up for election and the Liberal Democrats lost overall control of the council to no overall control.
The 1999 Burnley Borough Council election took place on 6 May 1999 to elect members of Burnley Borough Council in Lancashire, England. One third of the council was up for election and the Labour party stayed in overall control of the council.
The 2000 Burnley Borough Council election took place on 4 May 2000 to elect members of Burnley Borough Council in Lancashire, England. One third of the council was up for election and the Labour party lost overall control of the council to no overall control.
The 2003 South Tyneside Metropolitan Borough Council election took place on 1 May 2003 to elect members of South Tyneside Metropolitan Borough Council in Tyne and Wear, England. One third of the council was up for election and the Labour party kept overall control of the council.
The 2003 Southend-on-Sea Council election took place on 1 May 2003 to elect members of Southend-on-Sea Unitary Council in Essex, England. One third of the council was up for election and the Conservative party stayed in overall control of the council.
The 2008 Cheltenham Council election took place on 1 May 2008 to elect members of Cheltenham Borough Council in Gloucestershire, England. Half of the council was up for election and the council stayed under no overall control.
The 2003 Harrogate Council election took place on 1 May 2003 to elect members of Harrogate Borough Council in North Yorkshire, England. One third of the council was up for election and the council stayed under no overall control.
The 2011 Cherwell District Council election took place on 5 May 2011 to elect members of Cherwell District Council in Oxfordshire, England. One third of the council was up for election and the Conservative party stayed in overall control of the council.