Dundee West | |
---|---|
Burgh constituency for the House of Commons | |
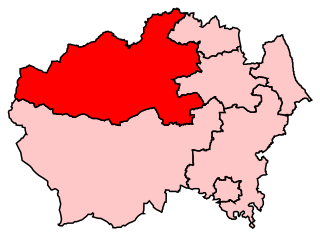
Subdivisions of Scotland | Angus/Dundee City |
Major settlements | Dundee |
Current constituency | |
Created | 1950 |
Member of Parliament | Chris Law (SNP) |
Created from | Dundee |
Dundee West is a constituency of the House of Commons of the Parliament of the United Kingdom. It elects one Member of Parliament (MP) by the first-past-the-post voting system.
The constituency was created for the 1950 general election, when the two-seat Dundee constituency was split into two single seat constituencies: Dundee East and Dundee West.
Further to the completion of the 2023 Periodic Review of Westminster constituencies, the seat will be subject to boundary changes, gaining further parts of the Dundee City council area. As a consequence, it will be renamed Dundee Central, to be first contested at the next general election. [1]
1950–1974: The County of the City of Dundee wards numbers 2, 3, 6, 7, 8, and 9.
1974–1983: The County of the City of Dundee wards of Balgay, Camperdown, Downfield, Law, Lochee, and Riverside. The constituency boundaries remained unchanged.
1983–1997: The City of Dundee District electoral divisions of Ardler/Blackside, Central/Riverside, Downfield/St Mary's, Dudhope/Logie, Gourdie/Pitalpin, Law/Ancrum, Lochee, Menziehill/Ninewells, Rockwell/Fairmuir, and Trottick/Gillburn.
1997–2005: The City of Dundee District electoral divisions of Central, Charleston, Kingsway West, Kirkton, Law, Lochee, Ninewells, Riverside, and St Mary's.
2005–present: The part of the Dundee City council area other than the Dundee East Burgh Constituency and the Angus Council ward of Sidlaw West.
The constituency is one of two covering the Dundee City council area, the other being Dundee East. Current boundaries were first used in the 2005 general election.
As well as covering a western portion of the city area, the West constituency also includes, to the north and west, part of the Angus council area. Similarly, the east constituency includes, to the north and east, another part of the Angus council area.
Prior to the 2005 election, both constituencies were entirely within the city area, and the north-eastern and north-western areas of the city were within the Angus constituency. Scottish Parliament constituencies retain the older boundaries.
Dundee West was held by the Labour Party from the first time it was contested in 1950 until the 2015 general election. Initially it was more marginal than its neighbour Dundee East. Additionally the Labour candidate always polled more than 50% of the votes cast in these contests. However, in 1959 Labour's majority over Conservative candidate was only 714 votes. This majority greatly increased at the 1963 by-election and by 1970, Labour's majority and share of the vote in Dundee West was better than the same figures in Dundee East. [2]
Labour's majority was reduced in 2005 by the SNP candidate Joe Fitzpatrick despite changes to the boundaries which should have favoured Labour; suggesting that the constituency might be becoming more marginal, although the gap widened again in 2010. The current MP is Chris Law, who was the first-ever MP from the Scottish National Party elected for Dundee West; as part of the party's near-clean sweep of the majority of Scottish seats at that year's general election.
Election | Member [3] | Party | |
---|---|---|---|
1950 | John Strachey | Labour | |
1963 by-election | Peter Doig | ||
1979 | Ernie Ross | ||
2005 | Jim McGovern | ||
2015 | Chris Law | SNP |
Party | Candidate | Votes | % | ±% | |
---|---|---|---|---|---|
SNP | Chris Law | 22,355 | 53.8 | +7.1 | |
Labour | Jim Malone | 10,096 | 24.3 | -8.8 | |
Conservative | Tess White | 5,149 | 12.4 | -3.8 | |
Liberal Democrats | Daniel Coleman | 2,468 | 5.9 | +2.8 | |
Brexit Party | Stuart Waiton | 1,271 | 3.1 | New | |
CPA | Quinta Arrey | 240 | 0.6 | New | |
Majority | 12,259 | 29.5 | +15.9 | ||
Turnout | 41,579 | 64.5 | +2.8 | ||
SNP hold | Swing | +7.1 | |||
Party | Candidate | Votes | % | ±% | |
---|---|---|---|---|---|
SNP | Chris Law [10] | 18,045 | 46.7 | -15.2 | |
Labour | Alan Cowan | 12,783 | 33.1 | +9.4 | |
Conservative | Darren Cormack | 6,257 | 16.2 | +7.6 | |
Liberal Democrats | Jenny Blain | 1,189 | 3.1 | +0.7 | |
Independent | Sean Dobson | 403 | 1.0 | New | |
Majority | 5,262 | 13.6 | -24.6 | ||
Turnout | 38,677 | 61.7 | -6.1 | ||
SNP hold | Swing | -12.3 | |||
Party | Candidate | Votes | % | ±% | |
---|---|---|---|---|---|
SNP | Chris Law | 27,684 | 61.9 | +33.0 | |
Labour | Michael Marra | 10,592 | 23.7 | −24.8 | |
Conservative | Nicola Ross | 3,852 | 8.6 | −0.7 | |
Scottish Green | Pauline Hinchion [13] | 1,225 | 2.7 | New | |
Liberal Democrats | Daniel Coleman [14] | 1,057 | 2.4 | −9.0 | |
TUSC | Jim McFarlane [15] | 304 | 0.7 | −0.3 | |
Majority | 17,092 | 38.2 | N/A | ||
Turnout | 44,714 | 67.8 | +8.9 | ||
SNP gain from Labour | Swing | +28.9 | |||
Party | Candidate | Votes | % | ±% | |
---|---|---|---|---|---|
Labour | Jim McGovern | 17,994 | 48.5 | +3.9 | |
SNP | Jim Barrie | 10,716 | 28.9 | −1.1 | |
Liberal Democrats | John Barnett | 4,233 | 11.4 | −3.0 | |
Conservative | Colin Stewart | 3,461 | 9.3 | +1.0 | |
Independent | Andy McBride | 365 | 1.0 | New | |
TUSC | Jim McFarlane | 357 | 1.0 | New | |
Majority | 7,278 | 19.6 | +5.0 | ||
Turnout | 37,126 | 58.9 | +2.8 | ||
Labour hold | Swing | +2.5 | |||
Party | Candidate | Votes | % | ±% | |
---|---|---|---|---|---|
Labour | Jim McGovern | 16,468 | 44.6 | -5.7 | |
SNP | Joe Fitzpatrick | 11,089 | 30.0 | +2.2 | |
Liberal Democrats | Nykoma Garry | 5,323 | 14.4 | +5.2 | |
Conservative | Christopher McKinlay | 3,062 | 8.3 | -0.6 | |
Scottish Socialist | Jim McFarlane | 994 | 2.7 | -1.2 | |
Majority | 5,379 | 14.6 | -7.9 | ||
Turnout | 36,936 | 56.1 | N/A | ||
Labour hold | Swing | ||||
Party | Candidate | Votes | % | ±% | |
---|---|---|---|---|---|
Labour | Ernie Ross | 14,787 | 50.6 | −3.2 | |
SNP | Gordon Archer | 7,987 | 27.3 | +4.1 | |
Conservative | Ian Hail | 2,656 | 9.1 | −4.1 | |
Liberal Democrats | Elizabeth Dick | 2,620 | 9.0 | +1.3 | |
Scottish Socialist | Jim McFarlane | 1,192 | 4.1 | New | |
Majority | 6,800 | 23.3 | -7.3 | ||
Turnout | 29,242 | 54.4 | −13.3 | ||
Labour hold | Swing | ||||
Party | Candidate | Votes | % | ±% | |
---|---|---|---|---|---|
Labour | Ernie Ross | 20,875 | 53.8 | +4.8 | |
SNP | John Dorward | 9,016 | 23.2 | −0.4 | |
Conservative | Neil Powrie | 5,015 | 13.2 | −5.3 | |
Liberal Democrats | Elizabeth Dick | 2,972 | 7.7 | +0.2 | |
Scottish Socialist | Mary Ward | 428 | 1.1 | New | |
Referendum | John MacMillan | 411 | 1.1 | New | |
Majority | 11,859 | 30.6 | +5.2 | ||
Turnout | 38,717 | 67.7 | −2.1 | ||
Labour hold | Swing | ||||
Party | Candidate | Votes | % | ±% | |
---|---|---|---|---|---|
Labour | Ernie Ross | 20,498 | 49.0 | −4.4 | |
SNP | Keith Brown | 9,894 | 23.6 | +8.3 | |
Conservative | Andrew Spearman | 7,746 | 18.5 | +0.5 | |
Liberal Democrats | Elizabeth Dick | 3,132 | 7.5 | −5.2 | |
Scottish Green | Elly Hood | 432 | 1.0 | New | |
Natural Law | Donald Arnold | 159 | 0.4 | New | |
Majority | 10,604 | 25.4 | -10.0 | ||
Turnout | 41,861 | 69.8 | -5.6 | ||
Labour hold | Swing | ||||
Party | Candidate | Votes | % | ±% | |
---|---|---|---|---|---|
Labour | Ernie Ross | 24,916 | 53.4 | +7.9 | |
Conservative | John Donnelly | 8,390 | 18.0 | -3.7 | |
SNP | Alasdair Morgan | 7,164 | 15.3 | -1.8 | |
SDP | Rosemary Lonie | 5,922 | 12.7 | -4.4 | |
Communist | Stephen Matthewson | 308 | 0.7 | New | |
Majority | 16,526 | 35.4 | +13.6 | ||
Turnout | 46,700 | 75.4 | +1.0 | ||
Labour hold | Swing | ||||
Party | Candidate | Votes | % | ±% | |
---|---|---|---|---|---|
Labour | Ernie Ross | 20,288 | 43.5 | -12.8 | |
Conservative | David Senior | 10,138 | 21.7 | -8.9 | |
SDP | Elizabeth Dick | 7,976 | 17.1 | New | |
SNP | James Lynch | 7,973 | 17.1 | +4.7 | |
Ecology | Patrick Marks | 302 | 0.6 | New | |
Majority | 10,150 | 21.8 | +1.0 | ||
Turnout | 46,677 | 74.4 | -4.0 | ||
Labour hold | Swing | ||||
Party | Candidate | Votes | % | ±% | |
---|---|---|---|---|---|
Labour | Ernie Ross | 23,654 | 47.25 | +6.24 | |
SNP | Jim Fairlie | 13,197 | 26.36 | -8.75 | |
Conservative | I. Stevenson | 12,892 | 25.75 | +7.29 | |
Communist | Raymond Mennie | 316 | 0.63 | -0.17 | |
Majority | 10,457 | 20.79 | +14.89 | ||
Turnout | 50,059 | 78.41 | +4.09 | ||
Labour hold | Swing | ||||
Party | Candidate | Votes | % | ±% | |
---|---|---|---|---|---|
Labour | Peter Doig | 19,480 | 41.01 | -2.02 | |
SNP | Jim Fairlie | 16,678 | 35.11 | +9.98 | |
Conservative | C.G. Findlay | 8,769 | 18.46 | -12.07 | |
Liberal | R. Hewett | 2,195 | 4.62 | New | |
Communist | H. McLevy | 381 | 0.80 | -0.51 | |
Majority | 2,802 | 5.90 | -7.40 | ||
Turnout | 47,503 | 74.32 | -6.94 | ||
Labour hold | Swing | ||||
Party | Candidate | Votes | % | ±% | |
---|---|---|---|---|---|
Labour | Peter Doig | 22,193 | 43.03 | -8.51 | |
Conservative | M. Tomison | 15,745 | 30.53 | -7.43 | |
SNP | Jim Fairlie | 12,959 | 25.13 | +16.42 | |
Communist | H. McLevy | 673 | 1.31 | -0.28 | |
Majority | 6,448 | 12.50 | -0.88 | ||
Turnout | 51,570 | 81.26 | +5.00 | ||
Labour hold | Swing | ||||
Party | Candidate | Votes | % | ±% | |
---|---|---|---|---|---|
Labour | Peter Doig | 26,271 | 51.54 | ||
Conservative | J.A. Payne | 19,449 | 38.16 | ||
SNP | J.A. Shepherd | 4,441 | 8.71 | New | |
Communist | H. McLevy | 809 | 1.59 | ||
Majority | 6,822 | 13.38 | |||
Turnout | 50,940 | 76.26 | |||
Labour hold | Swing | ||||
Party | Candidate | Votes | % | ±% | |
---|---|---|---|---|---|
Labour | Peter Doig | 26,705 | 53.71 | +0.37 | |
Conservative | C. A. MacNab | 18,345 | 36.90 | -7.65 | |
Liberal | J. W. Cruddas | 3,454 | 6.95 | New | |
Communist | David Bowman | 1,217 | 2.45 | +0.03 | |
Majority | 8,360 | 16.81 | +7.72 | ||
Turnout | 49,721 | 79.90 | -1.60 | ||
Labour hold | Swing | ||||
Party | Candidate | Votes | % | ±% | |
---|---|---|---|---|---|
Labour | Peter Doig | 27,090 | 53.3 | +3.7 | |
National Liberal | Henry Campbell Scarlett | 22,473 | 44.2 | -3.9 | |
Communist | David Bowman | 1,228 | 2.4 | +0.3 | |
Majority | 4,617 | 9.1 | +7.8 | ||
Turnout | 50,791 | 81.5 | -1.4 | ||
Labour hold | Swing | ||||
Party | Candidate | Votes | % | ±% | |
---|---|---|---|---|---|
Labour | Peter Doig | 22,449 | 50.6 | +1.0 | |
National Liberal | Robert Taylor | 17,494 | 39.4 | -8.9 | |
SNP | James C. Lees | 3,285 | 7.4 | New | |
Communist | David P. Bowman | 1,170 | 2.6 | +0.5 | |
Majority | 4,955 | 11.2 | +9.9 | ||
Turnout | 44,398 | 71.6 | -11.3 | ||
Labour hold | Swing | ||||
Party | Candidate | Votes | % | ±% | |
---|---|---|---|---|---|
Labour | John Strachey | 25,857 | 49.6 | -0.9 | |
Unionist | Robert R. Taylor | 25,143 | 48.3 | +1.4 | |
Communist | David P. Bowman | 1,087 | 2.1 | -0.5 | |
Majority | 714 | 1.3 | -2.3 | ||
Turnout | 52,087 | 82.9 | +0.2 | ||
Labour hold | Swing | ||||
Party | Candidate | Votes | % | ±% | |
---|---|---|---|---|---|
Labour | John Strachey | 26,082 | 50.52 | -1.08 | |
National Liberal | Gordon HM Pirie | 24,208 | 46.89 | New | |
Communist | David P. Bowman | 1,335 | 2.59 | -0.09 | |
Majority | 1,874 | 3.63 | -3.25 | ||
Turnout | 51,625 | 82.70 | -4.10 | ||
Labour hold | Swing | ||||
Party | Candidate | Votes | % | ±% | |
---|---|---|---|---|---|
Labour | John Strachey | 29,020 | 51.60 | -1.90 | |
Liberal | John Junor | 25,714 | 45.72 | +43.87 | |
Communist | David P. Bowman | 1,508 | 2.68 | New | |
Majority | 3,306 | 5.88 | -2.98 | ||
Turnout | 56,242 | 86.80 | -1.28 | ||
Labour hold | Swing | ||||
Party | Candidate | Votes | % | ±% | |
---|---|---|---|---|---|
Labour | John Strachey | 28,386 | 53.50 | N/A | |
National Liberal | Henry Scrymgeour-Wedderburn | 23,685 | 44.64 | N/A | |
Liberal | Colin James Canning | 986 | 1.86 | N/A | |
Majority | 4,701 | 8.86 | N/A | ||
Turnout | 53,057 | 88.08 | N/A | ||
Labour win (new seat) |
Brent East was a parliamentary constituency in north west London; it was replaced by Brent Central for the 2010 general election. It returned one Member of Parliament (MP) to the House of Commons of the Parliament of the United Kingdom, elected by the first past the post system.
Birmingham Hodge Hill is a constituency of part of the city of Birmingham represented in the House of Commons since 2004 by Liam Byrne, a member of the Labour Party.
Leicester South is a constituency, recreated in 1974, represented in the House of Commons of the UK Parliament since 2011 by Jonathan Ashworth of the Labour Co-op Party. A previous version of the seat existed between 1918 and 1950. Except for a 2004 by-election when it was won by the Liberal Democrats, Leicester South has been held by the Labour Party since 1987.
Ilford North is a constituency created in 1945 and represented in the House of Commons of the UK Parliament since 2015 by Wes Streeting of the Labour Party.
Carlisle is a constituency in Cumbria represented in the House of Commons of the UK Parliament since 2010 by John Stevenson of the Conservative Party.
Ochil and South Perthshire is a county constituency of the House of Commons of the Parliament of the United Kingdom. It elects one Member of Parliament (MP) by the first-past-the-post system of election.
Dundee East is a constituency of the House of Commons of the Parliament of the United Kingdom. Created for the 1950 general election, it elects one Member of Parliament (MP) by the first-past-the-post voting system.
Angus is a county constituency of the House of Commons of the Parliament of the United Kingdom. It elects one Member of Parliament (MP) by the first-past-the-post voting system. It is currently represented by Dave Doogan of the Scottish National Party who has been the MP since 2019.
Aberdeen South is a burgh constituency of the House of Commons of the Parliament of the United Kingdom and it elects one Member of Parliament (MP) by the first-past-the-post system of election.
Aberdeen North is a burgh constituency of the House of Commons of the Parliament of the United Kingdom and it elects one Member of Parliament (MP) by the first past the post system of election. It was first used in the 1885 general election, but has undergone various boundary changes since that date.
Ashfield is a constituency represented in the House of Commons of the UK Parliament by Lee Anderson of the Conservative Party. The constituency is in the English county of Nottinghamshire, East Midlands; located to the north west of the city of Nottingham in the Erewash Valley along the border with neighbouring county Derbyshire. Ashfield was part of the Red Wall which by and large, voted Conservative in the 2019 general election. In the 2016 referendum on membership of the European Union, Ashfield voted 70% in favour of Brexit.
Aldershot is a constituency in Hampshire represented in the House of Commons of the UK Parliament since 2017 by Leo Docherty, a Conservative.
Tonbridge and Malling is a constituency in Kent represented in the House of Commons of the UK Parliament since 2015 by Tom Tugendhat, a Conservative. The constituency is located in Western Kent, in South East England.
North West Durham is a constituency represented in the House of Commons of the UK Parliament since 12 December 2019 by Richard Holden of the Conservative Party.
Leicester West is a constituency represented in the House of Commons of the UK Parliament since 2010 by Liz Kendall of the Labour Party. Along with the other two Leicester seats, it was held by Labour at the 2017 general election. Since its creation in 1918 the seat has sided with parties from the left wing of politics.
Erewash is a constituency in Derbyshire represented in the House of Commons of the UK Parliament since 2015 by Maggie Throup, a Conservative.
Barking is a constituency in Greater London represented in the House of Commons of the UK Parliament. Since its formation in 1945, it has consistently returned a member of the Labour Party as its Member of Parliament (MP). Since 1994, its MP has been Margaret Hodge.
Lewisham East is a parliamentary constituency represented in the House of Commons of the UK Parliament since the by-election on 14 June 2018 by Janet Daby of the Labour Party.
Enfield North is a peripheral Greater London constituency created in 1974 and represented in the House of Commons of the UK Parliament since 2019 by Feryal Clark of the Labour Party.
Hove is a borough constituency in East Sussex represented in the House of Commons of the UK Parliament since 2015 by Labour's Peter Kyle.