Edinburgh Central | |
---|---|
Former Burgh constituency for the House of Commons | |
Subdivisions of Scotland | City of Edinburgh |
1885–2005 | |
Seats | One |
Created from | Edinburgh |
Replaced by | Edinburgh East Edinburgh North & Leith Edinburgh South West Edinburgh West |
Edinburgh Central was a burgh constituency of the House of Commons of the Parliament of the United Kingdom (at Westminster) from 1885 to 2005. It elected one Member of Parliament (MP) by the first past the post system of election.
In 1999, a Scottish Parliament constituency was created with the same name and boundaries, and continues in use. See Edinburgh Central (Scottish Parliament constituency) .
From 1925 until 1999, the Member of Parliament for the Westminster constituency was an ex officio member of the Board of Trustees of the National Library of Scotland. Since 1999, that role has been taken by the Member of the Scottish Parliament (MSP) for the Scottish Parliament constituency.
1885–1918: The Municipal Wards of St. Giles, George Square, and St. Leonard, except so much as is comprised in the Edinburgh East Division (being the part to the north of a line drawn along the centres of East and West Richmond Streets).
1918–1950: The George Square, St. Giles' and St. Leonard's Municipal Wards of Edinburgh.
1950–1955: The George Square, Holyrood, and St Giles wards of the county of the city of Edinburgh.
1955–1974: The George Square, Holyrood, and St Giles wards of the county of the city of Edinburgh; and part of Gorgie-Dalry ward.
1974–1983: The George Square, Gorgie-Dalry, Holyrood, and St Giles wards of the county of the city of Edinburgh; and part of Merchiston ward.
1983–1997: The City of Edinburgh District electoral divisions of Dalry/Shandon, Haymarket/Tollcross, Murrayfield/Dean, New Town/Stockbridge, and St Giles/Holyrood.
1997–2005: The City of Edinburgh District electoral divisions of Dalry/Shandon, Fountainbridge/Tollcross, Moat/Stenhouse, Murrayfield/Dean, and St Giles/Holyrood.
The 1997–2005 boundaries covered a central portion of the City of Edinburgh council area, including Edinburgh Old Town, the West End, Holyrood and Murrayfield. The constituency was one of six covering the city council area.
At the 2005 general election, the constituency area was divided between Edinburgh East, Edinburgh North and Leith, Edinburgh South West and Edinburgh West. [1]
Party | Candidate | Votes | % | ±% | |
---|---|---|---|---|---|
Independent Liberal | John Wilson | 2,930 | 41.9 | ||
Liberal | James Hall Renton | 1,683 | 24.1 | ||
Conservative | John Scott Napier | 1,606 | 23.0 | ||
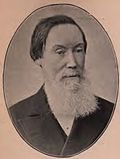
Independent Liberal | Adam William Black | 770 | 11.0 | ||
Majority | 1,247 | 17.8 | |||
Turnout | 6,989 | 84.5 | |||
Registered electors | 8,269 | ||||
Independent Liberal win (new seat) |
Party | Candidate | Votes | % | ±% | |
---|---|---|---|---|---|
Liberal | William McEwan | 3,760 | 62.7 | +38.6 | |
Liberal Unionist | John Wilson | 2,236 | 37.3 | −4.6 | |
Majority | 1,524 | 25.4 | N/A | ||
Turnout | 5,996 | 72.5 | −12.0 | ||
Registered electors | 8,269 | ||||
Liberal gain from Independent Liberal | Swing | +21.6 | |||
Party | Candidate | Votes | % | ±% | |
---|---|---|---|---|---|
Liberal | William McEwan | 3,733 | 63.0 | +0.3 | |
Liberal Unionist | Arthur Knatchbull Connell | 1,758 | 29.7 | −7.6 | |
Scottish Trades Councils (Scottish Socialist Federation) | John Wilson | 434 | 7.3 | New | |
Majority | 1,975 | 33.3 | +7.9 | ||
Turnout | 5,925 | 76.7 | +4.2 | ||
Registered electors | 7,725 | ||||
Liberal hold | Swing | +4.0 | |||
Note:The John Wilson who stood as a candidate in 1892 is not the same John Wilson that stood in 1885 and 1886 [6] [7]
Party | Candidate | Votes | % | ±% | |
---|---|---|---|---|---|
Liberal | William McEwan | Unopposed | |||
Liberal hold | |||||
Party | Candidate | Votes | % | ±% | |
---|---|---|---|---|---|
Liberal | George Mackenzie Brown | 3,028 | 55.2 | N/A | |
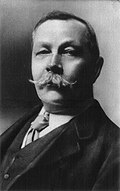
Liberal Unionist | Arthur Conan Doyle | 2,459 | 44.8 | New | |
Majority | 569 | 10.4 | N/A | ||
Turnout | 5,487 | 71.9 | N/A | ||
Registered electors | 7,630 | ||||
Liberal hold | Swing | N/A | |||
Party | Candidate | Votes | % | ±% | |
---|---|---|---|---|---|
Liberal | Charles Price | 3,935 | 67.9 | +12.7 | |
Liberal Unionist | J. Douglas G. Walker | 1,857 | 32.1 | −12.7 | |
Majority | 2,078 | 35.8 | +25.4 | ||
Turnout | 5,792 | 83.6 | +11.7 | ||
Registered electors | 6,926 | ||||
Liberal hold | Swing | +12.7 | |||
Party | Candidate | Votes | % | ±% | |
---|---|---|---|---|---|
Liberal | Charles Price | 3,965 | 66.7 | −1.2 | |
Liberal Unionist | David A. Scott | 1,980 | 33.3 | +1.2 | |
Majority | 1,985 | 33.4 | −2.4 | ||
Turnout | 5,945 | 84.9 | +1.3 | ||
Liberal hold | Swing | -1.2 | |||
Party | Candidate | Votes | % | ±% | |
---|---|---|---|---|---|
Liberal | Charles Price | 3,771 | 65.9 | −0.8 | |
Conservative | Geoffrey Reynolds Yonge Radcliffe | 1,947 | 34.1 | +0.8 | |
Majority | 1,824 | 31.8 | −1.6 | ||
Turnout | 5,718 | 81.4 | −3.5 | ||
Liberal hold | Swing | -0.8 | |||
General Election 1914–15:
Another General Election was required to take place before the end of 1915. The political parties had been making preparations for an election to take place and by the July 1914, the following candidates had been selected;
Party | Candidate | Votes | % | ±% | |
---|---|---|---|---|---|
Labour | William Graham | 7,161 | 51.3 | New | |
C | Liberal | Joseph Dobbie | 6,797 | 48.7 | −17.2 |
Majority | 364 | 2.6 | N/A | ||
Turnout | 13,958 | 45.2 | −36.2 | ||
Registered electors | 30,867 | ||||
Labour gain from Liberal | Swing | N/A | |||
Cindicates candidate endorsed by the coalition government. |
Party | Candidate | Votes | % | ±% | |
---|---|---|---|---|---|
Labour | William Graham | 12,876 | 57.9 | +6.6 | |
National Liberal | George McCrae | 9,371 | 42.1 | −6.6 | |
Majority | 3,505 | 15.8 | +13.2 | ||
Turnout | 22,247 | 71.8 | +26.6 | ||
Registered electors | 30,970 | ||||
Labour hold | Swing | +6.6 | |||
Party | Candidate | Votes | % | ±% | |
---|---|---|---|---|---|
Labour | William Graham | 13,186 | 67.9 | +10.0 | |
Liberal | Thomas Lamb | 6,225 | 32.1 | −10.0 | |
Majority | 6,961 | 35.8 | +20.0 | ||
Turnout | 19,411 | 59.7 | −12.1 | ||
Registered electors | 32,492 | ||||
Labour hold | Swing | +10.0 | |||
Party | Candidate | Votes | % | ±% | |
---|---|---|---|---|---|
Labour | William Graham | 13,628 | 60.5 | −7.4 | |
Unionist | Allan Beaton | 8,897 | 39.5 | New | |
Majority | 4,731 | 21.0 | −14.8 | ||
Turnout | 22,525 | 68.8 | +9.1 | ||
Registered electors | 32,744 | ||||
Labour hold | Swing | N/A | |||
Party | Candidate | Votes | % | ±% | |
---|---|---|---|---|---|
Labour | William Graham | 16,762 | 59.0 | −1.5 | |
Liberal | Harold Alexander | 6,745 | 23.8 | New | |
Unionist | John Mackie | 4,889 | 17.2 | −22.3 | |
Majority | 10,017 | 35.2 | +14.2 | ||
Turnout | 28,396 | 69.3 | +0.5 | ||
Registered electors | 40,975 | ||||
Labour hold | Swing | +10.4 | |||
Party | Candidate | Votes | % | ±% | |
---|---|---|---|---|---|
Unionist | James Guy | 17,293 | 59.3 | +42.1 | |
Labour | William Graham | 10,566 | 36.2 | −22.8 | |
Communist | Fred Douglas | 1,319 | 4.5 | New | |
Majority | 6,727 | 23.1 | New | ||
Turnout | 29,178 | 74.2 | +4.9 | ||
Unionist gain from Labour | Swing | +29.1 | |||
Party | Candidate | Votes | % | ±% | |
---|---|---|---|---|---|
Unionist | James Guy | 12,612 | 54.0 | −5.3 | |
Labour | Andrew Gilzean | 9,659 | 41.4 | +5.2 | |
Liberal | Richard Archibald Barlow | 1,086 | 4.6 | New | |
Majority | 2,953 | 12.6 | −11.5 | ||
Turnout | 23,357 | 64.5 | −9.7 | ||
Unionist hold | Swing | -5.2 | |||
General Election 1939–40:
Another General Election was required to take place before the end of 1940. The political parties had been making preparations for an election to take place from 1939 and by the end of this year, the following candidates had been selected;
Party | Candidate | Votes | % | ±% | |
---|---|---|---|---|---|
Unionist | Frank Watt | 4,771 | 71.0 | +17.0 | |
Ind. Labour Party | Thomas Taylor | 1,950 | 29.0 | New | |
Majority | 2,821 | 42.0 | +29.4 | ||
Turnout | 6,721 | 20.0 | −44.5 | ||
Unionist hold | Swing | N/A | |||
Party | Candidate | Votes | % | ±% | |
---|---|---|---|---|---|
Labour | Andrew Gilzean | 10,921 | 54.3 | +12.9 | |
Unionist | Frank Watt | 6,701 | 33.3 | −20.7 | |
Liberal | Norman Archibald Donald | 2,262 | 11.2 | +6.6 | |
Independent Scottish Nationalist | Hume Sleigh | 232 | 1.2 | New | |
Majority | 4,220 | 21.0 | N/A | ||
Turnout | 20,116 | 59.7 | −4.8 | ||
Labour gain from Unionist | Swing | +16.8 | |||
Party | Candidate | Votes | % | ±% | |
---|---|---|---|---|---|
Labour | Andrew Gilzean | 16,568 | 47.92 | −6.4 | |
Unionist | Frank Watt | 13,631 | 39.43 | +6.1 | |
Liberal | Leonard Gellatly | 3,446 | 9.97 | −1.2 | |
Communist | Donald Fraser Renton | 646 | 1.87 | New | |
Independent Scottish Nationalist | Hume Sleigh | 283 | 0.82 | −0.4 | |
Majority | 2,937 | 8.49 | −12.5 | ||
Turnout | 34,574 | 74.33 | +14.6 | ||
Labour hold | Swing | -6.2 | |||
Party | Candidate | Votes | % | ±% | |
---|---|---|---|---|---|
Labour | Thomas Oswald | 18,429 | 52.24 | +4.32 | |
Unionist | William J M Kean | 16,847 | 47.76 | +8.33 | |
Majority | 1,582 | 4.48 | −4.01 | ||
Turnout | 35,276 | 76.7 | +2.37 | ||
Labour hold | Swing | -2.01 | |||
Party | Candidate | Votes | % | ±% | |
---|---|---|---|---|---|
Labour | Thomas Oswald | 16,735 | 51.44 | −0.8 | |
Unionist | Ralph Harris | 15,796 | 48.56 | +0.8 | |
Majority | 939 | 2.88 | −1.6 | ||
Turnout | 32,531 | 68.85 | −7.85 | ||
Labour hold | Swing | -0.8 | |||
Party | Candidate | Votes | % | ±% | |
---|---|---|---|---|---|
Labour | Thomas Oswald | 15,849 | 50.99 | −0.45 | |
Unionist | Norman Wylie | 15,232 | 49.01 | +0.45 | |
Majority | 617 | 1.98 | −0.90 | ||
Turnout | 31,081 | 72.65 | +3.8 | ||
Labour hold | Swing | -0.45 | |||
Party | Candidate | Votes | % | ±% | |
---|---|---|---|---|---|
Labour | Thomas Oswald | 14,124 | 53.9 | +2.91 | |
Unionist | Nicholas Fairbairn | 12,082 | 46.1 | −2.91 | |
Majority | 2,042 | 7.8 | +5.82 | ||
Turnout | 26,206 | 71.62 | −1.03 | ||
Labour hold | Swing | +2.91 | |||
Party | Candidate | Votes | % | ±% | |
---|---|---|---|---|---|
Labour | Thomas Oswald | 13,682 | 58.6 | +4.7 | |
Conservative | Nicholas Fairbairn | 9,667 | 41.4 | −4.7 | |
Majority | 4,015 | 17.2 | +9.4 | ||
Turnout | 23,349 | 68.86 | −2.76 | ||
Labour hold | Swing | +4.7 | |||
Party | Candidate | Votes | % | ±% | |
---|---|---|---|---|---|
Labour | Thomas Oswald | 9,561 | 46.16 | −12.44 | |
Conservative | Malcolm Rifkind | 8,000 | 38.62 | +2.78 | |
SNP | Rena Moore | 1,666 | 8.04 | New | |
Liberal | Anthony Oliver | 1,486 | 7.17 | New | |
Majority | 1,561 | 7.54 | −9.66 | ||
Turnout | 20,713 | 66.00 | 2.86 | ||
Labour hold | Swing | -8.61 | |||
Party | Candidate | Votes | % | ±% | |
---|---|---|---|---|---|
Labour | Robin Cook | 11,354 | 37.85 | −8.31 | |
Conservative | P Jones | 10,393 | 34.64 | −3.98 | |
Liberal | Christopher Scott | 4,180 | 13.93 | +6.76 | |
SNP | AW Stephen Rae | 4,074 | 13.58 | +5.54 | |
Majority | 961 | 3.19 | −4.35 | ||
Turnout | 30,001 | 73.57 | +7.57 | ||
Labour hold | Swing | -2.17 | |||
Party | Candidate | Votes | % | ±% | |
---|---|---|---|---|---|
Labour | Robin Cook | 11,129 | 40.27 | +2.42 | |
Conservative | P Jones | 7,176 | 25.97 | −8.67 | |
SNP | AW Stephen Rae | 6,866 | 24.85 | +11.27 | |
Liberal | Christopher Scott | 2,463 | 8.91 | −5.02 | |
Majority | 3,953 | 14.3 | +11.11 | ||
Turnout | 27,634 | 67.47 | −6.1 | ||
Labour hold | Swing | +5.55 | |||
Party | Candidate | Votes | % | ±% | |
---|---|---|---|---|---|
Labour | Robin Cook | 12,191 | 47.8 | +7.5 | |
Conservative | David McLetchie | 7,530 | 29.5 | +3.5 | |
Liberal | Stewart Donaldson | 3,096 | 12.1 | +3.2 | |
SNP | Gavin Kennedy | 2,486 | 9.8 | −15.0 | |
SLP | Colin Boyd | 176 | 0.7 | New | |
Majority | 4,661 | 18.3 | +4.0 | ||
Turnout | 25,479 | 67.5 | 0.0 | ||
Labour hold | Swing | +2.0 | |||
Although the Edinburgh Central seat had been won by the Labour Party in 1979, had that election been fought on the new boundaries it was estimated that the Conservatives would have won the seat by a majority of 1,971. [18]
Party | Candidate | Votes | % | ±% | |
---|---|---|---|---|---|
Conservative | Alexander Fletcher | 14,095 | 38.0 | −2.6 | |
Labour | Richard Kerley | 11,529 | 31.1 | −4.7 | |
SDP | Dr Marion Macleod | 9,498 | 25.6 | +14.2 | |
SNP | Ronald Halliday | 1,810 | 4.9 | −6.9 | |
Communist | D.W. Carson | 119 | 0.3 | New | |
Majority | 2,566 | 6.9 | −1.9 | ||
Turnout | 37,051 | 64.9 | |||
Conservative hold | Swing | ||||
Party | Candidate | Votes | % | ±% | |
---|---|---|---|---|---|
Labour | Alistair Darling | 16,502 | 40.2 | +9.1 | |
Conservative | Alexander Fletcher | 14,240 | 34.7 | −3.3 | |
Liberal | Andrew Myles | 7,333 | 17.9 | −7.7 | |
SNP | Brian Shaw | 2,559 | 6.2 | +1.3 | |
Green | Linda Hendry | 438 | 1.1 | New | |
Majority | 2,262 | 5.5 | N/A | ||
Turnout | 41,072 | 69.0 | +4.1 | ||
Registered electors | 59,529 | ||||
Labour gain from Conservative | Swing | ||||
Party | Candidate | Votes | % | ±% | |
---|---|---|---|---|---|
Labour | Alistair Darling | 15,189 | 38.8 | −1.4 | |
Conservative | Paul Martin | 13,063 | 33.4 | −1.3 | |
SNP | Lynne J. Devine | 5,539 | 14.2 | +8.0 | |
Liberal Democrats | Andrew B. Myles | 4,500 | 11.5 | −6.4 | |
Scottish Green | Robin Harper | 630 | 1.6 | +0.5 | |
Liberal | Richard Wilson | 235 | 0.6 | New | |
Majority | 2,126 | 5.4 | −0.1 | ||
Turnout | 39,156 | 69.3 | +0.3 | ||
Registered electors | 56,527 | ||||
Labour hold | Swing | -0.1 | |||
Party | Candidate | Votes | % | ±% | |
---|---|---|---|---|---|
Labour | Alistair Darling | 20,125 | 47.1 | +8.3 | |
Conservative | Mike D.A. Scott-Hayward | 9,055 | 21.2 | −12.2 | |
SNP | Fiona Hyslop | 6,750 | 15.8 | +1.6 | |
Liberal Democrats | Karen J. Utting | 5,605 | 13.1 | +1.6 | |
Scottish Green | Linda Hendry | 607 | 1.4 | −0.2 | |
Referendum | Austin G. Skinner | 495 | 1.2 | New | |
Independent | Mark E. Benson | 98 | 0.2 | New | |
Majority | 11,070 | 25.9 | +20.5 | ||
Turnout | 42,735 | 66.8 | −2.5 | ||
Registered electors | 63,969 | ||||
Labour hold | Swing | +8.4 | |||
Party | Candidate | Votes | % | ±% | |
---|---|---|---|---|---|
Labour | Alistair Darling | 14,495 | 42.1 | −5.0 | |
Liberal Democrats | Andrew B. Myles | 6,353 | 18.5 | +5.4 | |
Conservative | Alastair Orr | 5,643 | 16.4 | −4.8 | |
SNP | Ian McKee | 4,832 | 14.1 | −1.7 | |
Scottish Green | Graeme Farmer | 1,809 | 5.3 | +3.9 | |
Scottish Socialist | Kevin Williamson | 1,258 | 3.7 | New | |
Majority | 8,142 | 23.6 | −2.3 | ||
Turnout | 34,390 | 52.0 | −14.8 | ||
Labour hold | Swing | −5.2 | |||
Edinburgh South is a constituency of the House of Commons of the UK Parliament created in 1885. The constituency has been held by Scottish Labour since 1987. The seat has been represented since 2010 by Ian Murray, who currently serves as Secretary of State for Scotland under the government of Keir Starmer. Murray was the only Labour MP in Scotland to retain his seat at the 2015 and 2019 general elections and this is one of only three seats never held by the Scottish National Party (SNP).
Edinburgh West is a burgh constituency of the House of Commons of the Parliament of the United Kingdom, first contested at the 1885 general election.
Edinburgh East was a burgh constituency of the House of Commons of the Parliament of the United Kingdom. It elected one Member of Parliament (MP) by the first past the post system of election.
Edinburgh South West is a Scottish constituency of the House of Commons of the Parliament of the United Kingdom, first used at the 2005 UK general election. It elects one Member of Parliament (MP) by the first past the post system of election. Since 2024, it has been represented by Scott Arthur of the Labour Party.
Edinburgh Pentlands was a constituency of the House of Commons of the Parliament of the United Kingdom, first used in the general election of 1950, and abolished prior to the general election of 2005. It elected one Member of Parliament (MP) by the first past the post system of election.
Glasgow Central was a constituency of the House of Commons of the Parliament of the United Kingdom until 2024. A Glasgow Central constituency existed from 1885 until its abolition in 1997. Prior to the 2005 general election, boundary changes led to a new constituency named Glasgow Central being introduced. The constituency was abolished again prior to the 2024 general election. Prior to its abolition, the seat was held by Alison Thewliss of the Scottish National Party (SNP). The first iteration of this constituency was the seat of the former Conservative Prime Minister Bonar Law, who was the shortest-serving UK Prime Minister of the twentieth century.
Aberdeen South is a burgh constituency of the House of Commons of the Parliament of the United Kingdom which elects one Member of Parliament (MP) by the first-past-the-post system of election.
Aberdeen North is a burgh constituency of the House of Commons of the Parliament of the United Kingdom and it elects one Member of Parliament (MP) by the first past the post system of election. It was first used in the 1885 general election, but has undergone various boundary changes since that date. The seat has been held by Kirsty Blackman of the Scottish National Party since 2015.
West Aberdeenshire and Kincardine is a county constituency of the House of Commons of the Parliament of the United Kingdom of Great Britain and Northern Ireland (Westminster), which elects one Member of Parliament (MP) by the first past the post system of election. It was first used in the 1997 general election, but has undergone boundary changes since that date. West Aberdeenshire and Kincardine was re-created as a parliamentary constituency in 1997, having previously existed as Kincardine and Western Aberdeenshire from 1918 to 1950.
East Renfrewshire is a constituency of the House of Commons, to the south of Glasgow, Scotland. It elects one Member of Parliament (MP) using the first-past-the-post system of voting.
Dumfriesshire was a county constituency represented in the House of Commons of Great Britain from 1708 to 1801 and in the House of Commons of the Parliament of the United Kingdom from 1801 until 2005. It was known as Dumfries from 1950.
Glasgow Cathcart was a burgh constituency represented in the House of Commons of the Parliament of the United Kingdom from 1918 until 2005, when it was replaced by the larger Glasgow South constituency.
Glasgow Govan was a parliamentary constituency in the Govan district of Glasgow. It was represented in the House of Commons of the Parliament of the United Kingdom for 120 years; from 1885 until 2005, returning one Member of Parliament (MP) elected by the first-past-the-post system.
Glasgow Shettleston was a burgh constituency represented in the House of Commons of the Parliament of the United Kingdom from 1918 until 2005. The Shettleston area's representation is now covered by Glasgow Central and Glasgow East.
Hamilton was a burgh constituency represented in the House of Commons of the Parliament of the United Kingdom from 1918 to 1997. It elected one Member of Parliament (MP) by the first past the post voting system.
Rutherglen is a burgh constituency represented in the House of Commons of the Parliament of the United Kingdom since 2024. It also existed between 1918 and 2005 and was largely replaced by Rutherglen and Hamilton West while a small portion became part of Glasgow Central and Glasgow South.
West Renfrewshire was a county constituency of the House of Commons of the Parliament of the United Kingdom from 1885 to 1983 and again from 1997 until 2005. In 2005 the constituency was abolished and the area is now represented by Inverclyde, Paisley and Renfrewshire North and Paisley and Renfrewshire South.
Edinburgh Central is a burgh constituency of the Scottish Parliament (Holyrood) covering part of the council area of Edinburgh. It elects one Member of the Scottish Parliament (MSP) by the plurality method of election. It is also one of nine constituencies in the Lothian electoral region, which elects seven additional members, in addition to the nine constituency MSPs, to produce a form of proportional representation for the region as a whole.
Peckham is a borough constituency in South London which returns one Member of Parliament (MP) to the House of Commons of the Parliament of the United Kingdom. Elections are held using the first-past-the-post voting system.