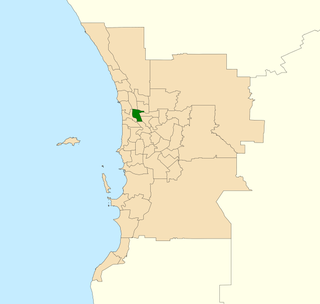
This is a list of electoral results for the electoral district of Balcatta in Western Australian state elections.
Balcatta (1904–1911) | |||
---|---|---|---|
Member | Party | Term | |
Frederick Gill | Labor | 1904–1905 | |
John Veryard | Ministerial | 1905–1908 | |
Frederick Gill | Labor | 1908–1911 | |
Balcatta (1962–1974) | |||
Member | Party | Term | |
Herb Graham | Labor | 1962–1973 | |
Brian Burke | Labor | 1973–1974 | |
Balcatta (1977–1996) | |||
Member | Party | Term | |
Brian Burke | Labor | 1977–1983 | |
Ron Bertram | Labor | 1983–1989 | |
Nick Catania | Labor | 1989–1996 | |
Balcatta (2005–present) | |||
Member | Party | Term | |
John Kobelke | Labor | 2005–2013 | |
Chris Hatton | Liberal | 2013–2017 | |
David Michael | Labor | 2017–present | |
Party | Candidate | Votes | % | ±% | |
---|---|---|---|---|---|
Labor | David Michael | 15,894 | 66.5 | +19.9 | |
Liberal | Wayne Evans | 4,497 | 18.8 | −17.3 | |
Greens | Benedict Guinery | 1,818 | 7.6 | −2.7 | |
Christians | Rose Anderson | 504 | 2.1 | −1.1 | |
Liberal Democrats | Damian Coletta | 489 | 2.0 | +1.2 | |
No Mandatory Vaccination | Daniel Thornton | 453 | 1.9 | +1.9 | |
WAxit | Domenic Staltari | 238 | 1.0 | +1.0 | |
Total formal votes | 23,893 | 95.1 | +1.6 | ||
Informal votes | 1,222 | 4.9 | −1.6 | ||
Turnout | 25,115 | 85.0 | −1.6 | ||
Two-party-preferred result | |||||
Labor | David Michael | 18,087 | 75.8 | +17.7 | |
Liberal | Wayne Evans | 5,790 | 24.2 | −17.7 | |
Labor hold | Swing | +17.7 |
Party | Candidate | Votes | % | ±% | |
---|---|---|---|---|---|
Labor | David Michael | 10,265 | 44.2 | +8.6 | |
Liberal | Chris Hatton | 8,885 | 38.3 | −13.3 | |
Greens | Nicole Harvey | 2,508 | 10.8 | +2.6 | |
Christians | Keith McEncroe | 749 | 3.2 | +1.6 | |
Micro Business | Mile Nasteski | 544 | 2.3 | +2.3 | |
Liberal Democrats | Richard Tait | 252 | 1.1 | +1.1 | |
Total formal votes | 23,203 | 94.2 | +1.7 | ||
Informal votes | 1,426 | 5.8 | −1.7 | ||
Turnout | 24,629 | 88.1 | +0.3 | ||
Two-party-preferred result | |||||
Labor | David Michael | 12,950 | 55.8 | +12.9 | |
Liberal | Chris Hatton | 10,247 | 44.2 | −12.9 | |
Labor gain from Liberal | Swing | +12.9 |
Party | Candidate | Votes | % | ±% | |
---|---|---|---|---|---|
Liberal | Chris Hatton | 10,756 | 51.9 | +10.7 | |
Labor | Janet Pettigrew | 7,341 | 35.4 | –6.5 | |
Greens | Sheridan Young | 1,705 | 8.2 | –3.3 | |
Christians | Peter Dodd | 322 | 1.6 | –2.0 | |
Family First | Lesley Croll | 264 | 1.3 | –0.6 | |
Independent | Joe Ruzzi | 234 | 1.1 | +1.1 | |
Independent | Mubarak Kim Kidima | 122 | 0.6 | +0.6 | |
Total formal votes | 20,744 | 92.3 | −0.7 | ||
Informal votes | 1,727 | 7.7 | +0.7 | ||
Turnout | 22,471 | 89.6 | |||
Two-party-preferred result | |||||
Liberal | Chris Hatton | 11,886 | 57.3 | +9.5 | |
Labor | Janet Pettigrew | 8,841 | 42.7 | –9.5 | |
Liberal gain from Labor | Swing | +9.5 |
Party | Candidate | Votes | % | ±% | |
---|---|---|---|---|---|
Labor | John Kobelke | 7,897 | 42.10 | −9.7 | |
Liberal | Chris Hatton | 7,682 | 40.95 | +6.6 | |
Greens | Irma Lachmund | 2,110 | 11.25 | +2.6 | |
Christian Democrats | Peter Schofield | 692 | 3.69 | −1.4 | |
Family First | Inge George | 377 | 2.01 | +2.01 | |
Total formal votes | 18,758 | 93.05 | |||
Informal votes | 1,402 | 6.95 | |||
Turnout | 20,160 | 86.28 | |||
Two-party-preferred result | |||||
Labor | John Kobelke | 9,804 | 52.30 | −6.9 | |
Liberal | Chris Hatton | 8,941 | 47.70 | +6.9 | |
Labor hold | Swing | −6.9 |
Party | Candidate | Votes | % | ±% | |
---|---|---|---|---|---|
Labor | John Kobelke | 12,489 | 52.2 | +3.4 | |
Liberal | Melinda Poor | 8,028 | 33.6 | +2.5 | |
Greens | Kayt Davies | 2,122 | 8.9 | +2.0 | |
Christian Democrats | Michael Ewers | 1,278 | 5.3 | +5.3 | |
Total formal votes | 23,917 | 93.6 | +0.4 | ||
Informal votes | 1,639 | 6.4 | −0.4 | ||
Turnout | 25,556 | 89.9 | |||
Two-party-preferred result | |||||
Labor | John Kobelke | 14,306 | 59.9 | −1.0 | |
Liberal | Melinda Poor | 9,575 | 40.1 | +1.0 | |
Labor hold | Swing | −1.0 |
Party | Candidate | Votes | % | ±% | |
---|---|---|---|---|---|
Labor | Nick Catania | 9,157 | 48.9 | −2.5 | |
Liberal | Katie Hodson-Thomas | 7,892 | 42.1 | +0.9 | |
Greens | Jack Geneff | 1,009 | 5.4 | +5.4 | |
Democrats | Yvette Heath | 670 | 3.6 | +3.6 | |
Total formal votes | 18,728 | 95.0 | +5.9 | ||
Informal votes | 988 | 5.0 | −5.9 | ||
Turnout | 19,716 | 93.8 | +2.1 | ||
Two-party-preferred result | |||||
Labor | Nick Catania | 10,195 | 54.4 | +0.4 | |
Liberal | Katie Hodson-Thomas | 8,533 | 45.6 | −0.4 | |
Labor hold | Swing | +0.4 |
Party | Candidate | Votes | % | ±% | |
---|---|---|---|---|---|
Labor | Nick Catania | 8,806 | 51.4 | −12.4 | |
Liberal | Marie Wordsworth | 7,065 | 41.2 | +5.0 | |
Grey Power | Brendan O'Dwyer | 1,267 | 7.4 | +7.4 | |
Total formal votes | 17,138 | 89.1 | |||
Informal votes | 2,088 | 10.9 | |||
Turnout | 19,226 | 91.7 | |||
Two-party-preferred result | |||||
Labor | Nick Catania | 9,248 | 54.0 | −9.8 | |
Liberal | Marie Wordsworth | 7,890 | 46.0 | +9.8 | |
Labor hold | Swing | −9.8 |
Party | Candidate | Votes | % | ±% | |
---|---|---|---|---|---|
Labor | Ron Bertram | 11,543 | 63.4 | +0.4 | |
Liberal | Vincenzo Alessandrino | 6,654 | 36.6 | −0.4 | |
Total formal votes | 18,197 | 96.6 | +0.3 | ||
Informal votes | 633 | 3.4 | −0.3 | ||
Turnout | 18,830 | 91.8 | +3.8 | ||
Labor hold | Swing | +0.4 |
Party | Candidate | Votes | % | ±% | |
---|---|---|---|---|---|
Labor | Ron Bertram | 9,562 | 63.0 | ||
Liberal | Vincenzo Allessandrino | 5,627 | 37.0 | ||
Total formal votes | 15,189 | 96.3 | |||
Informal votes | 579 | 3.7 | |||
Turnout | 15,768 | 88.0 | |||
Labor hold | Swing |
Party | Candidate | Votes | % | ±% | |
---|---|---|---|---|---|
Labor | Brian Burke | 10,709 | 68.7 | +7.4 | |
Liberal | John Bamford | 4,869 | 31.3 | −7.4 | |
Total formal votes | 15,578 | 96.0 | −0.4 | ||
Informal votes | 650 | 4.0 | +0.4 | ||
Turnout | 16,228 | 86.9 | −3.1 | ||
Labor hold | Swing | +7.4 |
Party | Candidate | Votes | % | ±% | |
---|---|---|---|---|---|
Labor | Brian Burke | 9,182 | 61.3 | ||
Liberal | Geoffrey Hasler | 5,799 | 38.7 | ||
Total formal votes | 14,981 | 96.4 | |||
Informal votes | 555 | 3.6 | |||
Turnout | 15,536 | 90.0 | |||
Labor hold | Swing |
Party | Candidate | Votes | % | ±% | |
---|---|---|---|---|---|
Liberal | Neil Beck | 9,178 | 49.0 | +49.0 | |
Labor | Brian Burke | 9,075 | 48.5 | –18.0 | |
Australia | Wilfrid Campin | 469 | 2.5 | +2.5 | |
Total formal votes | 18,722 | 97.5 | +2.9 | ||
Informal votes | 478 | 2.5 | –2.9 | ||
Turnout | 19,200 | 80.7 | –19.3 | ||
Two-party-preferred result | |||||
Labor | Brian Burke | 9,376 | 50.1 | –16.5 | |
Liberal | Neil Beck | 9,346 | 49.9 | +49.9 | |
Labor hold | Swing | N/A |
Party | Candidate | Votes | % | ±% | |
---|---|---|---|---|---|
Labor | Herb Graham | 11,734 | 66.6 | +3.2 | |
Democratic Labor | Elmo Gugiatti | 5,891 | 33.4 | +33.4 | |
Total formal votes | 17,625 | 94.6 | −1.5 | ||
Informal votes | 1,013 | 5.4 | +1.5 | ||
Turnout | 18,638 | 92.0 | −1.1 | ||
Labor hold | Swing | N/A |
Party | Candidate | Votes | % | ±% | |
---|---|---|---|---|---|
Labor | Herb Graham | 8,014 | 63.4 | ||
Liberal and Country | Anthony Scolaro | 4,626 | 36.6 | ||
Total formal votes | 12,640 | 96.1 | |||
Informal votes | 519 | 3.9 | |||
Turnout | 13,159 | 93.1 | |||
Labor hold | Swing |
Party | Candidate | Votes | % | ±% | |
---|---|---|---|---|---|
Labor | Herb Graham | 6,787 | 53.7 | −1.2 | |
Liberal and Country | Terrence Browne | 5,844 | 46.3 | +8.7 | |
Total formal votes | 12,631 | 97.0 | −1.2 | ||
Informal votes | 389 | 3.0 | +1.2 | ||
Turnout | 13,020 | 94.4 | −1.5 | ||
Labor hold | Swing | −2.3 |
Party | Candidate | Votes | % | ±% | |
---|---|---|---|---|---|
Labor | Herb Graham | 5,371 | 54.9 | ||
Liberal and Country | Rodney Treadgold | 3,683 | 37.6 | ||
Democratic Labor | Adrian Briffa | 7,38 | 7.5 | ||
Total formal votes | 9,792 | 98.3 | |||
Informal votes | 167 | 1.7 | |||
Turnout | 9,959 | 95.9 | |||
Two-party-preferred result | |||||
Labor | Herb Graham | 56.0 | |||
Liberal and Country | Rodney Treadgold | 44.0 | |||
Labor hold | Swing |
Party | Candidate | Votes | % | ±% | |
---|---|---|---|---|---|
Labour | Frederick Gill | 1,299 | 52.0 | +7.4 | |
Ministerialist | John Veryard | 1,197 | 48.0 | −7.4 | |
Total formal votes | 2,496 | 98.8 | −0.6 | ||
Informal votes | 31 | 1.2 | +0.6 | ||
Turnout | 2,527 | 72.7 | +15.0 | ||
Labour gain from Ministerialist | Swing | +7.4 |
Party | Candidate | Votes | % | ±% | |
---|---|---|---|---|---|
Ministerialist | John Veryard | 768 | 55.4 | +38.9 | |
Labour | Frederick Gill | 619 | 44.6 | –11.9 | |
Total formal votes | 1,387 | 99.4 | +0.9 | ||
Informal votes | 8 | 0.6 | –0.9 | ||
Turnout | 1,395 | 57.7 | +7.5 | ||
Ministerialist gain from Labour | Swing | +38.9 |
Party | Candidate | Votes | % | ±% | |
---|---|---|---|---|---|
Labour | Frederick Gill | 938 | 56.5 | +56.5 | |
Independent | Thomas Molloy | 448 | 27.0 | +27.0 | |
Ministerialist | Richard Taylor | 273 | 16.5 | +16.5 | |
Total formal votes | 1,659 | 98.5 | n/a | ||
Informal votes | 25 | 1.5 | n/a | ||
Turnout | 1,684 | 50.2 | n/a | ||
Labour win | (new seat) |
Balcatta is an electoral district of the Legislative Assembly in the Australian state of Western Australia.
Nollamara was an electoral district of the Legislative Assembly in the Australian state of Western Australia.
This is a list of electoral results for the electoral district of Cottesloe in Western Australian state elections.
This is a list of electoral results for the electoral district of Armadale in Western Australian state elections.
This is a list of electoral results for the electoral district of Rockingham in Western Australian state elections.
This is a list of electoral results for the electoral district of Pilbara in Western Australian state elections.
This is a list of electoral results for the electoral district of Bunbury in Western Australian state elections.
This is a list of electoral results for the electoral district of Collie-Preston in Western Australian state elections.
This is a list of electoral results for the electoral district of Darling Range in Western Australian state elections.
This is a list of electoral results for the electoral district of Dawesville in Western Australian state elections.
This is a list of electoral results for the electoral district of Hillarys in Western Australian state elections.
This is a list of electoral results for the electoral district of Kimberley in Western Australian state elections.
This is a list of electoral results for the electoral district of Mandurah in Western Australian state elections.
This is a list of electoral results for the electoral district of Morley in Western Australian state elections.
This is a list of electoral results for the electoral district of North West Central in Western Australian state elections.
This is a list of electoral results for the electoral district of Riverton in Western Australian state elections.
This is a list of electoral results for the electoral district of Vasse in Western Australian state elections.
This is a list of electoral results for the electoral district of Wanneroo in Western Australian state elections.
This is a list of electoral district results of the 2017 Western Australian election.
This is a list of electoral district results of the 2021 Western Australian election.