This is a list of electoral results for the electoral district of Collie-Preston in Western Australian state elections.
South-West Mining | |||
---|---|---|---|
Member | Party | Term | |
John Ewing | Ministerial | 1901–1904 | |
Collie | |||
Ernest Henshaw | Labor | 1904–1905 | |
John Ewing | Ministerial | 1905–1908 | |
Arthur Wilson | Labor | 1908–1947 | |
Harry May | Labor | 1947–1968 | |
Tom Jones | Labor | 1968–1989 | |
Dr Hilda Turnbull | National | 1989–2001 | |
Mick Murray | Labor | 2001–2005 | |
Collie-Wellington | |||
Mick Murray | Labor | 2005–2008 | |
Collie-Preston | |||
Mick Murray | Labor | 2008–2021 | |
Jodie Hanns | Labor | 2021–present | |
Party | Candidate | Votes | % | ±% | |
---|---|---|---|---|---|
Labor | Jodie Hanns | 16,085 | 62.2 | +12.3 | |
Liberal | Jane Goff | 3,778 | 14.6 | −3.3 | |
National | Wayne Sanford | 2,245 | 8.7 | −4.3 | |
Greens | Gordon Scantlebury | 889 | 3.4 | −0.9 | |
Shooters, Fishers, Farmers | Clinton Thomas | 773 | 3.0 | −0.9 | |
One Nation | Michael Williams | 533 | 2.1 | −6.6 | |
No Mandatory Vaccination | Christine Merrifield | 487 | 1.9 | +1.9 | |
Legalise Cannabis | Emily Wilkinson | 458 | 1.8 | +1.8 | |
Independent | Russell Sheridan | 385 | 1.5 | +1.5 | |
Sustainable Australia | Graham Butler | 149 | 0.6 | +0.6 | |
WAxit | Jackie Tomic | 71 | 0.3 | +0.3 | |
Total formal votes | 25,853 | 96.0 | +0.2 | ||
Informal votes | 1,082 | 4.0 | −0.2 | ||
Turnout | 26,935 | 87.6 | +1.2 | ||
Two-party-preferred result | |||||
Labor | Jodie Hanns | 18,963 | 73.4 | +8.7 | |
Liberal | Jane Goff | 6,879 | 26.6 | −8.7 | |
Labor hold | Swing | +8.7 |
Party | Candidate | Votes | % | ±% | |
---|---|---|---|---|---|
Labor | Mick Murray | 12,246 | 49.5 | +10.7 | |
Liberal | Elysia Harverson | 4,408 | 17.8 | −22.7 | |
National | Monique Warnock | 3,306 | 13.4 | +2.8 | |
One Nation | David Miller | 2,069 | 8.4 | +8.4 | |
Greens | Gordon Tayler | 1,170 | 4.7 | −1.4 | |
Shooters, Fishers, Farmers | Clinton Thomas | 975 | 3.9 | +3.9 | |
Independent | Louie Scibilia | 347 | 1.4 | +1.4 | |
Independent | Don Hyland | 230 | 0.9 | +0.9 | |
Total formal votes | 24,751 | 95.8 | +1.1 | ||
Informal votes | 1,086 | 4.2 | −1.1 | ||
Turnout | 25,837 | 89.9 | +0.6 | ||
Two-party-preferred result | |||||
Labor | Mick Murray | 16,003 | 64.7 | +17.6 | |
Liberal | Elysia Harverson | 8,728 | 35.3 | −17.6 | |
Labor gain from Liberal | Swing | +17.6 | |||
Party | Candidate | Votes | % | ±% | |
---|---|---|---|---|---|
Labor | Mick Murray | 8,708 | 43.2 | −1.0 | |
Liberal | Jaimee Motion | 8,250 | 40.9 | +3.6 | |
National | Peter Hutchinson | 1,513 | 7.5 | +7.5 | |
Greens | Kingsley Gibson | 1,010 | 5.0 | −2.9 | |
Family First | Alice Harper | 529 | 2.6 | −5.3 | |
Clinton Knop | 158 | 0.8 | +0.8 | ||
Total formal votes | 20,168 | 95.0 | |||
Informal votes | 1,069 | 5.0 | |||
Turnout | 21,237 | 91.72 | |||
Two-party-preferred result | |||||
Labor | Mick Murray | 10,108 | 50.1 | −3.7 | |
Liberal | Jaimee Motion | 10,052 | 49.9 | +3.7 | |
Labor hold | Swing | -3.7 | |||
Party | Candidate | Votes | % | ±% | |
---|---|---|---|---|---|
Labor | Mick Murray | 8,439 | 41.00 | −1.3 | |
Liberal | Steve Thomas | 8,260 | 40.13 | +2.4 | |
Greens | Richard Chapman | 1,802 | 8.75 | +2.7 | |
Family First | Keith Hopper | 1,534 | 7.45 | +4.6 | |
Christian Democrats | Wayne Barnett | 548 | 2.66 | +1.2 | |
Total formal votes | 20,583 | 95.46 | |||
Informal votes | 979 | 4.54 | |||
Turnout | 21,562 | 90.33 | |||
Two-party-preferred result | |||||
Labor | Mick Murray | 10,494 | 51.00 | +0.1 | |
Liberal | Steve Thomas | 10,083 | 49.00 | −0.1 | |
Labor hold | Swing | +0.1 | |||
Party | Candidate | Votes | % | ±% | |
---|---|---|---|---|---|
Labor | Mick Murray | 6,798 | 50.5 | +13.0 | |
Liberal | Craig Carbone | 3,741 | 27.8 | +3.9 | |
National | Neale Armstrong | 1,517 | 11.3 | +0.6 | |
Greens | David Paris | 432 | 3.2 | +0.8 | |
One Nation | Kevin Gordon | 283 | 2.1 | −13.8 | |
Family First | Edward Dabrowski | 282 | 2.1 | +2.1 | |
Independent | Gary Murrihy | 222 | 1.6 | +1.6 | |
Christian Democrats | Tanya Dunjey | 110 | 0.8 | +0.8 | |
New Country | Martha Window | 70 | 0.5 | +0.5 | |
Total formal votes | 13,455 | 94.4 | −0.7 | ||
Informal votes | 798 | 5.6 | +0.7 | ||
Turnout | 14,253 | 92.7 | |||
Two-party-preferred result | |||||
Labor | Mick Murray | 7,962 | 59.3 | +6.7 | |
Liberal | Craig Carbone | 5,463 | 40.7 | −6.7 | |
Labor hold | Swing | +6.7 | |||
Party | Candidate | Votes | % | ±% | |
---|---|---|---|---|---|
Labor | Mick Murray | 4,162 | 34.7 | −6.0 | |
National | Hilda Turnbull | 2,922 | 24.4 | −34.9 | |
Liberal | Steve Thomas | 1,897 | 15.8 | +15.8 | |
One Nation | Jan Hough | 1,811 | 15.1 | +15.1 | |
Greens | Peter Murphy | 844 | 7.0 | +7.0 | |
Independent | Frank Marciano | 191 | 1.6 | +1.6 | |
Independent | Andrew Williams | 163 | 1.4 | +1.4 | |
Total formal votes | 11,990 | 95.3 | −2.2 | ||
Informal votes | 588 | 4.7 | +2.2 | ||
Turnout | 12,578 | 93.7 | |||
Two-party-preferred result | |||||
Labor | Mick Murray | 5,947 | 50.1 | +9.4 | |
National | Hilda Turnbull | 5,913 | 49.9 | −9.4 | |
Labor gain from National | Swing | +9.4 | |||
Party | Candidate | Votes | % | ±% | |
---|---|---|---|---|---|
National | Hilda Turnbull | 6,954 | 59.3 | +26.1 | |
Labor | Mick Murray | 4,779 | 40.7 | +1.8 | |
Total formal votes | 11,733 | 97.5 | +1.0 | ||
Informal votes | 295 | 2.5 | −1.0 | ||
Turnout | 12,028 | 92.4 | |||
National hold | Swing | +0.9 | |||
Party | Candidate | Votes | % | ±% | |
---|---|---|---|---|---|
Labor | Mick Murray | 4,280 | 42.2 | −1.2 | |
National | Hilda Turnbull | 4,054 | 39.9 | +9.0 | |
Liberal | Harald Peterson | 1,427 | 14.1 | −6.9 | |
Democrats | Sandra Churches | 172 | 1.7 | −1.6 | |
Independent | Adrianus Hladio | 124 | 1.2 | +1.2 | |
Independent | Alfred Bussell | 94 | 0.9 | −0.5 | |
Total formal votes | 10,151 | 96.4 | +2.3 | ||
Informal votes | 374 | 3.6 | −2.3 | ||
Turnout | 10,525 | 94.9 | +2.0 | ||
Two-party-preferred result | |||||
National | Hilda Turnbull | 5,635 | 55.5 | +2.6 | |
Labor | Mick Murray | 4,516 | 44.5 | −2.6 | |
National hold | Swing | +2.6 | |||
Party | Candidate | Votes | % | ±% | |
---|---|---|---|---|---|
Labor | John Mumme | 4,091 | 43.4 | −8.1 | |
National | Hilda Turnbull | 2,914 | 30.9 | +4.1 | |
Liberal | John Silcock | 1,984 | 21.0 | +0.5 | |
Democrats | Ursula Bolitho | 311 | 3.3 | +3.3 | |
Independent | Alfred Bussell | 129 | 1.4 | +1.4 | |
Total formal votes | 9,429 | 94.1 | |||
Informal votes | 592 | 5.9 | |||
Turnout | 10,021 | 92.9 | |||
Two-party-preferred result | |||||
National | Hilda Turnbull | 4,984 | 52.9 | +6.5 | |
Labor | John Mumme | 4,445 | 47.1 | −6.5 | |
National gain from Labor | Swing | +6.5 | |||
Party | Candidate | Votes | % | ±% | |
---|---|---|---|---|---|
Labor | Tom Jones | 4,480 | 51.6 | −14.0 | |
National | Hilda Turnbull | 2,509 | 28.9 | −5.5 | |
Liberal | John Davison | 1,563 | 18.0 | +18.0 | |
Independent | Roy Bussell | 131 | 1.5 | +1.5 | |
Total formal votes | 8,683 | 97.9 | +0.1 | ||
Informal votes | 183 | 2.1 | −0.1 | ||
Turnout | 8,866 | 94.2 | +2.1 | ||
Two-party-preferred result | |||||
Labor | Tom Jones | 4,706 | 54.2 | −11.4 | |
National | Hilda Turnbull | 3,977 | 45.8 | +11.4 | |
Labor hold | Swing | -11.4 | |||
Party | Candidate | Votes | % | ±% | |
---|---|---|---|---|---|
Labor | Tom Jones | 5,102 | 65.6 | ||
National Country | Allen Mountford | 2,674 | 34.4 | ||
Total formal votes | 7,776 | 97.9 | |||
Informal votes | 312 | 2.1 | |||
Turnout | 7,953 | 92.1 | |||
Labor hold | Swing | ||||
Party | Candidate | Votes | % | ±% | |
---|---|---|---|---|---|
Labor | Tom Jones | unopposed | |||
Labor hold | Swing | ||||
Party | Candidate | Votes | % | ±% | |
---|---|---|---|---|---|
Labor | Tom Jones | 4,609 | 61.1 | ||
Liberal | Maurice Williams | 2,937 | 38.9 | ||
Total formal votes | 7,546 | 97.7 | |||
Informal votes | 175 | 2.3 | |||
Turnout | 7,721 | 94.4 | |||
Labor hold | Swing | ||||
Party | Candidate | Votes | % | ±% | |
---|---|---|---|---|---|
Labor | Tom Jones | 3,943 | 56.1 | ||
National Alliance | Hilda Turnbull | 1,619 | 23.0 | ||
Liberal | Brian Menzies | 1,465 | 20.9 | ||
Total formal votes | 7,027 | 97.2 | |||
Informal votes | 205 | 2.8 | |||
Turnout | 7,232 | 93.8 | |||
Two-party-preferred result | |||||
Labor | Tom Jones | 4,186 | 59.6 | ||
National Alliance | Hilda Turnbull | 2,841 | 40.4 | ||
Labor hold | Swing | ||||
Party | Candidate | Votes | % | ±% | |
---|---|---|---|---|---|
Labor | Tom Jones | 4,267 | 79.1 | +25.8 | |
Liberal | Iain Paterson | 859 | 15.9 | −24.2 | |
Democratic Labor | Stanley Johnston | 268 | 5.0 | +5.0 | |
Total formal votes | 5,394 | 98.2 | −0.5 | ||
Informal votes | 101 | 1.8 | +0.5 | ||
Turnout | 5,495 | 94.7 | −0.4 | ||
Two-party-preferred result | |||||
Labor | Tom Jones | 4,307 | 79.8 | +23.2 | |
Liberal | Iain Paterson | 1,087 | 20.2 | −23.2 | |
Labor hold | Swing | +23.2 | |||
Party | Candidate | Votes | % | ±% | |
---|---|---|---|---|---|
Labor | Tom Jones | 2,827 | 53.3 | ||
Liberal and Country | Bob Pike | 2,125 | 40.1 | ||
Independent | John Davidson | 352 | 6.6 | ||
Total formal votes | 5,304 | 98.7 | |||
Informal votes | 70 | 1.3 | |||
Turnout | 5,374 | 95.1 | |||
Two-party-preferred result | |||||
Labor | Tom Jones | 3,003 | 56.6 | ||
Liberal and Country | Bob Pike | 2,301 | 43.4 | ||
Labor hold | Swing | ||||
Party | Candidate | Votes | % | ±% | |
---|---|---|---|---|---|
Labor | Harry May | 2,990 | 60.9 | +2.0 | |
Liberal and Country | Edward Cocker | 1,923 | 39.1 | +12.0 | |
Total formal votes | 4,913 | 97.7 | −1.6 | ||
Informal votes | 117 | 2.3 | +1.6 | ||
Turnout | 5,030 | 94.7 | −0.1 | ||
Labor hold | Swing | -5.0 | |||
Party | Candidate | Votes | % | ±% | |
---|---|---|---|---|---|
Labor | Harry May | 2,937 | 58.9 | ||
Liberal and Country | Edward Cocker | 1,352 | 27.1 | ||
Independent | Norman Coote | 698 | 14.0 | ||
Total formal votes | 4,987 | 99.3 | |||
Informal votes | 33 | 0.7 | |||
Turnout | 5,020 | 94.8 | |||
Two-party-preferred result | |||||
Labor | Harry May | 65.9 | |||
Liberal and Country | Edward Cocker | 34.1 | |||
Labor hold | Swing | ||||
Party | Candidate | Votes | % | ±% | |
---|---|---|---|---|---|
Labor | Harry May | 3,290 | 71.1 | −3.4 | |
Independent | Norman Coote | 1,335 | 28.9 | +28.9 | |
Total formal votes | 4,625 | 98.8 | +0.5 | ||
Informal votes | 56 | 1.2 | −0.5 | ||
Turnout | 4,681 | 95.0 | +0.7 | ||
Labor hold | Swing | N/A | |||
Party | Candidate | Votes | % | ±% | |
---|---|---|---|---|---|
Labor | Harry May | 3,415 | 74.5 | ||
Country | Norman Coote | 1,048 | 22.9 | ||
Communist | Norman Lacey | 120 | 2.6 | ||
Total formal votes | 4,583 | 98.3 | |||
Informal votes | 80 | 1.7 | |||
Turnout | 4,663 | 94.3 | |||
Two-party-preferred result | |||||
Labor | Harry May | 76.9 | |||
Country | Norman Coote | 23.1 | |||
Labor hold | Swing | ||||
Party | Candidate | Votes | % | ±% | |
---|---|---|---|---|---|
Labor | Harry May | unopposed | |||
Labor hold | Swing | ||||
Party | Candidate | Votes | % | ±% | |
---|---|---|---|---|---|
Labor | Harry May | unopposed | |||
Labor hold | Swing | ||||
Party | Candidate | Votes | % | ±% | |
---|---|---|---|---|---|
Labor | Harry May | unopposed | |||
Labor hold | Swing | ||||
Party | Candidate | Votes | % | ±% | |
---|---|---|---|---|---|
Labor | Arthur Wilson | unopposed | |||
Labor hold | Swing | ||||
Party | Candidate | Votes | % | ±% | |
---|---|---|---|---|---|
Labor | Arthur Wilson | unopposed | |||
Labor hold | Swing | ||||
Party | Candidate | Votes | % | ±% | |
---|---|---|---|---|---|
Labor | Arthur Wilson | unopposed | |||
Labor hold | Swing | ||||
Party | Candidate | Votes | % | ±% | |
---|---|---|---|---|---|
Labor | Arthur Wilson | 2,732 | 69.3 | −30.7 | |
Independent Labor | Harry Stapledon | 1,208 | 30.7 | +30.7 | |
Total formal votes | 3,940 | 98.8 | |||
Informal votes | 46 | 1.2 | |||
Turnout | 3,986 | 90.0 | |||
Labor hold | Swing | N/A | |||
Party | Candidate | Votes | % | ±% | |
---|---|---|---|---|---|
Labor | Arthur Wilson | unopposed | |||
Labor hold | Swing | ||||
Party | Candidate | Votes | % | ±% | |
---|---|---|---|---|---|
Labor | Arthur Wilson | unopposed | |||
Labor hold | Swing | ||||
Party | Candidate | Votes | % | ±% | |
---|---|---|---|---|---|
Labor | Arthur Wilson | unopposed | |||
Labor hold | Swing | ||||
Party | Candidate | Votes | % | ±% | |
---|---|---|---|---|---|
Labor | Arthur Wilson | unopposed | |||
Labor hold | Swing | ||||
Party | Candidate | Votes | % | ±% | |
---|---|---|---|---|---|
Labor | Arthur Wilson | unopposed | |||
Labor hold | Swing | ||||
Party | Candidate | Votes | % | ±% | |
---|---|---|---|---|---|
Labor | Arthur Wilson | 1,632 | 70.4 | −29.6 | |
Liberal | Herbert Wells | 685 | 29.6 | +29.6 | |
Total formal votes | 2,317 | 99.1 | |||
Informal votes | 21 | 0.9 | |||
Turnout | 2,338 | 46.8 | |||
Labor hold | Swing | N/A | |||
Party | Candidate | Votes | % | ±% | |
---|---|---|---|---|---|
Labor | Arthur Wilson | unopposed | |||
Labor hold | Swing | ||||
Party | Candidate | Votes | % | ±% | |
---|---|---|---|---|---|
Labour | Arthur Wilson | 1,039 | 51.3 | +5.3 | |
Ministerialist | John Ewing | 985 | 48.7 | −5.3 | |
Total formal votes | 2,024 | 99.2 | −0.7 | ||
Informal votes | 17 | 0.8 | +0.7 | ||
Turnout | 2,041 | 71.3 | +21.5 | ||
Labour gain from Ministerialist | Swing | +5.3 | |||
Party | Candidate | Votes | % | ±% | |
---|---|---|---|---|---|
Ministerialist | John Ewing | 600 | 54.0 | +13.5 | |
Labour | Ernest Henshaw | 511 | 46.0 | –13.5 | |
Total formal votes | 1,111 | 99.9 | +1.3 | ||
Informal votes | 1 | 0.1 | –1.3 | ||
Turnout | 1,112 | 49.8 | +0.8 | ||
Ministerialist gain from Labour | Swing | +13.5 | |||
Party | Candidate | Votes | % | ±% | |
---|---|---|---|---|---|
Labour | Ernest Henshaw | 859 | 59.5 | +59.5 | |
Ministerialist | John Ewing | 584 | 40.5 | +40.5 | |
Total formal votes | 1,443 | 98.6 | n/a | ||
Informal votes | 21 | 1.4 | n/a | ||
Turnout | 1,464 | 49.0 | n/a | ||
Labour win | (new seat) | ||||
Party | Candidate | Votes | % | ±% | |
---|---|---|---|---|---|
Opposition | John Ewing | 394 | 53.2 | +53.2 | |
Labour | George Henderson | 205 | 27.7 | +27.7 | |
Opposition | Harry Courtney | 142 | 19.2 | +19.2 | |
Total formal votes | 741 | 99.3 | n/a | ||
Informal votes | 5 | 0.7 | n/a | ||
Turnout | 746 | 60.7 | n/a | ||
Opposition win | (new seat) | ||||
Collie-Preston is a Legislative Assembly electorate in the state of Western Australia. While the seat was known as Collie for just over a century of its existence as an electorate, the seat was known as South West Mining from 1901 to 1904, and Collie-Wellington from 2005 to 2008. It is named for the South West coal mining town of Collie. While historically a very safe seat for the Labor Party, redistributions in 1988 and 2007 due to increases in the quota for country seats which had historically been malapportioned resulted in the seat incorporating surrounding rural shires which were hostile to Labor and thereby becoming more marginal.
Blackwood-Stirling was an electoral district of the Legislative Assembly in the Australian state of Western Australia. It took parts of the South West and Great Southern regions of Western Australia.
Kwinana is an electoral district of the Legislative Assembly in the Australian state of Western Australia.
This is a list of electoral results for the electoral district of Nedlands in Western Australian state elections from the district's creation in 1929 until the present.
This is a list of electoral results for the electoral district of Maylands in Western Australian state elections from the district's creation in 1948 until the present.
This is a list of electoral results for the electoral district of Victoria Park in Western Australian state elections.
This is a list of electoral results for the electoral district of Fremantle in Western Australian state elections.
This is a list of electoral results for the electoral district of Albany in Western Australian state elections.
This is a list of electoral results for the electoral district of Balcatta in Western Australian state elections.
This is a list of electoral results for the electoral district of Cockburn in Western Australian state elections.
This is a list of electoral results for the electoral district of Darling Range in Western Australian state elections.
This is a list of electoral results for the electoral district of Geraldton in Western Australian state elections.
This is a list of electoral results for the electoral district of Kalgoorlie in Western Australian state elections.
This is a list of electoral results for the electoral district of South Perth in Western Australian state elections.
The 2017 Western Australian state election was held on Saturday 11 March 2017 to elect members to the Parliament of Western Australia, including all 59 seats in the Legislative Assembly and all 36 seats in the Legislative Council. The eight-and-a-half-year two-term incumbent Liberal–WA National government, led by Premier Colin Barnett, was defeated in a landslide by the Labor opposition, led by Opposition Leader Mark McGowan.
This is a list of electoral results for the electoral district of Warren-Blackwood in Western Australian state elections.
This is a list of electoral district results of the 2017 Western Australian election.
The 2021 Western Australian state election was held on Saturday, March 13, to elect members to the Parliament of Western Australia, where all 59 seats in the Legislative Assembly and all 36 seats in the Legislative Council were up for election.
This is a list of electoral district results of the 2021 Western Australian election.
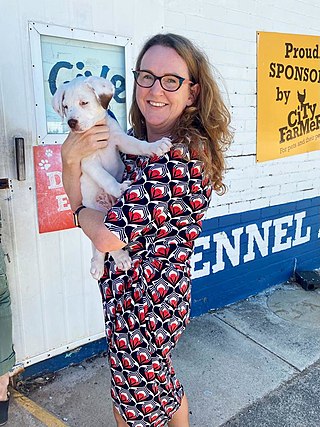
Katrina Stratton is a member of the Western Australian Legislative Assembly for the electoral district of Nedlands for the Australian Labor Party. She won her seat at the 2021 Western Australian state election. In July 2024, Stratton announced she would be leaving the Nedlands and taking the Legislative Council seat vacated by Sally Talbot.