This is a list of electoral results for the electoral district of Kalgoorlie in Western Australian state elections.
Member | Party | Term | |
---|---|---|---|
William Johnson | Labour | 1901–1905 | |
Norbert Keenan | Ministerial | 1905–1911 | |
Albert Green | Labor | 1911–1913 | |
George McLeod | Labor | 1914 | |
Albert Green | Labor | 1914–1921 | |
John Boyland | Ind. Nationalist | 1921–1922 | |
James Cunningham | Labor | 1923–1936 | |
Herbert Styants | Labor | 1936–1956 | |
Tom Evans | Labor | 1956–1980 | |
Ted Evans | Labor | 1980–1981 | |
Ian Taylor | Labor | 1981–1996 | |
Megan Anwyl | Labor | 1996–2001 | |
Matt Birney | Liberal | 2001–2008 | |
John Bowler | Independent | 2008–2013 | |
Wendy Duncan | National | 2013–2017 | |
Kyran O'Donnell | Liberal | 2017–2021 | |
Ali Kent | Labor | 2021–present | |
Party | Candidate | Votes | % | ±% | |
---|---|---|---|---|---|
Labor | Ali Kent | 7,782 | 52.7 | +26.6 | |
Liberal | Kyran O'Donnell | 3,695 | 25.0 | −3.0 | |
National | Rowena Olsen | 1,608 | 10.9 | −13.5 | |
One Nation | Patrick Redreau | 494 | 3.3 | −8.8 | |
Shooters, Fishers, Farmers | Jack Carmody | 465 | 3.2 | −0.9 | |
Greens | Alex Wallace | 328 | 2.2 | −2.0 | |
Liberal Democrats | Sam Rennie | 217 | 1.5 | +1.5 | |
No Mandatory Vaccination | Enrico Piazza | 140 | 0.9 | +0.9 | |
WAxit | Rustu Buyukcakar | 31 | 0.2 | +0.2 | |
Total formal votes | 14,760 | 96.2 | +0.2 | ||
Informal votes | 591 | 3.8 | −0.2 | ||
Turnout | 15,351 | 78.1 | −2.6 | ||
Two-party-preferred result | |||||
Labor | Ali Kent | 9,152 | 62.0 | +18.2 | |
Liberal | Kyran O'Donnell | 5,601 | 38.0 | −18.2 | |
Labor gain from Liberal | Swing | +18.2 |
Party | Candidate | Votes | % | ±% | |
---|---|---|---|---|---|
Liberal | Kyran O'Donnell | 4,256 | 28.0 | −10.6 | |
Labor | Darren Forster | 3,965 | 26.1 | +6.9 | |
National | Tony Crook | 3,713 | 24.4 | −10.3 | |
One Nation | Richard Bolton | 1,846 | 12.1 | +12.1 | |
Greens | Jacqueline Spurling | 646 | 4.3 | −1.0 | |
Shooters, Fishers, Farmers | Mike Lucas | 622 | 4.1 | +4.1 | |
Flux the System! | James Erwin | 149 | 1.0 | +1.0 | |
Total formal votes | 15,197 | 95.9 | +1.9 | ||
Informal votes | 649 | 4.1 | −1.9 | ||
Turnout | 15,846 | 79.1 | −0.4 | ||
Two-party-preferred result | |||||
Liberal | Kyran O'Donnell | 8,533 | 56.2 | −10.3 | |
Labor | Darren Forster | 6,656 | 43.8 | +10.3 | |
Liberal gain from National | Swing | −10.3 | |||
Party | Candidate | Votes | % | ±% | |
---|---|---|---|---|---|
Liberal | Melissa Price | 3,748 | 37.3 | +12.6 | |
National | Wendy Duncan | 3,717 | 37.0 | +18.0 | |
Labor | Terrence Winner | 1,928 | 19.2 | +1.6 | |
Greens | Tim Hall | 450 | 4.5 | 0.0 | |
Christians | Ross Patterson | 202 | 2.0 | +2.0 | |
Total formal votes | 10,045 | 94.3 | 0.0 | ||
Informal votes | 602 | 5.7 | 0.0 | ||
Turnout | 10,647 | 80.7 | |||
Two-party-preferred result | |||||
Liberal | Melissa Price | 6,715 | 66.9 | +7.1 | |
Labor | Terrence Winner | 3,324 | 33.1 | –7.1 | |
Two-candidate-preferred result | |||||
National | Wendy Duncan | 5,651 | 56.3 | +9.8 | |
Liberal | Melissa Price | 4,379 | 43.7 | +43.7 | |
National gain from Independent | Swing | +16.1 | |||
Party | Candidate | Votes | % | ±% | |
---|---|---|---|---|---|
Independent | John Bowler | 3,466 | 34.0 | +34.0 | |
Liberal | Nat James | 2,540 | 24.9 | −26.0 | |
National | Tony Crook | 1,942 | 19.0 | +19.0 | |
Labor | Mathew Cuomo | 1,790 | 17.6 | −19.6 | |
Greens | Andy Huntley | 461 | 4.5 | +0.2 | |
Total formal votes | 10,199 | 94.4 | −1.5 | ||
Informal votes | 605 | 5.6 | +1.5 | ||
Turnout | 10,804 | 76.4 | |||
Two-candidate-preferred result | |||||
Independent | John Bowler | 5,462 | 53.6 | +53.6 | |
National | Tony Crook | 4,731 | 46.4 | +46.4 | |
Independent gain from Liberal | Swing | N/A | |||
Party | Candidate | Votes | % | ±% | |
---|---|---|---|---|---|
Liberal | Matt Birney | 5,579 | 53.1 | +14.5 | |
Labor | James Donnelly | 3,629 | 34.6 | −4.4 | |
Greens | Peter Gurger | 434 | 4.1 | +0.4 | |
Independent | Leigh Varis Beswick | 424 | 4.0 | +4.0 | |
One Nation | Robin Scott | 228 | 2.2 | −8.4 | |
Christian Democrats | Gregory Smart | 205 | 2.0 | +2.0 | |
Total formal votes | 10,499 | 95.9 | 0.0 | ||
Informal votes | 448 | 4.1 | 0.0 | ||
Turnout | 10,947 | 85.3 | |||
Two-party-preferred result | |||||
Liberal | Matt Birney | 6,260 | 59.6 | +8.6 | |
Labor | James Donnelly | 4,236 | 40.4 | −8.6 | |
Liberal hold | Swing | +8.6 | |||
Party | Candidate | Votes | % | ±% | |
---|---|---|---|---|---|
Labor | Megan Anwyl | 4,168 | 38.9 | −7.8 | |
Liberal | Matt Birney | 4,160 | 38.8 | +6.6 | |
One Nation | Guy Hopkins | 1,122 | 10.5 | +10.5 | |
Greens | Deborah Botica | 401 | 3.7 | +3.7 | |
Independent | Duncan Griffin | 392 | 3.7 | +3.7 | |
Independent | Don Green | 332 | 3.1 | +3.1 | |
Curtin Labor Alliance | Ian Burt | 138 | 1.3 | +1.3 | |
Total formal votes | 10,713 | 95.9 | −0.7 | ||
Informal votes | 455 | 4.1 | +0.7 | ||
Turnout | 11,168 | 86.0 | |||
Two-party-preferred result | |||||
Liberal | Matt Birney | 5,447 | 51.1 | +5.5 | |
Labor | Megan Anwyl | 5,205 | 48.9 | −5.5 | |
Liberal gain from Labor | Swing | +5.5 | |||
Party | Candidate | Votes | % | ±% | |
---|---|---|---|---|---|
Labor | Megan Anwyl | 4,985 | 46.7 | −5.9 | |
Liberal | Karen McGay | 3,435 | 32.2 | −2.6 | |
National | Doug Daws | 1,349 | 12.6 | +12.6 | |
Independent | Darby Renton | 898 | 8.4 | +8.4 | |
Total formal votes | 10,667 | 96.7 | +0.3 | ||
Informal votes | 369 | 3.3 | −0.3 | ||
Turnout | 11,036 | 86.5 | |||
Two-party-preferred result | |||||
Labor | Megan Anwyl | 5,793 | 54.4 | −3.2 | |
Liberal | Karen McGay | 4,859 | 45.6 | +3.2 | |
Labor hold | Swing | -3.2 | |||
Party | Candidate | Votes | % | ±% | |
---|---|---|---|---|---|
Labor | Megan Anwyl | 4,223 | 45.5 | −7.2 | |
Liberal | Karen McGay | 3,550 | 38.2 | +3.5 | |
Independent | Darby Renton | 665 | 7.2 | +7.2 | |
Independent | Raymond Delbridge | 378 | 4.1 | +4.1 | |
Greens | Richard McMahon | 282 | 3.0 | +3.0 | |
Democrats | David Thackrah | 158 | 1.7 | +1.7 | |
David Churches | 33 | 0.4 | +0.4 | ||
Total formal votes | 9,289 | 97.0 | +0.7 | ||
Informal votes | 283 | 3.0 | −0.7 | ||
Turnout | 9,572 | 84.3 | −8.8 | ||
Two-party-preferred result | |||||
Labor | Megan Anwyl | 5,055 | 54.4 | −3.3 | |
Liberal | Karen McGay | 4,234 | 45.6 | +3.3 | |
Labor hold | Swing | -3.3 | |||
Party | Candidate | Votes | % | ±% | |
---|---|---|---|---|---|
Labor | Ian Taylor | 5,054 | 52.7 | −6.5 | |
Liberal | Gary Boyle | 3,328 | 34.7 | +1.6 | |
Independent | Margaret Jones | 1,209 | 12.6 | +12.6 | |
Total formal votes | 9,591 | 96.3 | +2.4 | ||
Informal votes | 365 | 3.7 | −2.4 | ||
Turnout | 9,956 | 93.1 | +3.8 | ||
Two-party-preferred result | |||||
Labor | Ian Taylor | 5,532 | 57.7 | −3.7 | |
Liberal | Gary Boyle | 4,059 | 42.3 | +3.7 | |
Labor hold | Swing | -3.7 | |||
Party | Candidate | Votes | % | ±% | |
---|---|---|---|---|---|
Labor | Ian Taylor | 5,224 | 59.2 | −18.1 | |
Liberal | Douglas Bowie | 2,918 | 33.1 | +10.4 | |
Independent | John Burt | 378 | 4.3 | +4.3 | |
Independent | Peter Girando | 298 | 3.4 | +3.4 | |
Total formal votes | 8,818 | 93.9 | |||
Informal votes | 569 | 6.1 | |||
Turnout | 9,387 | 89.3 | |||
Two-party-preferred result | |||||
Labor | Ian Taylor | 5,414 | 61.4 | −15.9 | |
Liberal | Douglas Bowie | 3,404 | 38.6 | +15.9 | |
Labor hold | Swing | -15.9 | |||
Party | Candidate | Votes | % | ±% | |
---|---|---|---|---|---|
Labor | Ian Taylor | 7,743 | 80.1 | +8.5 | |
Independent | Stephanie Farrell | 1,927 | 19.9 | +19.9 | |
Total formal votes | 9,670 | 96.6 | 0.0 | ||
Informal votes | 341 | 3.4 | 0.0 | ||
Turnout | 10,011 | 89.5 | −1.2 | ||
Labor hold | Swing | +6.0 | |||
Party | Candidate | Votes | % | ±% | |
---|---|---|---|---|---|
Labor | Ian Taylor | 5,735 | 71.6 | ||
Liberal | Ross Lightfoot | 1,871 | 23.3 | ||
Independent | Maxine Cable | 408 | 5.1 | ||
Total formal votes | 8,014 | 96.6 | |||
Informal votes | 279 | 3.4 | |||
Turnout | 8,293 | 90.7 | |||
Two-party-preferred result | |||||
Labor | Ian Taylor | 5,938 | 74.1 | ||
Liberal | Ross Lightfoot | 2,076 | 25.9 | ||
Labor hold | Swing | ||||
Party | Candidate | Votes | % | ±% | |
---|---|---|---|---|---|
Labor | Ian Taylor | 4,158 | 70.9 | +6.4 | |
Liberal | Robert Moffat | 1,703 | 29.1 | −6.4 | |
Total formal votes | 5,861 | 98.7 | +3.9 | ||
Informal votes | 77 | 1.3 | −3.9 | ||
Turnout | 5,938 | 81.2 | −4.9 | ||
Labor hold | Swing | +6.4 | |||
Party | Candidate | Votes | % | ±% | |
---|---|---|---|---|---|
Labor | Ted Evans | 4,109 | 64.5 | +2.5 | |
Liberal | Douglas Daws | 2,264 | 35.5 | +3.9 | |
Total formal votes | 6,373 | 94.8 | −1.4 | ||
Informal votes | 346 | 5.2 | +1.4 | ||
Turnout | 6,719 | 86.1 | −3.0 | ||
Labor hold | Swing | +0.9 | |||
Party | Candidate | Votes | % | ±% | |
---|---|---|---|---|---|
Labor | Tom Evans | 4,184 | 62.0 | ||
Liberal | Stuart Dunkley | 2,132 | 31.6 | ||
Progress | Graham Mills | 434 | 6.4 | ||
Total formal votes | 6,750 | 96.2 | |||
Informal votes | 269 | 3.8 | |||
Turnout | 7,019 | 89.1 | |||
Two-party-preferred result | |||||
Labor | Tom Evans | 4,292 | 63.6 | ||
Liberal | Stuart Dunkley | 2,458 | 36.4 | ||
Labor hold | Swing | ||||
Party | Candidate | Votes | % | ±% | |
---|---|---|---|---|---|
Labor | Tom Evans | 3,623 | 62.1 | ||
Liberal | Max Finlayson | 1,867 | 32.0 | ||
National Alliance | Geoffrey Sands | 346 | 5.9 | ||
Total formal votes | 5,836 | 92.8 | |||
Informal votes | 455 | 7.2 | |||
Turnout | 6,291 | 88.7 | |||
Two-party-preferred result | |||||
Labor | Tom Evans | 3,675 | 63.0 | ||
Liberal | Max Finlayson | 2,161 | 37.0 | ||
Labor hold | Swing | ||||
Party | Candidate | Votes | % | ±% | |
---|---|---|---|---|---|
Labor | Tom Evans | 3,905 | 69.1 | −30.9 | |
Liberal | Ian Wedgewood | 1,409 | 24.9 | +24.9 | |
Democratic Labor | Geoffrey Sands | 336 | 6.0 | +6.0 | |
Total formal votes | 5,650 | 97.5 | |||
Informal votes | 143 | 2.5 | |||
Turnout | 5,793 | 89.4 | |||
Two-party-preferred result | |||||
Labor | Tom Evans | 3,955 | 70.0 | −30.0 | |
Liberal | Ian Wedgewood | 1,695 | 30.0 | +30.0 | |
Labor hold | Swing | N/A | |||
Party | Candidate | Votes | % | ±% | |
---|---|---|---|---|---|
Labor | Tom Evans | unopposed | |||
Labor hold | Swing | ||||
Party | Candidate | Votes | % | ±% | |
---|---|---|---|---|---|
Labor | Tom Evans | unopposed | |||
Labor hold | Swing | ||||
Party | Candidate | Votes | % | ±% | |
---|---|---|---|---|---|
Labor | Tom Evans | 4,195 | 76.3 | ||
Liberal and Country | Graham Jonas | 1,303 | 23.7 | ||
Total formal votes | 5,498 | 99.1 | |||
Informal votes | 50 | 0.9 | |||
Turnout | 5,548 | 92.6 | |||
Labor hold | Swing | ||||
Party | Candidate | Votes | % | ±% | |
---|---|---|---|---|---|
Labor | Tom Evans | 3,038 | 70.2 | −0.3 | |
Liberal and Country | Percy Millington | 817 | 18.9 | −10.6 | |
Independent | Harold Illingworth | 476 | 11.0 | +11.0 | |
Total formal votes | 4,331 | 98.8 | +0.6 | ||
Informal votes | 52 | 1.2 | −0.6 | ||
Turnout | 4,383 | 92.5 | −0.3 | ||
Two-party-preferred result | |||||
Labor | Tom Evans | 75.6 | +5.1 | ||
Liberal and Country | Percy Millington | 24.4 | −5.1 | ||
Labor hold | Swing | +5.1 | |||
Party | Candidate | Votes | % | ±% | |
---|---|---|---|---|---|
Labor | Tom Evans | 3,052 | 70.5 | ||
Liberal and Country | George Brand | 1,276 | 29.5 | ||
Total formal votes | 4,328 | 98.2 | |||
Informal votes | 78 | 1.8 | |||
Turnout | 4,406 | 92.8 | |||
Labor hold | Swing | ||||
Party | Candidate | Votes | % | ±% | |
---|---|---|---|---|---|
Labor | Herbert Styants | unopposed | |||
Labor hold | Swing | ||||
Party | Candidate | Votes | % | ±% | |
---|---|---|---|---|---|
Labor | Herbert Styants | 2,513 | 67.0 | ||
Liberal and Country | Albert Rogers | 1,239 | 33.0 | ||
Total formal votes | 3,752 | 98.1 | |||
Informal votes | 72 | 1.9 | |||
Turnout | 3,824 | 86.5 | |||
Labor hold | Swing | ||||
Party | Candidate | Votes | % | ±% | |
---|---|---|---|---|---|
Labor | Herbert Styants | unopposed | |||
Labor hold | Swing | ||||
Party | Candidate | Votes | % | ±% | |
---|---|---|---|---|---|
Labor | Herbert Styants | unopposed | |||
Labor hold | Swing | ||||
Party | Candidate | Votes | % | ±% | |
---|---|---|---|---|---|
Labor | Herbert Styants | 2,676 | 66.0 | +20.2 | |
Nationalist | Harold Kingsbury | 1,380 | 34.0 | +34.0 | |
Total formal votes | 4,056 | 98.7 | 0.0 | ||
Informal votes | 52 | 1.3 | 0.0 | ||
Turnout | 4,108 | 92.8 | +35.2 | ||
Labor hold | Swing | N/A | |||
Party | Candidate | Votes | % | ±% | |
---|---|---|---|---|---|
Labor | Herbert Styants | 1,108 | 45.8 | +45.8 | |
Labor | James Cunningham | 845 | 35.0 | −30.2 | |
Labor | Robert Elliott | 465 | 19.2 | +19.2 | |
Total formal votes | 2,418 | 98.7 | +1.2 | ||
Informal votes | 31 | 1.3 | −1.2 | ||
Turnout | 2,449 | 57.6 | −31.8 | ||
Two-candidate-preferred result | |||||
Labor | Herbert Styants | 1,356 | 56.1 | ||
Labor | James Cunningham | 1,062 | 43.9 | ||
Labor hold | Swing | N/A | |||
Party | Candidate | Votes | % | ±% | |
---|---|---|---|---|---|
Labor | James Cunningham | 1,937 | 65.2 | −34.8 | |
Nationalist | Ernest Williams | 698 | 23.5 | +23.5 | |
Nationalist | Francis O'Dea | 337 | 11.3 | +11.3 | |
Total formal votes | 2,972 | 97.5 | |||
Informal votes | 77 | 2.5 | |||
Turnout | 3,049 | 89.4 | |||
Labor hold | Swing | N/A | |||
Party | Candidate | Votes | % | ±% | |
---|---|---|---|---|---|
Labor | James Cunningham | unopposed | |||
Labor hold | Swing | ||||
Party | Candidate | Votes | % | ±% | |
---|---|---|---|---|---|
Labor | James Cunningham | 1,509 | 52.5 | −10.2 | |
Nationalist | George Rainsford | 898 | 31.3 | +31.3 | |
Independent | James Cummins | 466 | 16.2 | +16.2 | |
Total formal votes | 2,873 | 98.7 | −0.9 | ||
Informal votes | 37 | 1.3 | +0.9 | ||
Turnout | 2,910 | 86.3 | +21.5 | ||
Labor hold | Swing | N/A | |||
Party | Candidate | Votes | % | ±% | |
---|---|---|---|---|---|
Labor | James Cunningham | 1,805 | 62.7 | +16.5 | |
Ind. Nationalist | Henry Raven | 839 | 29.2 | +29.2 | |
National Labor | Charles Elliott | 234 | 8.1 | +3.2 | |
Total formal votes | 2,878 | 99.6 | +0.3 | ||
Informal votes | 11 | 0.4 | −0.3 | ||
Turnout | 2,889 | 64.8 | −10.9 | ||
Labor hold | Swing | N/A | |||
Party | Candidate | Votes | % | ±% | |
---|---|---|---|---|---|
Labor | James Cunningham | 1,231 | 49.0 | +2.8 | |
Goldfields Candidate | Henry Raven | 734 | 29.2 | +29.2 | |
Independent | William Ross | 380 | 15.1 | +15.1 | |
National Labor | William Schwan | 166 | 6.6 | +1.7 | |
Total formal votes | 2,511 | 99.6 | +0.3 | ||
Informal votes | 11 | 0.4 | −0.3 | ||
Turnout | 2,522 | 55.2 | −20.5 | ||
Two-candidate-preferred result | |||||
Labor | James Cunningham | 1,273 | 50.7 | +3.7 | |
Goldfields Candidate | Henry Raven | 1,238 | 49.3 | +49.3 | |
Labor gain from Independent | Swing | N/A | |||
Party | Candidate | Votes | % | ±% | |
---|---|---|---|---|---|
Labor | Albert Green | 1,597 | 46.2 | −4.3 | |
Ind. Nationalist | John Boyland | 1,268 | 36.7 | +36.7 | |
Nationalist | Charles Cutbush | 423 | 12.2 | +12.2 | |
National Labor | Walter Close | 169 | 4.9 | +4.9 | |
Total formal votes | 3,457 | 99.3 | +0.8 | ||
Informal votes | 25 | 0.7 | −0.8 | ||
Turnout | 3,482 | 75.7 | +9.1 | ||
Two-candidate-preferred result | |||||
Ind. Nationalist | John Boyland | 1,831 | 53.0 | ||
Labor | Albert Green | 1,626 | 47.0 | ||
Ind. Nationalist gain from Labor | Swing | N/A | |||
Party | Candidate | Votes | % | ±% | |
---|---|---|---|---|---|
Labor | Albert Green | 1,902 | 50.5 | –49.5 | |
Nationalist | Charles Heppingstone | 734 | 19.5 | +19.5 | |
National Labor | Harold Seddon | 626 | 16.6 | +16.6 | |
Nationalist | Henry Davidson | 501 | 13.3 | +13.3 | |
Total formal votes | 3,763 | 98.5 | n/a | ||
Informal votes | 59 | 1.5 | n/a | ||
Turnout | 3,822 | 66.6 | n/a | ||
Labor hold | Swing | –49.5 | |||
Party | Candidate | Votes | % | ±% | |
---|---|---|---|---|---|
Labor | Albert Green | unopposed | |||
Labor hold | Swing | ||||
Party | Candidate | Votes | % | ±% | |
---|---|---|---|---|---|
Labor | George McLeod | 1,462 | 65.4 | N/A | |
Liberal | John Boileau | 772 | 34.6 | +34.6 | |
Total formal votes | 2,236 | 99.7 | |||
Informal votes | 7 | 0.3 | |||
Turnout | 2,243 | 49.1 | |||
Labor hold | Swing | N/A | |||
Party | Candidate | Votes | % | ±% | |
---|---|---|---|---|---|
Labor | Albert Green | 2,510 | 86.6 | ||
Independent | Mathias Richardson | 389 | 13.4 | ||
Total formal votes | 2,899 | 99.2 | |||
Informal votes | 22 | 0.8 | |||
Turnout | 2,921 | 60.2 | |||
Labor gain from Ministerialist | Swing | ||||
Party | Candidate | Votes | % | ±% | |
---|---|---|---|---|---|
Ministerialist | Norbert Keenan | 1,614 | 58.3 | −2.6 | |
Labour | George McLeod | 1,153 | 41.7 | +2.6 | |
Total formal votes | 2,767 | 99.6 | +0.4 | ||
Informal votes | 12 | 0.4 | −0.4 | ||
Turnout | 2,779 | 77.0 | +4.1 | ||
Ministerialist hold | Swing | -2.6 | |||
Party | Candidate | Votes | % | ±% | |
---|---|---|---|---|---|
Ind. Ministerialist | Norbert Keenan | 1,629 | 60.9 | +13.0 | |
Labour | William Johnson | 1,045 | 39.1 | –13.0 | |
Total formal votes | 2,674 | 99.2 | –0.4 | ||
Informal votes | 21 | 0.8 | +0.4 | ||
Turnout | 2,695 | 72.9 | +14.0 | ||
Ind. Ministerialist gain from Labour | Swing | +13.0 | |||
Party | Candidate | Votes | % | ±% | |
---|---|---|---|---|---|
Labour | William Johnson | 1,556 | 52.1 | +14.4 | |
Independent | Norbert Keenan | 1,431 | 47.9 | +47.9 | |
Total formal votes | 2,987 | 99.6 | +7.1 | ||
Informal votes | 12 | 0.4 | –7.1 | ||
Turnout | 3,004 | 58.9 | +8.8 | ||
Labour hold | Swing | N/A | |||
Party | Candidate | Votes | % | ±% | |
---|---|---|---|---|---|
Labour | William Johnson | 606 | 31.7 | +31.7 | |
Ministerialist | Charles Moran | 506 | 26.5 | +26.5 | |
Opposition | William Burton | 495 | 25.9 | +25.9 | |
Opposition | Alfred Shaw | 301 | 15.7 | +15.7 | |
Independent | John Stuart | 4 | 0.2 | +0.2 | |
Total formal votes | 1,912 | 92.5 | n/a | ||
Informal votes | 156 | 7.5 | n/a | ||
Turnout | 2,068 | 50.1 | n/a | ||
Labour win | (new seat) | ||||
Kalgoorlie is an electoral district of the Legislative Assembly in the Australian state of Western Australia.
This is a list of results for the electoral district of Perth in Western Australian state elections from the district's creation in 1890 until the present.
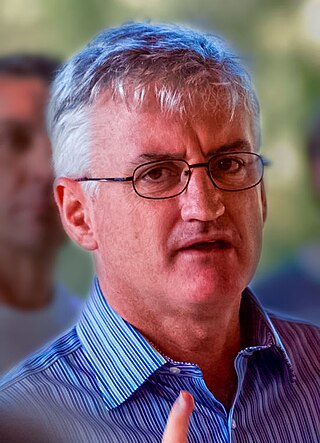
The 2008 Western Australian state election was held on Saturday 6 September 2008 to elect 59 members to the Legislative Assembly and 36 members to the Legislative Council. The incumbent centre-left Labor Party government, in power since the 2001 election and led since 25 January 2006 by Premier Alan Carpenter, was defeated by the centre-right Liberal Party opposition, led by Opposition Leader Colin Barnett since 6 August 2008.
This is a list of results for the electoral district of Belmont in Western Australian state elections. The district has had two incarnations, the first from 1962 to 1974, the second from 1989 to the present.
This is a list of electoral results for the electoral district of Pilbara in Western Australian state elections.
This is a list of electoral results for the electoral district of Maylands in Western Australian state elections from the district's creation in 1948 until the present.
This is a list of electoral results for the electoral district of Victoria Park in Western Australian state elections.
This is a list of electoral results for the electoral district of Fremantle in Western Australian state elections.
This is a list of electoral results for the electoral district of Albany in Western Australian state elections.
This is a list of electoral results for the electoral district of Bunbury in Western Australian state elections.
This is a list of electoral results for the electoral district of Cockburn in Western Australian state elections.
This is a list of electoral results for the electoral district of Darling Range in Western Australian state elections.
This is a list of electoral results for the electoral district of Kimberley in Western Australian state elections.
This is a list of electoral results for the electoral district of Morley in Western Australian state elections.
This is a list of electoral results for the electoral district of Mount Lawley in Western Australian state elections.
This is a list of electoral results for the electoral district of Murray-Wellington in Western Australian state elections.
This is a list of electoral results for the electoral district of Warren-Blackwood in Western Australian state elections.
This is a list of electoral results for the Electoral district of Roe in Western Australian elections.
This is a list of electoral district results of the 2021 Western Australian election.
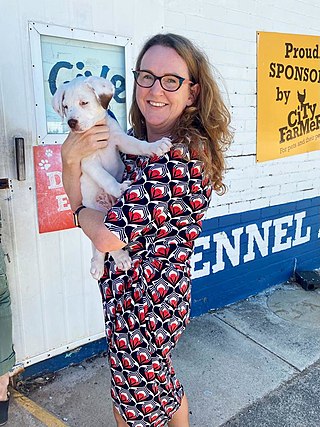
Katrina Stratton is a member of the Western Australian Legislative Assembly for the electoral district of Nedlands for the Australian Labor Party. She won her seat at the 2021 Western Australian state election. In July 2024, Stratton announced she would be leaving the Nedlands and taking the Legislative Council seat vacated by Sally Talbot.