This article relies largely or entirely on a single source .(January 2025) |
This is a list of electoral results for the electoral district of Kennedy in Queensland state elections.
This article relies largely or entirely on a single source .(January 2025) |
This is a list of electoral results for the electoral district of Kennedy in Queensland state elections.
The members for Kennedy were: [1]
| Member | Party | Term | ||||
|---|---|---|---|---|---|---|
| George Elphinstone Dalrymple | none | 18 Mar 1865 – 19 Jul 1867 | ||||
| Thomas Henry FitzGerald | none | 19 Jul 1867 – 11 June 1869 | ||||
| John Bright | none | 10 July 1869 – 8 Jul 1870 | ||||
| Edward MacDevitt | none | 15 Sep 1870 – 18 Nov 1873 | ||||
| John Murtagh Macrossan | none | 25 Nov 1873 – 28 Nov 1878 | Member 2 (1878–1888) | Party | ||
| Henry Wyndham Palmer | none | 28 Nov 1878 – 5 Oct 1883 | Francis Horace Stubley | none | ||
| Isidor Lissner | Ministerial | 5 Oct 1883 – 12 May 1888 | Sir Arthur Rutledge | Ministerial | ||
| 12 May 1888 – 13 May 1893 | ||||||
| George Jackson | Labor | 13 May 1893 – 2 Oct 1909 | ||||
| James O'Sullivan | Labor | 2 Oct 1909 – 9 Oct 1920 | ||||
| John Jones | Northern Country | 9 Oct 1920 – 12 May 1923 | ||||
| Harry Bruce | Labor | 12 May 1923 – 11 June 1932 | ||||
| Arthur Fadden | CPNP | 11 June 1932 – 11 May 1935 | ||||
| Cecil Jesson | Labor | 11 May 1935 – 29 Apr 1950 | ||||
| Party | Candidate | Votes | % | ±% | |
|---|---|---|---|---|---|
| Labor | Cecil Jesson | 4,331 | 44.8 | −5.9 | |
| People's Party | Robert Johnston | 4,079 | 42.2 | +19.1 | |
| Communist | John Clubley | 1,264 | 13.1 | −13.1 | |
| Total formal votes | 9,674 | 98.2 | +0.3 | ||
| Informal votes | 178 | 1.8 | −0.3 | ||
| Turnout | 9,852 | 85.7 | +3.4 | ||
| Labor hold | Swing | N/A | |||
| Party | Candidate | Votes | % | ±% | |
|---|---|---|---|---|---|
| Labor | Cecil Jesson | 4,297 | 50.7 | −7.0 | |
| Communist | John Clubley | 2,220 | 26.2 | +15.3 | |
| People's Party | Aubrey Jurd | 1,954 | 23.1 | +23.1 | |
| Total formal votes | 8,471 | 97.9 | −0.3 | ||
| Informal votes | 180 | 2.1 | +0.3 | ||
| Turnout | 8,651 | 82.3 | −6.1 | ||
| Labor hold | Swing | N/A | |||
| Party | Candidate | Votes | % | ±% | |
|---|---|---|---|---|---|
| Labor | Cecil Jesson | 5,210 | 57.7 | −6.1 | |
| Country | Aubrey Jurd | 2,833 | 31.4 | −4.8 | |
| Communist | Florence Milburn | 980 | 10.9 | +10.9 | |
| Total formal votes | 9,023 | 98.2 | +0.3 | ||
| Informal votes | 161 | 1.8 | −0.3 | ||
| Turnout | 9,184 | 88.4 | −1.7 | ||
| Labor hold | Swing | +1.0 | |||
| Party | Candidate | Votes | % | ±% | |
|---|---|---|---|---|---|
| Labor | Cecil Jesson | 5,492 | 63.8 | −0.1 | |
| Country | James Kennedy | 3,120 | 36.2 | +0.1 | |
| Total formal votes | 8,612 | 97.9 | +1.1 | ||
| Informal votes | 183 | 2.1 | −1.1 | ||
| Turnout | 8,795 | 90.1 | −1.4 | ||
| Labor hold | Swing | −0.1 | |||
| Party | Candidate | Votes | % | ±% | |
|---|---|---|---|---|---|
| Labor | Cecil Jesson | 5,160 | 63.9 | ||
| CPNP | John Jackson | 2,920 | 36.1 | ||
| Total formal votes | 8,080 | 96.8 | |||
| Informal votes | 267 | 3.2 | |||
| Turnout | 8,347 | 91.5 | |||
| Labor gain from CPNP | Swing | ||||
| Party | Candidate | Votes | % | ±% | |
|---|---|---|---|---|---|
| CPNP | Arthur Fadden | 3,747 | 50.6 | ||
| Labor | Patrick Hayes | 3,653 | 49.4 | ||
| Total formal votes | 7,400 | 98.4 | |||
| Informal votes | 119 | 1.6 | |||
| Turnout | 7,519 | 92.2 | |||
| CPNP gain from Labor | Swing | ||||
| Party | Candidate | Votes | % | ±% | |
|---|---|---|---|---|---|
| Labor | Harry Bruce | 3,405 | 55.4 | +5.2 | |
| CPNP | Henry Hollins | 2,738 | 44.6 | +1.3 | |
| Total formal votes | 6,143 | ||||
| Informal votes | |||||
| Turnout | |||||
| Labor hold | Swing | N/A | |||
| Party | Candidate | Votes | % | ±% | |
|---|---|---|---|---|---|
| Labor | Harry Bruce | 3,122 | 50.2 | −1.2 | |
| CPNP | William Green | 2,694 | 43.3 | −5.3 | |
| Primary Producers | John Young | 405 | 6.5 | +6.5 | |
| Total formal votes | 6,221 | 98.8 | +0.4 | ||
| Informal votes | 75 | 1.2 | −0.4 | ||
| Turnout | 6,296 | 89.9 | +4.9 | ||
| Labor hold | Swing | N/A | |||
| Party | Candidate | Votes | % | ±% | |
|---|---|---|---|---|---|
| Labor | Harry Bruce | 2,757 | 51.4 | +3.4 | |
| United | John Clegg | 2,612 | 48.6 | −3.4 | |
| Total formal votes | 5,369 | 98.4 | +0.2 | ||
| Informal votes | 88 | 1.6 | −0.2 | ||
| Turnout | 5,457 | 85.0 | +8.5 | ||
| Labor gain from United | Swing | +3.4 | |||
| Party | Candidate | Votes | % | ±% | |
|---|---|---|---|---|---|
| Northern Country | John Jones | 1,102 | 52.0 | +52.0 | |
| Labor | James O'Sullivan | 1,016 | 48.0 | −13.1 | |
| Total formal votes | 2,118 | 98.2 | +0.1 | ||
| Informal votes | 38 | 1.8 | −0.1 | ||
| Turnout | 2,156 | 76.5 | 0.0 | ||
| Northern Country gain from Labor | Swing | N/A | |||
| Party | Candidate | Votes | % | ±% | |
|---|---|---|---|---|---|
| Labor | James O'Sullivan | 1,328 | 61.1 | −6.7 | |
| National | Andrew Taylor | 846 | 38.9 | +6.7 | |
| Total formal votes | 2,174 | 98.1 | +1.2 | ||
| Informal votes | 42 | 1.9 | −1.2 | ||
| Turnout | 2,216 | 76.5 | −14.3 | ||
| Labor hold | Swing | −6.7 | |||
| Party | Candidate | Votes | % | ±% | |
|---|---|---|---|---|---|
| Labor | James O'Sullivan | 1,594 | 67.8 | +10.3 | |
| Liberal | John Houghton | 756 | 32.2 | −10.3 | |
| Total formal votes | 2,350 | 96.9 | −0.9 | ||
| Informal votes | 76 | 3.1 | +0.9 | ||
| Turnout | 2,426 | 82.9 | +8.3 | ||
| Labor hold | Swing | +10.3 | |||
| Party | Candidate | Votes | % | ±% | |
|---|---|---|---|---|---|
| Labor | James O'Sullivan | 1,445 | 57.5 | ||
| Liberal | Osborn Fenwick | 1,070 | 42.5 | ||
| Total formal votes | 2,515 | 97.8 | |||
| Informal votes | 56 | 2.2 | |||
| Turnout | 2,571 | 77.5 | |||
| Labor hold | Swing | ||||
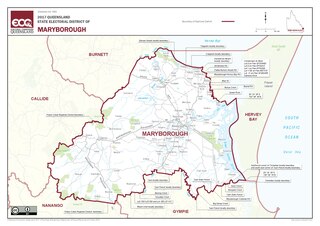
Maryborough is an electoral district of the Legislative Assembly in the Australian state of Queensland.
Brisbane North was an electoral district which elected two members to the Legislative Assembly of Queensland in the Australian state of Queensland from 1888 until 1912. It replaced the electoral district of North Brisbane.
The electoral district of Flinders was an electoral district of the Legislative Assembly in the Australian state of Queensland.
Kennedy was an electoral district of the Legislative Assembly in the Australian state of Queensland.
Northern Downs was a Legislative Assembly electorate in the state of Queensland, one of the original 16 created in 1859. It covered the Dalby and Condamine areas. In the electoral redistribution of 1887, Northern Downs was split into two new electoral districts, the Electoral district of Dalby and the Electoral district of Murilla.
Clermont was a Legislative Assembly electorate in the state of Queensland. The electorate was based on the town of Clermont and surrounding areas.
Blackall was a Legislative Assembly electorate in the state of Queensland from 1873 to 1888.
Bremer was a Legislative Assembly electorate in the state of Queensland.
Buranda was a Legislative Assembly electorate in the state of Queensland, Australia.
Drayton was a Legislative Assembly electorate in the state of Queensland, Australia.
Maree was a Legislative Assembly electorate in the state of Queensland, Australia.
Burrum was a Legislative Assembly electorate in the state of Queensland, Australia.
Cambooya was a Legislative Assembly electorate in the state of Queensland, Australia.
Carpentaria was a Legislative Assembly electorate in the state of Queensland, Australia.
Chillagoe was an electoral district of the Legislative Assembly in the Australian state of Queensland from 1912 to 1932.
The electoral district of Eacham was a Legislative Assembly electorate in the state of Queensland. It was created in a redistribution ahead of the 1912 state election and existed until the 1932 state election.
The electoral district of Haughton was a Legislative Assembly electorate in the state of Queensland, Australia. It was first created in a redistribution ahead of the 1950 state election, and existed until the 1960 state election.
The electoral district of Woothakata was a Legislative Assembly electorate in the state of Queensland. It was first created in a redistribution ahead of the 1888 colonial election, and existed until the 1912 state election.
The Tableland was a Legislative Assembly electorate in the state of Queensland, Australia.
Charles Fitzsimmons (1802—1876) was an Irish-born politician and sugar farmer in Queensland, Australia. He was a Member of the Queensland Legislative Assembly.
This article needs additional or more specific categories .(January 2025) |