This is a list of electoral results for the electoral district of Windsor in Queensland state elections.
Member | Party | Term | |
---|---|---|---|
Hugh Macrossan | Liberal | 1912–1915 | |
Herbert McPhail | Labor | 1915–1918 | |
Charles Taylor | National United Country and Progressive National | 1918–1935 | |
Herbert Williams | Labor | 1935–1941 | |
Harry Moorhouse | Independent Democrat | 1941–1944 | |
Bruce Pie | Queensland People's | 1944–1950 | |
Tom Rasey | Labor | 1950–1957 | |
Queensland Labor | 1957 | ||
Ray Smith | Liberal | 1957–1969 | |
Bob Moore | Liberal | 1969–1983 | |
National | 1983 | ||
Pat Comben | Labor | 1983–1992 | |
Party | Candidate | Votes | % | ±% | |
---|---|---|---|---|---|
Labor | Pat Comben | 11,468 | 62.3 | +10.5 | |
Liberal | Kaye Harcourt | 4,742 | 25.8 | +4.6 | |
National | Andrew Hassall | 2,196 | 11.9 | −15.1 | |
Total formal votes | 18,406 | 97.4 | −0.6 | ||
Informal votes | 495 | 2.6 | +0.6 | ||
Turnout | 18,901 | 91.2 | −0.2 | ||
Two-party-preferred result | |||||
Labor | Pat Comben | 11,633 | 63.2 | +5.5 | |
Liberal | Kaye Harcourt | 6,773 | 36.8 | +36.8 | |
Labor hold | Swing | +5.5 | |||
Party | Candidate | Votes | % | ±% | |
---|---|---|---|---|---|
Labor | Pat Comben | 9,211 | 51.8 | +4.4 | |
National | Bob Moore | 4,800 | 27.0 | −5.4 | |
Liberal | Karen Muir-McCarey | 3,775 | 21.2 | +1.1 | |
Total formal votes | 17,786 | 98.0 | |||
Informal votes | 367 | 2.0 | |||
Turnout | 18,153 | 91.4 | |||
Two-party-preferred result | |||||
Labor | Pat Comben | 10,263 | 57.7 | +3.0 | |
National | Bob Moore | 7,523 | 42.3 | −3.0 | |
Labor hold | Swing | +3.0 | |||
Party | Candidate | Votes | % | ±% | |
---|---|---|---|---|---|
Labor | Pat Comben | 6,868 | 47.4 | +2.4 | |
National | Bob Moore | 4,696 | 32.4 | +32.4 | |
Liberal | Ann Garms | 2,915 | 20.1 | −27.1 | |
Total formal votes | 14,479 | 98.7 | +0.2 | ||
Informal votes | 195 | 1.3 | −0.2 | ||
Turnout | 14,674 | 92.7 | +3.5 | ||
Two-party-preferred result | |||||
Labor | Pat Comben | 7,549 | 52.1 | +3.4 | |
National | Bob Moore | 6,930 | 47.9 | +47.9 | |
Labor gain from Liberal | Swing | +3.4 | |||
Party | Candidate | Votes | % | ±% | |
---|---|---|---|---|---|
Liberal | Bob Moore | 6,685 | 47.5 | −7.0 | |
Labor | Frank Melit | 6,323 | 45.0 | −0.5 | |
Independent | Louis McKenzie | 1,055 | 7.5 | +7.5 | |
Total formal votes | 14,063 | 98.5 | +0.1 | ||
Informal votes | 218 | 1.5 | −0.1 | ||
Turnout | 14,281 | 89.2 | −0.5 | ||
Two-party-preferred result | |||||
Liberal | Bob Moore | 7,213 | 51.3 | −3.2 | |
Labor | Frank Melit | 6,850 | 48.7 | +3.2 | |
Liberal hold | Swing | -3.2 | |||
Party | Candidate | Votes | % | ±% | |
---|---|---|---|---|---|
Liberal | Bob Moore | 7,736 | 54.5 | −6.5 | |
Labor | Louis McKenzie | 6,462 | 45.5 | +13.3 | |
Total formal votes | 14,198 | 98.4 | |||
Informal votes | 227 | 1.6 | |||
Turnout | 14,425 | 89.7 | |||
Liberal hold | Swing | -9.3 | |||
Party | Candidate | Votes | % | ±% | |
---|---|---|---|---|---|
Liberal | Bob Moore | 7,505 | 61.0 | +17.5 | |
Labor | Gloria Markland | 3,960 | 32.2 | −11.6 | |
Queensland Labor | Anne Wenck | 484 | 3.9 | −8.8 | |
Independent | Mervyn Chambers | 358 | 2.9 | +2.9 | |
Total formal votes | 12,307 | 98.5 | −0.2 | ||
Informal votes | 185 | 1.5 | +0.2 | ||
Turnout | 12,492 | 89.7 | −3.9 | ||
Two-party-preferred result | |||||
Liberal | Bob Moore | 8,086 | 65.7 | +10.6 | |
Labor | Gloria Markland | 4,221 | 34.3 | −10.6 | |
Liberal hold | Swing | +10.6 | |||
Party | Candidate | Votes | % | ±% | |
---|---|---|---|---|---|
Labor | Bryan Walsh | 5,090 | 43.8 | −1.8 | |
Liberal | Bob Moore | 5,060 | 43.5 | +1.0 | |
Queensland Labor | Thomas Heike | 1,480 | 12.7 | +0.8 | |
Total formal votes | 11,630 | 98.7 | |||
Informal votes | 157 | 1.3 | |||
Turnout | 11,787 | 93.6 | |||
Two-party-preferred result | |||||
Liberal | Bob Moore | 6,408 | 55.1 | +1.6 | |
Labor | Bryan Walsh | 5,222 | 44.9 | −1.6 | |
Liberal hold | Swing | +1.6 | |||
Party | Candidate | Votes | % | ±% | |
---|---|---|---|---|---|
Labor | Keith Fordyce | 4,607 | 45.6 | +1.7 | |
Liberal | Bob Moore | 4,294 | 42.5 | −6.3 | |
Queensland Labor | John Dawson | 1,198 | 11.9 | +3.7 | |
Total formal votes | 10,099 | 98.6 | 0.0 | ||
Informal votes | 138 | 1.4 | 0.0 | ||
Turnout | 10,237 | 91.9 | −1.9 | ||
Two-party-preferred result | |||||
Liberal | Bob Moore | 5,196 | 51.5 | −4.6 | |
Labor | Keith Fordyce | 4,903 | 48.5 | +4.6 | |
Liberal hold | Swing | -4.6 | |||
Party | Candidate | Votes | % | ±% | |
---|---|---|---|---|---|
Liberal | Ray Smith | 5,049 | 48.3 | −2.7 | |
Labor | Keith Fordyce | 4,546 | 43.5 | +3.8 | |
Queensland Labor | Vincent Wenck | 851 | 8.1 | −1.1 | |
Total formal votes | 10,446 | 98.6 | 0.0 | ||
Informal votes | 151 | 1.4 | 0.0 | ||
Turnout | 10,597 | 94.6 | −0.7 | ||
Two-party-preferred result | |||||
Liberal | Ray Smith | 5,860 | 56.1 | −2.4 | |
Labor | Keith Fordyce | 4,546 | 43.9 | +2.4 | |
Liberal hold | Swing | -2.4 | |||
Party | Candidate | Votes | % | ±% | |
---|---|---|---|---|---|
Liberal | Ray Smith | 5,369 | 51.0 | +1.1 | |
Labor | George Georgouras | 4,180 | 39.7 | +4.0 | |
Queensland Labor | Owen O'Donoghue | 971 | 9.2 | −5.1 | |
Total formal votes | 10,520 | 98.6 | −0.6 | ||
Informal votes | 148 | 1.4 | +0.6 | ||
Turnout | 10,668 | 95.3 | +1.8 | ||
Two-party-preferred result | |||||
Liberal | Ray Smith | 6,159 | 58.5 | ||
Labor | George Georgouras | 4,361 | 41.5 | ||
Liberal hold | Swing | N/A | |||
Party | Candidate | Votes | % | ±% | |
---|---|---|---|---|---|
Liberal | Ray Smith | 5,364 | 49.9 | ||
Labor | George Georgouras | 3,834 | 35.7 | ||
Queensland Labor | Percy Hotham | 1,541 | 14.3 | ||
Total formal votes | 10,739 | 99.2 | |||
Informal votes | 90 | 0.8 | |||
Turnout | 10,829 | 93.5 | |||
Liberal hold | Swing | ||||
Party | Candidate | Votes | % | ±% | |
---|---|---|---|---|---|
Liberal | Ray Smith | 3,760 | 38.9 | −4.8 | |
Queensland Labor | Tom Rasey | 3,733 | 38.6 | +38.6 | |
Labor | Kenneth Kemshead | 2,165 | 22.4 | −33.9 | |
Total formal votes | 9,658 | 99.0 | +0.2 | ||
Informal votes | 100 | 1.0 | −0.2 | ||
Turnout | 9,758 | 95.3 | +0.7 | ||
Liberal gain from Labor | Swing | N/A | |||
Party | Candidate | Votes | % | ±% | |
---|---|---|---|---|---|
Labor | Tom Rasey | 5,459 | 56.3 | −3.9 | |
Liberal | Margaret Gordon | 4,240 | 43.7 | +3.9 | |
Total formal votes | 9,699 | 98.8 | −0.1 | ||
Informal votes | 121 | 1.2 | +0.1 | ||
Turnout | 9,820 | 94.6 | +0.5 | ||
Labor hold | Swing | -3.9 | |||
Party | Candidate | Votes | % | ±% | |
---|---|---|---|---|---|
Labor | Tom Rasey | 6,011 | 60.2 | +10.1 | |
Liberal | John Cutting | 3,980 | 39.8 | −10.1 | |
Total formal votes | 9,901 | 98.9 | −0.2 | ||
Informal votes | 108 | 1.1 | +0.2 | ||
Turnout | 10,009 | 94.1 | +0.5 | ||
Labor hold | Swing | +10.1 | |||
Party | Candidate | Votes | % | ±% | |
---|---|---|---|---|---|
Labor | Tom Rasey | 5,213 | 50.1 | ||
Liberal | Alexander Devene | 5,184 | 49.9 | ||
Total formal votes | 10,397 | 99.1 | |||
Informal votes | 94 | 0.9 | |||
Turnout | 10,491 | 93.6 | |||
Labor gain from Liberal | Swing | ||||
Party | Candidate | Votes | % | ±% | |
---|---|---|---|---|---|
People's Party | Bruce Pie | 6,618 | 58.1 | +6.9 | |
Labor | Erle Wettemeyer | 4,766 | 41.9 | +1.1 | |
Total formal votes | 11,384 | 99.0 | 0.0 | ||
Informal votes | 109 | 1.0 | 0.0 | ||
Turnout | 11,493 | 92.4 | +2.5 | ||
People's Party hold | Swing | +2.5 | |||
Party | Candidate | Votes | % | ±% | |
---|---|---|---|---|---|
People's Party | Bruce Pie | 5,353 | 51.2 | +37.3 | |
Labor | William Hoy | 4,266 | 40.8 | −3.8 | |
Independent | Harry Moorhouse | 833 | 8.0 | −33.5 | |
Total formal votes | 10,452 | 99.0 | +0.4 | ||
Informal votes | 106 | 1.0 | −0.4 | ||
Turnout | 10,558 | 89.9 | −2.9 | ||
People's Party gain from Independent | Swing | N/A | |||
Party | Candidate | Votes | % | ±% | |
---|---|---|---|---|---|
Labor | Herbert Williams | 4,491 | 44.6 | −1.6 | |
Independent | Harry Moorhouse | 4,185 | 41.5 | +41.5 | |
United Australia | Neil O'Sullivan | 1,401 | 13.9 | −21.4 | |
Total formal votes | 10,077 | 98.6 | −0.2 | ||
Informal votes | 138 | 1.4 | +0.2 | ||
Turnout | 10,215 | 92.8 | −1.8 | ||
Two-candidate-preferred result | |||||
Independent | Harry Moorhouse | 4,647 | 50.3 | +50.3 | |
Labor | Herbert Williams | 4,590 | 49.7 | −5.0 | |
Independent gain from Labor | Swing | N/A | |||
Party | Candidate | Votes | % | ±% | |
---|---|---|---|---|---|
Labor | Herbert Williams | 4,592 | 46.2 | −11.3 | |
United Australia | Edward Simpson | 3,521 | 35.3 | −7.2 | |
Protestant Labor | Cecil Maxwell | 1,291 | 13.0 | +13.0 | |
Independent Labor | Henry Bond | 546 | 5.5 | +5.5 | |
Total formal votes | 9,950 | 98.8 | +0.3 | ||
Informal votes | 124 | 1.2 | −0.3 | ||
Turnout | 10,074 | 94.6 | +0.2 | ||
Two-party-preferred result | |||||
Labor | Herbert Williams | 4,880 | 54.7 | −2.8 | |
United Australia | Edward Simpson | 4,042 | 45.3 | +2.8 | |
Labor hold | Swing | -2.8 | |||
Party | Candidate | Votes | % | ±% | |
---|---|---|---|---|---|
Labor | Herbert Williams | 5,253 | 57.5 | ||
CPNP | Charles Taylor | 3,886 | 42.5 | ||
Total formal votes | 9,139 | 98.5 | |||
Informal votes | 141 | 1.5 | |||
Turnout | 9,280 | 94.4 | |||
Labor gain from CPNP | Swing | ||||
Party | Candidate | Votes | % | ±% | |
---|---|---|---|---|---|
CPNP | Charles Taylor | 4,291 | 46.7 | ||
Labor | Ernest Manchester | 3,395 | 37.0 | ||
Independent Labor | Donald MacKenzie | 951 | 10.4 | ||
Independent | Francis Corbett | 541 | 5.9 | ||
Total formal votes | 9,178 | 99.1 | |||
Informal votes | 83 | 0.9 | |||
Turnout | 9,261 | 88.6 | |||
Two-party-preferred result | |||||
CPNP | Charles Taylor | 4,522 | 54.0 | ||
Labor | Ernest Manchester | 3,852 | 46.0 | ||
CPNP hold | Swing | ||||
Party | Candidate | Votes | % | ±% | |
---|---|---|---|---|---|
CPNP | Charles Taylor | 5,312 | 63.5 | +5.2 | |
Labor | Harry Nowotny | 3,049 | 36.5 | −5.2 | |
Total formal votes | 8,361 | 99.1 | +0.2 | ||
Informal votes | 74 | 0.9 | −0.2 | ||
Turnout | 8,435 | 92.6 | +0.8 | ||
CPNP hold | Swing | +5.2 | |||
Party | Candidate | Votes | % | ±% | |
---|---|---|---|---|---|
CPNP | Charles Taylor | 4,468 | 58.3 | +0.7 | |
Labor | Donald MacKenzie | 3,193 | 41.7 | −0.7 | |
Total formal votes | 7,661 | 98.9 | −0.4 | ||
Informal votes | 85 | 1.1 | +0.4 | ||
Turnout | 7,746 | 91.8 | +4.0 | ||
CPNP hold | Swing | +0.7 | |||
Party | Candidate | Votes | % | ±% | |
---|---|---|---|---|---|
United | Charles Taylor | 3,869 | 57.6 | +3.0 | |
Labor | Sidney Cook | 2,843 | 42.4 | −3.0 | |
Total formal votes | 6,712 | 99.3 | +0.1 | ||
Informal votes | 44 | 0.7 | −0.1 | ||
Turnout | 6,756 | 87.8 | +0.7 | ||
United hold | Swing | +3.0 | |||
Party | Candidate | Votes | % | ±% | |
---|---|---|---|---|---|
National | Charles Taylor | 5,567 | 54.6 | +4.1 | |
Labor | Herbert McPhail | 4,627 | 45.4 | −4.1 | |
Total formal votes | 10,194 | 99.2 | −0.4 | ||
Informal votes | 79 | 0.8 | +0.4 | ||
Turnout | 10,273 | 87.1 | −0.5 | ||
National hold | Swing | +4.1 | |||
Party | Candidate | Votes | % | ±% | |
---|---|---|---|---|---|
National | Charles Taylor | 4,373 | 50.5 | +3.5 | |
Labor | Herbert McPhail | 4,281 | 49.5 | −3.5 | |
Total formal votes | 8,654 | 99.6 | +1.1 | ||
Informal votes | 34 | 0.4 | −1.1 | ||
Turnout | 8,688 | 87.6 | −3.6 | ||
National gain from Labor | Swing | +3.5 | |||
Party | Candidate | Votes | % | ±% | |
---|---|---|---|---|---|
Labor | Herbert McPhail | 3,343 | 53.0 | +10.1 | |
Liberal | Hugh Macrossan | 2,969 | 47.0 | −10.1 | |
Total formal votes | 6,312 | 98.5 | −0.8 | ||
Informal votes | 97 | 1.5 | +0.8 | ||
Turnout | 6,409 | 91.2 | +6.2 | ||
Labor gain from Liberal | Swing | +10.1 | |||
Party | Candidate | Votes | % | ±% | |
---|---|---|---|---|---|
Liberal | Hugh Macrossan | 2,488 | 57.1 | ||
Labor | Walter Crampton | 1,837 | 42.9 | ||
Total formal votes | 4,285 | 99.3 | |||
Informal votes | 32 | 0.7 | |||
Turnout | 4,317 | 85.0 | |||
Liberal hold | Swing | ||||
The Division of Brisbane is an Australian electoral division in the state of Queensland.
Windsor—Tecumseh is a federal electoral district in Ontario, Canada, that has been represented in the House of Commons of Canada since 2004.
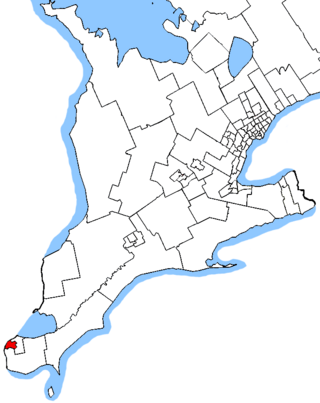
Windsor West is a federal electoral district in Ontario, Canada, that has been represented in the House of Commons of Canada since 1968.
Maidenhead is a constituency in Berkshire represented in the House of Commons of the Parliament of the United Kingdom by Joshua Reynolds, a Liberal Democrat, since 2024. Following its creation at the 1997 general election, the seat was held for twenty-seven years by Conservative Member of Parliament Theresa May, who served as Home Secretary from 2010 to 2016 and as Prime Minister from 2016 to 2019.
The Division of New England is an Australian electoral division in the state of New South Wales.
Brisbane Central was an electoral division in the state of Queensland, Australia.
This is a list of current and former electoral divisions for the Legislative Assembly of Queensland, the state legislature for Queensland, Australia.
Elections were held in the Australian state of Queensland on 19 September 1992 to elect the 89 members of the state's Legislative Assembly.
Windsor and Maidenhead Borough Council is the local authority for the Royal Borough of Windsor and Maidenhead, which is a unitary authority in Berkshire, England. Until 1 April 1998 it was a non-metropolitan district. Elections are held every four years. Since the last boundary changes in 2019 there have been 41 councillors elected from 19 wards.
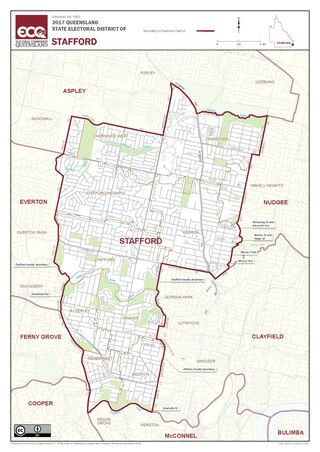
Stafford is a Legislative Assembly of Queensland electoral district in the state of Queensland, Australia.
The 2010 Australian federal election was held on Saturday, 21 August 2010 to elect members of the 43rd Parliament of Australia. The incumbent centre-left Australian Labor Party led by Prime Minister Julia Gillard won a second term against the opposition centre-right Liberal Party of Australia led by Opposition Leader Tony Abbott and Coalition partner the National Party of Australia, led by Warren Truss, after Labor formed a minority government with the support of three independent MPs and one Australian Greens MP.
Windsor West is a provincial electoral district in Ontario, Canada, represented in the Legislative Assembly of Ontario from 1967 to 1975 since 1999.
Kurwongbah is an electoral district of the Legislative Assembly in the Australian state of Queensland which existed at first from 1992 to 2009, and was re-introduced for the 2017 state election. It is named after Lake Kurwongbah.The district is based in the City of Moreton Bay.
Windsor was an electoral district of the Legislative Assembly in the Australian state of Queensland from 1912 to 1992.
The following tables show state-by-state results in the Australian House of Representatives at the 2010 federal election, Labor 72, Coalition 72, Nationals (WA) 1, Australian Greens 1, with 4 independents.
The Enoggera Ward is a Brisbane City Council ward in Queensland, Australia, covering Enoggera, Gaythorne, Mitchelton, Newmarket, Wilston and parts of Alderley, Ashgrove, Grange, Keperra and Windsor.
The Hamilton Ward is a Brisbane City Council ward covering Hamilton, Albion, Ascot, Clayfield, Eagle Farm, Hendra, Kalinga, Pinkenba, Wooloowin, and parts of Nundah and Windsor.
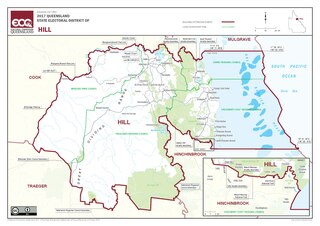
Hill is an electoral district of the Legislative Assembly in the Australian state of Queensland. It was created in the 2017 redistribution, and first contested at the Queensland state election the same year. It was named after geologist Dorothy Hill.
Windsor, an electoral district of the Legislative Assembly in the Australian state of New South Wales was created in 1859 and abolished in 1880.
The following tables show results for the Australian House of Representatives at the 2001 federal election held on 10 November 2001. The parliament increased from 148 to 150 seats, with a new seat in Western Australia and a new seat in the Northern Territory.