Geologic modelling

Last updated
Geological mapping software displaying a screenshot of a structure map generated for an 8500ft deep gas & Oil reservoir in the Earth field, Vermilion Parish, Erath, Louisiana. The left-to-right gap, near the top of the contour map indicates a Fault line. This fault line is between the blue/green contour lines and the purple/red/yellow contour lines. The thin red circular contour line in the middle of the map indicates the top of the oil reservoir. Because gas floats above oil, the thin red contour line marks the gas/oil contact zone. Contour map software screen snapshot of isopach map for 8500ft deep OIL reservoir with a Fault line.jpg
Geological mapping software displaying a screenshot of a structure map generated for an 8500ft deep gas & Oil reservoir in the Earth field, Vermilion Parish, Erath, Louisiana. The left-to-right gap, near the top of the contour map indicates a Fault line. This fault line is between the blue/green contour lines and the purple/red/yellow contour lines. The thin red circular contour line in the middle of the map indicates the top of the oil reservoir. Because gas floats above oil, the thin red contour line marks the gas/oil contact zone.

Geologic modelling,geological modelling or geomodelling is the applied science of creating computerized representations of portions of the Earth's crust based on geophysical and geological observations made on and below the Earth surface. A geomodel is the numerical equivalent of a three-dimensional geological map complemented by a description of physical quantities in the domain of interest. [1] Geomodelling is related to the concept of Shared Earth Model; [2] which is a multidisciplinary, interoperable and updatable knowledge base about the subsurface.

Contents

Geomodelling is commonly used for managing natural resources, identifying natural hazards, and quantifying geological processes, with main applications to oil and gas fields, groundwater aquifers and ore deposits. For example, in the oil and gas industry, realistic geologic models are required as input to reservoir simulator programs, which predict the behavior of the rocks under various hydrocarbon recovery scenarios. A reservoir can only be developed and produced once; therefore, making a mistake by selecting a site with poor conditions for development is tragic and wasteful. Using geological models and reservoir simulation allows reservoir engineers to identify which recovery options offer the safest and most economic, efficient, and effective development plan for a particular reservoir.

Geologic modelling is a relatively recent subdiscipline of geology which integrates structural geology, sedimentology, stratigraphy, paleoclimatology, and diagenesis;

In 2-dimensions (2D), a geologic formation or unit is represented by a polygon, which can be bounded by faults, unconformities or by its lateral extent, or crop. In geological models a geological unit is bounded by 3-dimensional (3D) triangulated or gridded surfaces. The equivalent to the mapped polygon is the fully enclosed geological unit, using a triangulated mesh. For the purpose of property or fluid modelling these volumes can be separated further into an array of cells, often referred to as voxels (volumetric elements). These 3D grids are the equivalent to 2D grids used to express properties of single surfaces.

Geomodelling generally involves the following steps: [3]

  1. Preliminary analysis of geological context of the domain of study.
  2. Interpretation of available data and observations as point sets or polygonal lines (e.g. "fault sticks" corresponding to faults on a vertical seismic section).
  3. Construction of a structural model describing the main rock boundaries (horizons, unconformities, intrusions, faults) [4]
  4. Definition of a three-dimensional mesh honoring the structural model to support volumetric representation of heterogeneity (see Geostatistics) and solving the Partial Differential Equations which govern physical processes in the subsurface (e.g. seismic wave propagation, fluid transport in porous media).

Geologic modelling components

Structural framework

Incorporating the spatial positions of the major formation boundaries, including the effects of faulting, folding, and erosion (unconformities). The major stratigraphic divisions are further subdivided into layers of cells with differing geometries with relation to the bounding surfaces (parallel to top, parallel to base, proportional). Maximum cell dimensions are dictated by the minimum sizes of the features to be resolved (everyday example: On a digital map of a city, the location of a city park might be adequately resolved by one big green pixel, but to define the locations of the basketball court, the baseball field, and the pool, much smaller pixels – higher resolution – need to be used).

Rock type

Each cell in the model is assigned a rock type. In a coastal clastic environment, these might be beach sand, high water energy marine upper shoreface sand, intermediate water energy marine lower shoreface sand, and deeper low energy marine silt and shale. The distribution of these rock types within the model is controlled by several methods, including map boundary polygons, rock type probability maps, or statistically emplaced based on sufficiently closely spaced well data.

Reservoir quality

Reservoir quality parameters almost always include porosity and permeability, but may include measures of clay content, cementation factors, and other factors that affect the storage and deliverability of fluids contained in the pores of those rocks. Geostatistical techniques are most often used to populate the cells with porosity and permeability values that are appropriate for the rock type of each cell.

Fluid saturation

A 3D finite difference grid used in MODFLOW for simulating groundwater flow in an aquifer. MODFLOW 3D grid.png
A 3D finite difference grid used in MODFLOW for simulating groundwater flow in an aquifer.

Most rock is completely saturated with groundwater. Sometimes, under the right conditions, some of the pore space in the rock is occupied by other liquids or gases. In the energy industry, oil and natural gas are the fluids most commonly being modelled. The preferred methods for calculating hydrocarbon saturations in a geologic model incorporate an estimate of pore throat size, the densities of the fluids, and the height of the cell above the water contact, since these factors exert the strongest influence on capillary action, which ultimately controls fluid saturations.

Geostatistics

An important part of geologic modelling is related to geostatistics. In order to represent the observed data, often not on regular grids, we have to use certain interpolation techniques. The most widely used technique is kriging which uses the spatial correlation among data and intends to construct the interpolation via semi-variograms. To reproduce more realistic spatial variability and help assess spatial uncertainty between data, geostatistical simulation based on variograms, training images, or parametric geological objects is often used, e.g. [5]

Mineral Deposits

Geologists involved in mining and mineral exploration use geologic modelling to determine the geometry and placement of mineral deposits in the subsurface of the earth. Geologic models help define the volume and concentration of minerals, to which economic constraints are applied to determine the economic value of the mineralization. Mineral deposits that are deemed to be economic may be developed into a mine.

Technology

Geomodelling and CAD share a lot of common technologies. Software is usually implemented using object-oriented programming technologies in C++, Java or C# on one or multiple computer platforms. The graphical user interface generally consists of one or several 3D and 2D graphics windows to visualize spatial data, interpretations and modelling output. Such visualization is generally achieved by exploiting graphics hardware. User interaction is mostly performed through mouse and keyboard, although 3D pointing devices and immersive environments may be used in some specific cases. GIS (Geographic Information System) is also a widely used tool to manipulate geological data.

Geometric objects are represented with parametric curves and surfaces or discrete models such as polygonal meshes. [4] [6]

Gravity Highs Gravity Highs.jpg
Gravity Highs

Research in Geomodelling

Problems pertaining to Geomodelling cover: [7] [8]

History

In the 70's, geomodelling mainly consisted of automatic 2D cartographic techniques such as contouring, implemented as FORTRAN routines communicating directly with plotting hardware. The advent of workstations with 3D graphics capabilities during the 80's gave birth to a new generation of geomodelling software with graphical user interface which became mature during the 90's. [11] [12] [13]

Since its inception, geomodelling has been mainly motivated and supported by oil and gas industry.

Geologic modelling software

Software developers have built several packages for geologic modelling purposes. Such software can display, edit, digitise and automatically calculate the parameters required by engineers, geologists and surveyors. Current software is mainly developed and commercialized by oil and gas or mining industry software vendors:

Geologic modelling and visualisation
Groundwater modelling

Moreover, industry Consortia or companies are specifically working at improving standardization and interoperability of earth science databases and geomodelling software:

See also

Related Research Articles

Geostatistics is a branch of statistics focusing on spatial or spatiotemporal datasets. Developed originally to predict probability distributions of ore grades for mining operations, it is currently applied in diverse disciplines including petroleum geology, hydrogeology, hydrology, meteorology, oceanography, geochemistry, geometallurgy, geography, forestry, environmental control, landscape ecology, soil science, and agriculture. Geostatistics is applied in varied branches of geography, particularly those involving the spread of diseases (epidemiology), the practice of commerce and military planning (logistics), and the development of efficient spatial networks. Geostatistical algorithms are incorporated in many places, including geographic information systems (GIS).

Petroleum geology is the study of origin, occurrence, movement, accumulation, and exploration of hydrocarbon fuels. It refers to the specific set of geological disciplines that are applied to the search for hydrocarbons.

<span class="mw-page-title-main">Hydrogeology</span> Study of the distribution and movement of groundwater

Hydrogeology is the area of geology that deals with the distribution and movement of groundwater in the soil and rocks of the Earth's crust. The terms groundwater hydrology, geohydrology, and hydrogeology are often used interchangeably.

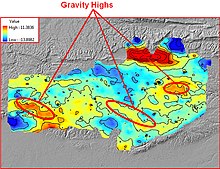
Exploration geophysics is an applied branch of geophysics and economic geology, which uses physical methods at the surface of the Earth, such as seismic, gravitational, magnetic, electrical and electromagnetic, to measure the physical properties of the subsurface, along with the anomalies in those properties. It is most often used to detect or infer the presence and position of economically useful geological deposits, such as ore minerals; fossil fuels and other hydrocarbons; geothermal reservoirs; and groundwater reservoirs. It can also be used to detect the presence of unexploded ordnance.

<span class="mw-page-title-main">Magnetotellurics</span> Electromagnetic geophysical technique

Magnetotellurics (MT) is an electromagnetic geophysical method for inferring the earth's subsurface electrical conductivity from measurements of natural geomagnetic and geoelectric field variation at the Earth's surface.

<span class="mw-page-title-main">Petrel (reservoir software)</span> Software for exploration of petroleum and gas reserves

Petrel is a software platform used in the exploration and production sector of the petroleum industry. It enables the user to interpret seismic data, perform well correlation, build reservoir models, visualize reservoir simulation results, calculate volumes, produce maps and design development strategies to maximize reservoir exploitation. Risk and uncertainty can be assessed throughout the life of the reservoir. Although some other oil servicing companies hire the services of this software, Petrel is developed and built by Schlumberger.

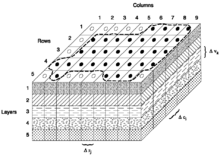
Groundwater models are computer models of groundwater flow systems, and are used by hydrologists and hydrogeologists. Groundwater models are used to simulate and predict aquifer conditions.

In geophysics, seismic inversion is the process of transforming seismic reflection data into a quantitative rock-property description of a reservoir. Seismic inversion may be pre- or post-stack, deterministic, random or geostatistical; it typically includes other reservoir measurements such as well logs and cores.

A synthetic seismogram is the result of forward modelling the seismic response of an input earth model, which is defined in terms of 1D, 2D or 3D variations in physical properties. In hydrocarbon exploration this is used to provide a 'tie' between changes in rock properties in a borehole and seismic reflection data at the same location. It can also be used either to test possible interpretation models for 2D and 3D seismic data or to model the response of the predicted geology as an aid to planning a seismic reflection survey. In the processing of wide-angle reflection and refraction (WARR) data, synthetic seismograms are used to further constrain the results of seismic tomography. In earthquake seismology, synthetic seismograms are used either to match the predicted effects of a particular earthquake source fault model with observed seismometer records or to help constrain the Earth's velocity structure. Synthetic seismograms are generated using specialized geophysical software.

<span class="mw-page-title-main">Reservoir modeling</span>

In the oil and gas industry, reservoir modeling involves the construction of a computer model of a petroleum reservoir, for the purposes of improving estimation of reserves and making decisions regarding the development of the field, predicting future production, placing additional wells and evaluating alternative reservoir management scenarios.

Geomathematics is the application of mathematical methods to solve problems in geosciences, including geology and geophysics, and particularly geodynamics and seismology.

<span class="mw-page-title-main">European Association of Geoscientists and Engineers</span> Professional organization for geoscientists and engineers

The European Association of Geoscientists and Engineers (EAGE) is a professional organization for geoscientists and engineers, established in 1951 with a worldwide membership. The association provides a platform for professionals in geophysics, petroleum exploration, geology, reservoir engineering, mining, civil engineering, digitalization and energy transition to exchange ideas and information. EAGE operates two divisions: the Oil & Gas Geoscience Division and the Near Surface Geoscience Division.

<span class="mw-page-title-main">Geothermal exploration</span>

Geothermal exploration is the exploration of the subsurface in search of viable active geothermal regions with the goal of building a geothermal power plant, where hot fluids drive turbines to create electricity. Exploration methods include a broad range of disciplines including geology, geophysics, geochemistry and engineering.

<span class="mw-page-title-main">Digital outcrop model</span> Digital 3D representation of the outcrop surface

A digital outcrop model (DOM), also called a virtual outcrop model, is a digital 3D representation of the outcrop surface, mostly in a form of textured polygon mesh.

<span class="mw-page-title-main">Ricardo A. Olea</span>

Ricardo Antonio Olea is a Chilean American who was a research mathematical statistician with the United States Geological Survey (2006–21). Previously, he spent most of his career with the National Oil Company of Chile (ENAP) in Punta Arenas and Santiago, and with the Kansas Geological Survey in Lawrence. He received the William Christian Krumbein Medal in 2004 from the International Association for Mathematical Geosciences. He served as Secretary-General (1992−1996) and President (1996–2000) for the International Association for Mathematical Geosciences; and Secretary General (2019–21) of the Compositional Data Association.

André Georges Journel is a French American engineer who excelled in formulating and promoting geostatistics in the earth sciences and engineering, first from the Centre of Mathematical Morphology in Fontainebleau, France and later from Stanford University.

SGS Genesis is the fruit of more than 30 years of expertise in software development for the modelling of mineral resources. Indeed, in 1981, SGS S.A., formerly Gamma Geostat International Inc. was among the pioneers in computer based geostatistical methods and had created one of the first geological modeling software for the first generation of supercomputers. This software is used by SGS Canada Inc., among other things, for the production of National Instrument 43-101 reports in requirement with the Canadian securities regulation. Genesis offers all the tools necessary so that mineral resources are estimated in accordance with the rules of art in conformity with generally accepted CIM Estimation of Mineral Resource and Mineral Reserve Best Practices Guidelines.

EMIGMA is a geophysics interpretation software platform developed by Petros Eikon Incorporated for data processing, simulation, inversion and imaging as well as other associated tasks. The software focuses on non-seismic applications and operates only on the Windows operating system. It supports files standard to the industry, instrument native formats as well as files used by other software in the industry such as AutoCAD, Google Earth and Oasis montaj. There is a free version of EMIGMA called EMIGMA Basic developed to allow viewing of databases created by licensed users. It does not allow data simulation nor modeling nor data import. The software is utilized by geoscientists for exploration and delineating purposes in mining, oil and gas and groundwater as well as hydrologists, environmental engineers, archaeologists and academic institutions for research purposes. Principal contributors to the software are R. W. Groom, H. Wu, E. Vassilenko, R. Jia, C. Ottay and C. Alvarez.

<span class="mw-page-title-main">Jaime Gómez-Hernández</span> Civil engineer, Hydrogeologist, Mathematical geologist

J. Jaime Gómez-Hernández is a Spanish civil engineer specialized in geostatistics and hydrogeology. He is a full professor of hydraulic engineering at the School of Civil Engineering of the Technical University of Valencia. He was conferred the William Christian Krumbein Medal in 2020 from the International Association for Mathematical Geosciences. He also received the 2020 Prince Sultan bin Abdulaziz International Prize for Water in the field of groundwater.

<span class="mw-page-title-main">Fault zone hydrogeology</span>

Fault zone hydrogeology is the study of how brittlely deformed rocks alter fluid flows in different lithological settings, such as clastic, igneous and carbonate rocks. Fluid movements, that can be quantified as permeability, can be facilitated or impeded due to the existence of a fault zone. This is because different mechanisms that deform rocks can alter porosity and permeability within a fault zone. Fluids involved in a fault system generally are groundwater and hydrocarbons.

References

Footnotes

  1. Mallet, J. L. (2008). Numerical Earth Models. European Association of Geoscientists and Engineers (EAGE Publications bv). ISBN   978-90-73781-63-4. Archived from the original on 2016-03-04. Retrieved 2013-08-20.
  2. Fanchi, John R. (August 2002). Shared Earth Modeling : Methodologies for Integrated Reservoir Simulations. Gulf Professional Publishing (Elsevier imprint). pp. xi–306. ISBN   978-0-7506-7522-2.
  3. Chen, Shang-Ying; Hsieh, Bieng-Zih; Hsu, Kuo-Chin; Chang, Yi-Fei; Liu, Jia-Wei; Fan, Kai-Chun; Chiang, Li-Wei; Han, Yin-Lung (January 2021). "Well spacing of the doublet at the Huangtsuishan geothermal site, Taiwan". Geothermics. 89: 101968. Bibcode:2021Geoth..8901968C. doi:10.1016/j.geothermics.2020.101968. S2CID   224972986.
  4. 1 2 Caumon, G., Collon-Drouaillet, P., Le Carlier de Veslud, C., Sausse, J. and Viseur, S. (2009), Surface-based 3D modeling of geological structures, Mathematical Geosciences, 41(9):927–945
  5. Cardenas, IC (2023). "A two-dimensional approach to quantify stratigraphic uncertainty from borehole data using non-homogeneous random fields". Engineering Geology. 314: 107001. Bibcode:2023EngGe.31407001C. doi: 10.1016/j.enggeo.2023.107001 . S2CID   255634245.
  6. Mallet, J.-L., Geomodeling, Applied Geostatistics Series. Oxford University Press. ISBN   978-0-19-514460-4
  7. Caumon, G., Towards stochastic time-varying geological modeling (2010), Mathematical Geosciences, 42(5):(555-569)
  8. Perrin, M., Zhu, B., Rainaud, J.F. and Schneider, S. (2005), Knowledge-driven applications for geological modeling, "Journal of Petroleum Science and Engineering", 47(1–2):89–104
  9. Tahmasebi, P., Hezarkhani, A., Sahimi, M., 2012, Multiple-point geostatistical modeling based on the cross-correlation functions, Computational Geosciences, 16(3):779-79742
  10. M.R. Alvers, H.J. Götze, B. Lahmeyer, C. Plonka and S. Schmidt, 2013, Advances in 3D Potential Field Modeling EarthDoc, 75th EAGE Conference & Exhibition incorporating SPE EUROPEC 2013
  11. Dynamic Graphics History Archived 2011-07-25 at the Wayback Machine
  12. Origin of the Gocad software
  13. J. L. Mallet, P. Jacquemin, and N. Cheimanoff (1989). GOCAD project: Geometric modeling of complex geological surfaces, SEG Expanded Abstracts 8, 126, doi : 10.1190/1.1889515