Government competitiveness

Last updated

Government competitiveness [1] [2] [3] is a state capacity concept created by Tobin Im, [4] a scholar of public administration and a professor at the Graduate School of Public Administration at Seoul National University. Since 2011, Center for Government Competitiveness (CGC) at Seoul National University has developed the Government Competitiveness (GC) index which evaluates government achievements in the various fields and furthermore provides policy recommendations to increase competitiveness of government in the future.

Contents

Description

Government competitiveness (GC) is often confounded with similar concepts. One of the prominent examples is national competitiveness. A variety of institutions have developed indices measuring the level of national competitiveness. Two indices, the World Competitiveness Scoreboard (WCS) [5] developed by the International Institute for Management Development (IMD) [6] and the Global Competitiveness Index (GCI) [7] built by the World Economic Forum (WEF) [8] have come to dominate the field of competitiveness studies.

The International Institute for Management Development WCS and the World Economic Forum the Global Competitiveness Index view national competitiveness akin to how business-friendly a nation is, and focus upon economic and market indicators. As such, if a nation is a good place for foreign firms to do business and make money, it will, as a result, be viewed as competitive. Following this logic, the role played by a government then, is mainly restricted to constructing an environment that is attractive to businesses. [9]

Stressing the broader fields of government activities, several institutions have started to develop indicators emphasizing the role of government in driving development and national competitiveness. Prominent examples include The World Bank’s Worldwide Governance Indicators (WGI) [10] and the Quality of Government Institute’s (QGI) (the University of Gothenburg) Quality of Government indicators(QoG). [11]

While these two indices constitute important steps toward improving our understanding of how government contributes toward competitiveness, they have also revealed numerous theoretical and methodological shortcomings related to the study of governments’ role in fostering national competitiveness. [12]

Since 2011, Center for Government Competitiveness (director: Tobin Im) has developed the GC index mainly focusing on government capacities and roles in national development. [13] After investigating the limited capabilities of existing competitiveness indicators to define and measure the level of GC, the CGC has tried to develop a novel approach to conceptualizing and measuring GC. [14] According to Ho and Im (2012), the concept of GC can be defined as “the power of government to, in light of various constraints, take resources from in and outside of the country and improve social, economic and cultural conditions of the nation in order to sustainably enhance citizens’ quality of life.” Moreover, the concepts of ‘constraints’ and ‘quality of life’ [15] can be interpreted in various ways, depending on a nation's unique environments.

By considering different experiences and policy practices between developed countries and developing countries, [16] the CGC measures the level of government competitiveness by applying different criteria to OECD and non-OECD countries. The seven fields of government activities both OECD and non-OECD countries have in common are followings: economy, education, health and welfare, agriculture and food, ICT, energy and environment, and governance. For OECD countries, three more fields are added: research and development, culture and tourism, and disaster management. Meanwhile, non-OECD countries have nine fields of government activities in total including infrastructure and safety. [17]

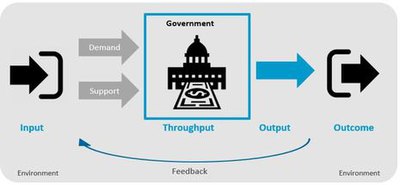
The CGC builds the GC index based on David Easton's system theory as a theoretical framework. [18] Therefore, the GC Index first analyzes competitiveness through each of the four levels- input, throughput (public management capacity), output, and outcome. The index then aggregates results from each level to produce an overall competitiveness score. This approach generates a variety of policy implications at each systemic level. The following are some sub-categories for each stage [19]

Input: resources, infrastructure, government expenditure, environment
Throughput: human, fiscal, organizational capacity, policy, system, process
Output: production, growth rate, improvement level, immediate goal achievement
Outcome: quality of life, satisfaction, social capital, ultimate goal achievement

Figure 1. GC Policy stage, edited from Easton's system theory GC policy stage,edited from Easton's system theory.jpg
Figure 1. GC Policy stage, edited from Easton's system theory

OECD rankings in 2013-2021

RankCountriesGC score 2020-21GC 2020-21GC 2019-20GC 2018-19GC 2017-18GC 2016-17GC 2015-16GC 2014-15GC 2013-14
2Flag of the Netherlands.svg  Netherlands 0.5302131822
1Flag of Denmark.svg  Denmark 0.537122251176
8Flag of Switzerland (Pantone).svg   Switzerland 0.49183312237
14Flag of Norway.svg  Norway 0.431146444155
21Flag of New Zealand.svg  New Zealand 0.4162115512144810
11Flag of Luxembourg.svg  Luxembourg 0.4591113651351313
9Flag of Finland.svg  Finland 0.486910779964
13Flag of Sweden.svg  Sweden 0.4311312898313
26Flag of Iceland.svg  Iceland 0.393262491531711
19Flag of Australia (converted).svg  Australia 0.4211919101316141211
16Flag of the United States.svg  United States 0.4281681166641
6Flag of the United Kingdom.svg  United Kingdom 0.49665128111598
4Flag of France.svg  France 0.50649131010191816
5Flag of Germany.svg  Germany 0.505541411710109
3Flag of Austria.svg  Austria 0.50737151412121717
28Flag of Canada (Pantone).svg  Canada 0.3792826161620131412
22Flag of Ireland.svg  Ireland 0.4042220171715202120
15Flag of Belgium (civil).svg  Belgium 0.4291517181817171918
10Flag of Japan.svg  Japan 0.4681014192019181514
17Flag of Spain.svg  Spain 0.4271718201918222323
12Flag of Estonia.svg  Estonia 0.4391216212222162022
7Flag of South Korea.svg  South Korea 0.492711222527211619
20Flag of Slovenia.svg  Slovenia 0.4212021232325242425
23Flag of Italy.svg  Italy 0.4042323242123272926
25Flag of Israel.svg  Israel 0.3932527252421232221
18Flag of Portugal.svg  Portugal 0.4221822262624262524
24Flag of the Czech Republic.svg  Czech Republic 0.3992425272726252627
27Flag of Poland.svg  Poland 0.3902728282829303130
32Flag of Latvia.svg  Latvia 0.33032332932........
29Flag of Hungary.svg  Hungary 0.3602929302931292829
30Flag of Greece.svg  Greece 0.3453030313030283232
33Flag of Slovakia.svg  Slovak Republic 0.3283331323128313031
34Flag of Chile.svg  Chile 0.3163434333332322728
35Flag of Turkey.svg  Turkey 0.2863536343534343333
37Flag of Mexico.svg  Mexico 0.2683735353433333434

Non-OECD rankings in 2013-2021

RankCountriesGC score 2021-20GC 2021-20GC 2020-19GC 2018-19GC 2017-18GC 2016-17GC 2015-16GC 2014-15GC 2013-14
1Flag of Singapore.svg  Singapore 0.7111111111
2Flag of South Korea.svg  South Korea 0.67923222222
.Flag of Lithuania.svg  Lithuania ...336863
3Flag of Costa Rica.svg  Costa Rica 0.61832454345
9Flag of Uruguay.svg  Uruguay 0.54997545654
4Flag of Malaysia.svg  Malaysia 0.60244698478
5Flag of Bulgaria.svg  Bulgaria 0.6005577117711
6Flag of Romania.svg  Romania 0.592668891524.
12Flag of Croatia.svg  Croatia 0.5461213971917159
34Flag of Qatar.svg  Qatar 0.48334271063536
15Flag of Panama.svg  Panama 0.5411581113131016.
10Flag of Brazil.svg  Brazil 0.5491010121616191013
19Flag of Mauritius.svg  Mauritius 0.5211921131012168.
14Flag of the People's Republic of China.svg  China 0.542149141525202521
11Flag of Russia.svg  Russian Federation 0.5471116151418243130
7Flag of Serbia.svg  Serbia 0.5797111619221823.
29Flag of Georgia.svg  Georgia 0.4972925171234251310
18Flag of Belarus.svg  Belarus 0.52218231817101317.
22Flag of Albania.svg  Albania 0.51922331918393644.
38Flag of Kuwait.svg  Kuwait 0.4823828202014123233
8Flag of Thailand.svg  Thailand 0.551812212620111414
35Flag of Bahrain.svg  Bahrain 0.4833548222115141212
.Flag of Colombia.svg  Colombia ..14232923231915
20Flag of Peru.svg  Peru 0.5202019242526324227
13Flag of Argentina.svg  Argentina 0.5441315252317212223
17Flag of Mongolia.svg  Mongolia 0.5241732262245543819
49Flag of Oman.svg  Oman 0.4504949272424272816
43Flag of Azerbaijan.svg  Azerbaijan 0.4714334283027374525
42Flag of Armenia.svg  Armenia 0.47142372928284929.
62Flag of Moldova.svg  Moldova 0.41562523031384826.
24Flag of Vietnam.svg  Vietnam 0.5152420313231223420
36Flag of the Philippines.svg  Philippines 0.4833631323737263737
21Flag of Ukraine.svg  Ukraine 0.5192130333535384628
25Flag of Ecuador.svg  Ecuador 0.5082518343833281835
32Flag of Tunisia.svg  Tunisia 0.4853235353432352111
39Flag of Jamaica.svg  Jamaica 0.48239503643474649.
47Flag of Uzbekistan.svg  Uzbekistan 0.4544762373936434746
16Flag of Kazakhstan.svg  Kazakhstan 0.5411624383621292017
23Flag of Indonesia.svg  Indonesia 0.5182317394843304331
48Flag of Paraguay.svg  Paraguay 0.4544845403340335138
37Flag of Morocco.svg  Morocco 0.4823736414044473029
28Flag of the Dominican Republic.svg  Dominican Republic 0.49928224249414439.
33Flag of Jordan.svg  Jordan 0.48533434327303136.
27Flag of Sri Lanka.svg  Sri Lanka 0.4992726444129343322
26Flag of South Africa.svg  South Africa 0.50026404545425052.
57Flag of Bosnia and Herzegovina.svg  Bosnia and Herzegovina 0.42957614644523955.
53Flag of Kyrgyzstan.svg  Kyrgyz Republic 0.44353544747505548.
31Flag of Ghana.svg  Ghana 0.4903142484251524132
71Flag of Lebanon.svg  Lebanon 0.37671634946596069.
30Flag of India.svg  India 0.4963039505061565026
51Flag of El Salvador.svg  El Salvador 0.4455138515349423524
50Flag of Honduras.svg  Honduras 0.4455041525653596236
45Bandera de Bolivia (Estado).svg  Bolivia 0.4564546535246455440
55Flag of Guatemala.svg  Guatemala 0.4395544545557586134
44Flag of Rwanda.svg  Rwanda 0.4674453555156534018
64Flag of Nicaragua.svg  Nicaragua 0.40764585658605153.
40Flag of Botswana.svg  Botswana 0.48040295757484027.
46Flag of Kenya.svg  Kenya 0.4554647586065685842
45Flag of Venezuela.svg  Bolivarian Republic of Venezuela 0.45645465961554156.
41Flag of Nepal.svg    Nepal 0.4754155605962615850
54Flag of Senegal.svg  Senegal 0.4405451616363665939
56Flag of Egypt.svg  Egypt 0.4305657625458646041
61Flag of Algeria.svg  Algeria 0.4156156636254625753
52Flag of Cambodia.svg  Cambodia 0.4435260646566636343
63Flag of Laos.svg  Lao People's Democratic Republic 0.4086373656464576551
67Flag of Zambia.svg  Zambia 0.3996759666868677047
59Flag of Tanzania.svg  Tanzania 0.4175967676667717144
65Flag of Bangladesh.svg  Bangladesh 0.4066566686969657355
66Flag of Uganda.svg  Uganda 0.4036668696773737448
70Flag of Pakistan.svg  Pakistan 0.3847065707178798157
71Flag of Benin.svg  Benin 0.41758647174757466.
80Flag of Cameroon.svg  Cameroon 0.3368074727072697858
60Flag of Malawi.svg  Malawi 0.41660697377707067.
77Flag of East Timor.svg  Timor-Leste 0.3457782747371727245
69Flag of Mali.svg  Mali 0.3866975757279838256
68Flag of Burkina Faso.svg  Burkina Faso 0.3956871767976777754
73Flag of Sierra Leone.svg  Sierra Leone 0.36773807781828276.
83Flag of Liberia.svg  Liberia 0.29783837875818064.
75Flag of Nigeria.svg  Nigeria 0.3547572797683818059
76Flag of Madagascar.svg  Madagascar 0.34676818080868589.
72Flag of Mozambique.svg  Mozambique 0.3747276818280757952
74Flag of Ethiopia.svg  Ethiopia 0.36574788278787549.
82Flag of Zimbabwe.svg  Zimbabwe 0.30882778385747683.
79Flag of Guinea.svg  Guinea 0.34279798483878786.
86Flag of Mauritania.svg  Mauritania 0.27386858584848684.
84Flag of Sudan.svg  Sudan 0.28784878686888887.
87Flag of Angola.svg  Angola 0.31581868787858488.
88Flag of the Democratic Republic of the Congo.svg  Democratic Republic of the Congo 0.2808584888889898860

See also

Related Research Articles

Quality of life (QOL) is defined by the World Health Organization as "an individual's perception of their position in life in the context of the culture and value systems in which they live and in relation to their goals, expectations, standards and concerns".

<span class="mw-page-title-main">International development</span> Concept concerning the level of development on an international scale

International development or global development is a broad concept denoting the idea that societies and countries have differing levels of economic or human development on an international scale. It is the basis for international classifications such as developed country, developing country and least developed country, and for a field of practice and research that in various ways engages with international development processes. There are, however, many schools of thought and conventions regarding which are the exact features constituting the "development" of a country.

Governance is the process of making and enforcing decisions within an organization or society. It is the process of interactions through the laws, social norms, power or language as structured in communication of an organized society over a social system. It is done by the government of a state, by a market, or by a network. It is the process of choosing the right course among the actors involved in a collective problem that leads to the creation, reinforcement, or reproduction of acceptable conduct and social order". In lay terms, it could be described as the processes that exist in and between formal institutions.

<span class="mw-page-title-main">Gross National Happiness</span> Guiding philosophy of the government of Bhutan

Gross National Happiness, sometimes called Gross Domestic Happiness (GDH), is a philosophy that guides the government of Bhutan. It includes an index which is used to measure the collective happiness and well-being of a population. Gross National Happiness Index is instituted as the goal of the government of Bhutan in the Constitution of Bhutan, enacted on 18 July 2008.

New Public Management (NPM) is an approach to running public service organizations that is used in government and public service institutions and agencies, at both sub-national and national levels. The term was first introduced by academics in the UK and Australia to describe approaches that were developed during the 1980s as part of an effort to make the public service more "businesslike" and to improve its efficiency by using private sector management models.

<span class="mw-page-title-main">Air quality index</span> Measure of air pollution

An air quality index (AQI) is an indicator developed by government agencies to communicate to the public how polluted the air currently is or how polluted it is forecast to become. As air pollution levels rise, so does the AQI, along with the associated public health risk. Children, the elderly and individuals with respiratory or cardiovascular problems are typically the first groups affected by poor air quality. When the AQI is high, governmental bodies generally encourage people to reduce physical activity outdoors, or even avoid going out altogether. When wildfires result in a high AQI, the use of masks such as N95 respirators outdoors and air purifiers incorporating HEPA filters indoors are also encouraged.
<span class="mw-page-title-main">Capacity building</span> Process by which individuals or organizations improve their capability to produce, perform or deploy

Capacity building is the improvement in an individual's or organization's facility "to produce, perform or deploy". The terms capacity building and capacity development have often been used interchangeably, although a publication by OECD-DAC stated in 2006 that capacity development was the preferable term. Since the 1950s, international organizations, governments, non-governmental organizations (NGOs) and communities use the concept of capacity building as part of "social and economic development" in national and subnational plans. The United Nations Development Programme defines itself by "capacity development" in the sense of "'how UNDP works" to fulfill its mission. The UN system applies it in almost every sector, including several of the Sustainable Development Goals to be achieved by 2030. For example, the Sustainable Development Goal 17 advocates for enhanced international support for capacity building in developing countries to support national plans to implement the 2030 Agenda. 
<span class="mw-page-title-main">Worldwide Governance Indicators</span>

Based on a long-standing research program of the World Bank, the Worldwide Governance Indicators capture six key dimensions of governance between 1996 and present. They measure the quality of governance in over 200 countries, based on close to 40 data sources produced by over 30 organizations worldwide and are updated annually since 2002.

<span class="mw-page-title-main">Global Financial Centres Index</span> Ranking of the competitiveness of financial centres

The Global Financial Centres Index (GFCI) is a ranking of the competitiveness of financial centres based on over 29,000 financial centre assessments from an online questionnaire together with over 100 indices from organisations such as the World Bank, the Organisation for Economic Co-operation and Development (OECD), and the Economist Intelligence Unit. The first index was published in March 2007. It has been jointly published twice per year by Z/Yen Group in London and the China Development Institute in Shenzhen since 2015, and is widely quoted as a top source for ranking financial centres.

Daniel Kaufmann is the president emeritus of the Natural Resource Governance Institute (NRGI), which resulted from the merger of the Revenue Watch Institute – Natural Resource Charter. He is also a nonresident senior fellow at the Brookings Institution, where he was previously a senior fellow, and until July 2019 served in the international board of the Extractive Industries Transparency Initiative and in a number of advisory boards on governance, anti-corruption and natural resources and has also been in high-level expert commissions such as at the Organisation for Economic Co-operation and Development, the Inter-American Development Bank and the Mo Ibrahim Foundation. Prior to that, he was a director at the World Bank Institute, leading work on governance and anti-corruption. He was also a senior manager and lead economist at the World Bank, writing and working on many countries around the world, and was a visiting scholar at Harvard University. He has also served in other boards and councils in the past, including at the World Economic Forum.

Sustainability metrics and indices are measures of sustainability, and attempt to quantify beyond the generic concept. Though there are disagreements among those from different disciplines, these disciplines and international organizations have each offered measures or indicators of how to measure the concept.

The Sustainable Governance Indicators (SGI), first published in spring 2009 and updated in 2011, analyze and compare the need for reform in Organisation for Economic Co-operation and Development (OECD) member countries, as well as each country's ability to respond to current social and political challenges. The project is designed to create a comprehensive data pool on government-related activities in the countries considered the world's most developed free-market democracies. In addition, it uses international comparisons to provide evidence-based input for reform-related public discourse taking place in these countries. The SGI are updated every two or three years.

Canada ranks among the highest in international measurements of government transparency, civil liberties, quality of life, economic freedom, education levels, gender equality, public services, public security and environmental sustainability. It ranks among the lowest of the most developed countries for housing affordability, healthcare services and foreign direct investment.

The Worldwide Governance Indicators (WGI) is a project that reports both aggregate and individual governance indicators for over 200 countries and territories covering the period from 1996 to 2021. It considers six dimensions of governance:

The OECD Better Life Index, created in May 2011 by the Organisation for Economic Co-operation and Development, is an initiative pioneering the development of economic indicators which better capture multiple dimensions of economic and social progress.

Wikiprogress is a defunct online platform for sharing information on the measurement of social, economic and environmental progress. It is thought to facilitate sharing on ideas, initiatives and knowledge on "measuring the progress of societies". Like Wikipedia, it was open to all members and communities for contribution – anyone interested in "progress" could register.

Although for many decades, it was customary to focus on GDP and other measures of national income, there has been growing interest in developing broad measures of economic well-being. National and international approaches include the Beyond GDP programme developed by the European Union, the Better Lives Compendium of Indicators developed by the OECD, as well as many alternative metrics of wellbeing or happiness. One of the earliest attempts to develop such an index at national level was Bhutan's Gross National Happiness Index and there are a now a number of similar projects ongoing around the world, including a project to develop for the UK an assessment of national well-being, commissioned by the Prime Minister David Cameron and led by the Office for National Statistics.

Tobin Im is a scholar of public administration and a professor at the Graduate School of Public Administration at Seoul National University. He specializes in public management, organization theory, and comparative administration.

<span class="mw-page-title-main">Bertelsmann Transformation Index</span> Benchmark for democracy and market economy

The Bertelsmann Transformation Index (BTI) is a measure of the development status and governance of political and economic transformation processes in developing and transition countries around the world. The BTI has been published biennially by the Bertelsmann Stiftung since 2005, most recently in 2022 on 137 countries. The index measures and compares the quality of government action in a ranking list based on self-recorded data and analyzes successes and setbacks on the path to constitutional democracy and a market economy accompanied by sociopolitical support. For this purpose, the "Status Index" is calculated on the general level of development with regard to democratic and market-economy characteristics and the "Management Index" on the political management of decision-makers.
References

  1. ""Korean Parliament GC ranks 16th among 34 OECD countries"". The Joongang Ilbo. 2015-10-29. Retrieved 2017-04-10.
  2. ""Korea lags OECD average in disaster management"". The Korea Herald. 2015-01-05. Retrieved 2015-03-17.
  3. "한국 정부경쟁력 OECD국가 중 16위, 317개 지표 점수화 순위 산정" [Korea Government Competitiveness ranks 16th in OECD, measured by 317 indicators] (in Korean). The Seoul Shinmun. 2013-09-30. Retrieved 2015-03-17.
  4. "임도빈 한국행정학회 회장 당선" [Tobin Im is elected president of Korean Association for Public Administration] (in Korean). Yunhap News Agency. 2013-12-15. Archived from the original on 2017-04-11. Retrieved 2015-03-17.
  5. "World Competitiveness Scoreboard". 2014. Retrieved March 17, 2015.
  6. "International Institute for Management Development". 2014. Retrieved March 17, 2015.
  7. "Global Competitiveness Report 2014 and 2015". 2014. Retrieved March 17, 2015.
  8. "World Economic Forum".
  9. For the general assessment on the two indices, see Ochel, W & Rohn, O. (2006). Ranking of countries – the WEF, IMD, Fraser and Heritage Indices. CESifo DICE Report Vol. 4 no. 2. pp. 48-60.
  10. "World Bank's Worldwide Governance Indicator".
  11. "Quality of Government indicators".
  12. (2007) "The Worldwide Governance Indicators Project: Answering the Critics. World Bank Policy Research Working Paper 4149". For the critics on the WGI and its responses, see Kaufmann, D, Kraay, A, & Mastruzzi, M.
  13. "Government Competitiveness Center".
  14. Im, T. (2014). Government Competitiveness 2013. Seoul: CM Press (in Korean); Im, T., Kim, S., Ko, G., & Jo, W. (2014). Government Competitiveness: Theory and Evaluation Index. Seoul: Bakyoungsa (In Korean).
  15. Ho, A., & Im, T. (2012). Defining a new concept of government competitiveness. The Korean Journal of Public Administration, 50 (3), p. 13 (In Korean).
  16. "Ho, A. & Im, T. (2013). Challenges in Building Effective and Competitive Government in Developing Countries: An Institutional Logics Perspective, The American Review of Public Administration, first published online".
  17. "Government Competitiveness Center".
  18. Easton, D. (1953). The Political System: An Inquiry into the State of Political Science. New York: Wiley.
  19. "Center for Government Competitiveness. (2018) Government Competitiveness Report 2018, Graduate School of Public Administration. Seoul National University" (PDF).