
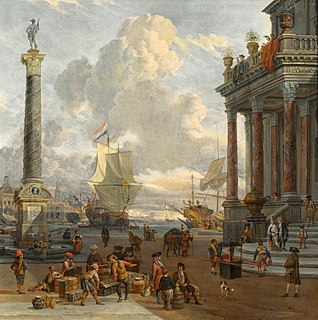
The balance of trade, commercial balance, or net exports, is the difference between the monetary value of a nation's exports and imports over a certain time period. Sometimes a distinction is made between a balance of trade for goods versus one for services. The balance of trade measures a flow of exports and imports over a given period of time. The notion of the balance of trade does not mean that exports and imports are "in balance" with each other.

The economy of Costa Rica has been very stable for some years now, with continuing growth in the GDP and moderate inflation, though with a high unemployment rate: 11.49% in 2019. Costa Rica's economy emerged from recession in 1997 and has shown strong aggregate growth since then. The estimated GDP for 2017 is US$61.5 billion, up significantly from the US$52.6 billion in 2015 while the estimated 2017 per capita is US$12,382.

The economy of Hong Kong is a highly developed free-market economy. It is characterised by low taxation, almost free port trade and a well-established international financial market. Its currency, called the Hong Kong dollar, is legally issued by three major international commercial banks, and is pegged to the US dollar. Interest rates are determined by the individual banks in Hong Kong to ensure that they are market driven. There is no officially recognised central banking system, although the Hong Kong Monetary Authority functions as a financial regulatory authority.

The economy of Moldova is an upper-middle income economy with a high Human Development Index. Moldova is a landlocked Eastern European country, bordered by Ukraine on the east and Romania to the west. It is a former Soviet republic.

The economy of Panama is based mainly on the services sector, which accounts for nearly 80% of its GDP and accounts for most of its foreign income. Services include the Panama Canal, banking, commerce, the Colón Free Trade Zone, insurance, container ports, and flagship registry, medical and health and tourism. The country's industry includes manufacturing of aircraft spare parts, cement, drinks, adhesives and textiles. Additionally, exports from Panama include bananas, shrimp, sugar, coffee, and clothing. Panama's economy is fully dollarized, with the US dollar being legal tender in the country. Panama was the first foreign country to adopt the U.S. dollar as its legal currency (1903) after its secession from Colombia temporarily deprived it of a local currency. Panama is an upper-middle income economy with a history of low inflation.
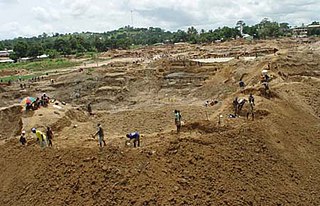
The economy of Sierra Leone is that of a least developed country with a gross domestic product (GDP) of approximately US$1.9 billion in 2009. Since the end of the Sierra Leone Civil War in 2002 the economy is gradually recovering with a GDP growth rate between 4 and 7%. In 2008 its GDP in PPP ranked between 147th and 153rd (CIA) largest in the world.
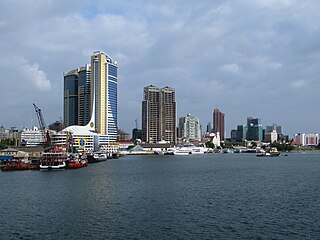
The economy of Tanzania is a lower-middle income economy that is overwhelmingly dependent on agriculture. Tanzania's economy has been transitioning from a command economy to a market economy since 1985. Although total GDP has increased since these reforms began, GDP per capita dropped sharply at first, and only exceeded the pre-transition figure in around 2007.
The world economy or the global economy is the economy of all humans of the world, referring to the global economic system which includes all economic activities which are conducted both within and between nations, including production, consumption, economic management, work in general, exchange of financial values and trade of goods and services. In some contexts, the two terms are distinct "international" or "global economy" being measured separately and distinguished from national economies while the "world economy" is simply an aggregate of the separate countries' measurements. Beyond the minimum standard concerning value in production, use and exchange, the definitions, representations, models and valuations of the world economy vary widely. It is inseparable from the geography and ecology of planet Earth.
A country's gross external debt is the liabilities that are owed to nonresidents by residents. The debtors can be governments, corporations or citizens. External debt may be denominated in domestic or foreign currency. It includes amounts owed to private commercial banks, foreign governments, or international financial institutions such as the International Monetary Fund (IMF) and the World Bank.

The economy of the European Union is the joint economy of the member states of the European Union (EU). It is the third largest economy in the world in nominal terms, after the United States and China, and the third one in purchasing power parity (PPP) terms, after China and the United States. The European Union's GDP was estimated to be around $15 trillion (nominal) in 2020, representing around 1/6 of the global economy.

The net international investment position (NIIP) is the difference between the external financial assets and liabilities of a country. External debt of a country includes government debt and private debt. External assets publicly and privately held by a country's legal residents are also taken into account when calculating NIIP. Commodities and currencies tend to follow a cyclical pattern of significant valuation changes, which is also reflected in NIIP.

The economy of the Middle East is very diverse, with national economies ranging from hydrocarbon-exporting rentiers to centralized socialist economies and free-market economies. The region is best known for oil production and export, which significantly impacts the entire region through the wealth it generates and through labor utilization. In recent years, many of the countries in the region have undertaken efforts to diversify their economies.
The following are the international rankings of Taiwan.

The economy of Ivory Coast is stable and currently growing, in the aftermath of political instability in recent decades. The Ivory Coast's economy is largely market-based and depends heavily on the agricultural sector. Almost 70% of the Ivorian people are engaged in some form of agricultural activity. GDP per capita grew 82% in the 1960s, reaching a peak growth of 360% in the 1970s, but this proved unsustainable and it shrank by 28% in the 1980s and a further 22% in the 1990s. This decline, coupled with high population growth, resulted in a steady fall in living standards. The Gross national product per capita, now rising again, was about US$727 in 1996. It was substantially higher two decades before.

The economy of Algeria expanded by 4% in 2014, up from 2.8% in 2013. Growth was driven mainly by the recovering oil and gas sector. Further economic expansion of 3.9% was forecast in 2015 and 4.1% in 2016.
The following are some international rankings of Singapore.
Foreign trade of the United States comprises the international imports and exports of the United States. The country is among the top three global importers and exporters.