List of creditor nations by net international investment position per capita

Last updated

This is a list of the top creditor nations of the world sorted by their net international investment positions (NIIPs) per capita. A creditor nation is a sovereign state that has a positive NIIP. [1]

The table uses the latest available data, mostly from websites approved by the International Monetary Fund, [2] and includes Macau and Hong Kong because of their special economic statuses. Population figures may list citizens only or total population, therefore ranking and figures may vary.

The 6 Gulf Cooperation Council countries are widely considered to be creditor nations (and perhaps some of the largest ones), but because of Islamic sensitivities about credit and debt, they seldom report their external assets and liabilities. [3] [4]

RankCountryExternal Assets
(in millions)
External Liabilities
(in millions)
NIIP
(in millions)
NIIP
(in USD)
Ref.PopulationRef.Per Capita
(in USD)
As of
1Flag of Macau.svg  Macau [5] 523% of GDP (est)244% of GDP (est)279.6% of GDP (est)129,175,000,000 [6] 601,000[ citation needed ]214,934Dec 2015
2Flag of Hong Kong.svg  Hong Kong [7] HKD 40,681,611HKD 30,440,448HKD 10,241,1631,309,268,000,000 [8] 7,409,800 [9] 176,694Oct. 2017
3Flag of Singapore.svg  Singapore [10] SGD 4,150,370.8SGD 3,306,317.3SGD 844,053.5596,858,559,145 [11] 3,902,700 [12] 152,935Dec. 2015
4Flag of Norway.svg  Norway [13] NOK 12,994,059NOK 6,785,470NOK 6,208,589701,964,590,784 [14] 5,213,985134,631Dec. 2015
5Flag of Switzerland.svg   Switzerland [15] CHF 4,260,301CHF 3,651,607CHF 608,694607,782,326,510 [16] 8,325,200 [17] 73,005Dec. 2015
6Flag of the Republic of China.svg  Taiwan [18] USD 1,634,712USD 580,807USD 1,053,9051,053,905,000,00023,492,074 [19] 44,862Dec. 2015
7Flag of Luxembourg.svg  Luxembourg [20] EUR 9,470,480.534EUR 9,454,005.815EUR 16,474.71917,887,096,660 [21] 576,200 [22] 31,043Dec. 2015
8Flag of the Netherlands.svg  Netherlands [23] EUR 7,583,186.1EUR 7,171,831.9EUR 411,354.2446,619,595,566 [21] 16,980,049 [24] 26,303Dec. 2015
9Flag of Belgium (civil).svg  Belgium [25] EUR 1,973,000EUR 1,719,000EUR 254,000275,775,420,000 [21] 11,268,000 [26] 24,474Dec. 2015
10Flag of Mauritius.svg  Mauritius [27] MUR 15,178,485MUR 14,106,085MUR 1,072,40029,934,403,350 [28] 1,262,862 [29] [30] 23,704Dec. 2015
11Flag of Saudi Arabia.svg  Saudi Arabia [31] SAR 3,548,790SAR 1,283,100SAR 2,265,690604,758,000,00024,000,00025,198Dec. 2016
12Flag of Japan.svg  Japan [32] [33] JPY 948,729,000JPY 609,466,000JPY 339,263,0002,812,543,005,181 [34] 127,043,000 [35] [36] 22,139Dec. 2015
13Flag of Denmark.svg  Denmark [37] DKK 5,924,000DKK 5,090,000DKK 834,000121,352,159,894 [38] 5,707,300 [39] 21,263Dec. 2015
14Flag of Germany.svg  Germany [40] EUR 7,903,800EUR 6,415,600EUR 1,488,2001,615,783,386,000 [21] 81,770,900 [41] 19,760Dec. 2015
15Flag of Malta.svg  Malta [42] [43] EUR 223,234.8EUR 218,747.7EUR 4,487.14,871,779,083 [21] 429,34411,347Dec. 2015
16Flag of Israel.svg  Israel [44] USD 418,535USD 283,411USD 135,124135,125,000,0008,464,200 [45] 8,097Sep. 2017
17Flag of South Korea.svg  South Korea [46] USD 1,494,722USD 1,173,651USD 321,071321,071,000,00052,617,000 [47] 6,104Jun. 2018
18Flag of Russia.svg  Russia [48] [49] USD 1,145,789USD 831,921USD 313,868313,868,000,000146,500,0002,142Dec. 2015
19Flag of the People's Republic of China.svg  China [50] USD 6,218,905.405USD 4,622,452.390USD 1,596,453.0151,596,453,015,0001,367,820,000 [51] 1,167Dec. 2015

Related Research Articles

Economy of Hong Kong Overview of the economy of Hong Kong

The economy of Hong Kong is a highly developed free-market economy. It is characterised by low taxation, almost free port trade and a well-established international financial market. Its currency, called the Hong Kong dollar, is legally issued by three major international commercial banks, and is pegged to the US dollar. Interest rates are determined by the individual banks in Hong Kong to ensure that they are market driven. There is no officially recognised central banking system, although the Hong Kong Monetary Authority functions as a financial regulatory authority.

Economy of Iran National Economy of Iran

The economy of Iran is a mixed economy with a large state-owned sector and is the largest in the Middle East in terms of nominal GDP. It is the world's 23rd largest by purchasing power parity (PPP). Some 60% of Iran's economy is centrally planned. It is dominated by oil and gas production, although over 40 industries are directly involved in the Tehran Stock Exchange. The stock exchange has been one of the best performing exchanges in the world over the past decade. With 10% of the world's proven oil reserves and 15% of its gas reserves, Iran is considered an "energy superpower".

The Venezuelan bolívar is the official currency of Venezuela. Named after the hero of Latin American independence Simón Bolívar, it was introduced following the monetary reform in 1879, before which the venezolano was circulating. Due to its decade-long reliance on silver and gold standards, and then on a peg to the United States dollar, it was considered among the most stable currencies and was internationally accepted until 1983, when the government decided to adopt a floating exchange rate instead.

Queen Elizabeth Islands Northernmost group of islands of the Canadian Arctic Archipelago

The Queen Elizabeth Islands are the northernmost cluster of islands in Canada's Arctic Archipelago, split between Nunavut and the Northwest Territories in Northern Canada. The Queen Elizabeth Islands contain approximately 14% of the global glacier and ice cap area.

Tutong District District of Brunei

Tutong District or simply Tutong is one of the four districts of Brunei. It has an area of 1,166 square kilometres (450 sq mi); the population was 48,313 in 2016. The administrative town is Pekan Tutong. It is home to Tasek Merimbun, the country's largest natural lake.

Net international investment position

The net international investment position (NIIP) is the difference in the external financial assets and liabilities of a country. External debt of a country includes government debt and private debt. External assets publicly and privately held by a country's legal residents are also taken into account when calculating NIIP. Commodities and currencies tend to follow a cyclical pattern of significant valuation changes, which is also reflected in NIIP.

In-Grid Musical artist

Ingrid Alberini, known by her stage name In-Grid, is an Italian dancer and singer-songwriter. Her 2003 club song "Tu es foutu",, charted in several European countries, Australia, Latin America and in the United States, where it reached number six on the Billboard Dance Music/Club Play Singles chart in 2004.

The National Film Award for Best Direction is an honour presented annually at India's National Film Awards ceremony by the Directorate of Film Festivals (DFF), an organisation set up by the Indian Ministry of Information and Broadcasting. Since 1967, the award is given by a national panel appointed annually by the DFF to a director for their work within Indian cinema. It is presented by the president of India at a ceremony held in New Delhi.

Construction industry of Iran

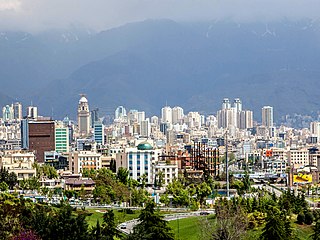
The construction industry of Iran is divided into two main sections. The first is government infrastructure projects, which are central for the cement industry. The second is the housing industry. In recent years, the construction industry has been thriving due to an increase in national and international investment to the extent that it is now the largest in the Middle East region. The Central Bank of Iran indicate that 70 percent of the Iranians own homes, with huge amounts of idle money entering the housing market. Iran has three shopping malls among the largest shopping malls in the world. Iran Mall is the largest shopping mall in the world, located in Tehran. The annual turnover in the construction industry amounts to US$38.4 billion. The real estate sector contributed to 5% of GDP in 2008. Statistics from March 2004 to March 2005 put the number of total Iranian households at 15.1 million and the total number of dwelling units at 13.5 million, signifying a demand for at least 5.1 million dwelling units. Every year there is a need for 750,000 additional units as young couples embark on married life. At present, 2000 units are being built every day although this needs to increase to 2740 units. Iran's construction market will expand to $154.4 billion in 2016 from $88.7 billion in 2013.

Sovereign wealth fund State-owned investment fund

A sovereign wealth fund (SWF), sovereign investment fund, or social wealth fund is a state-owned investment fund that invests in real and financial assets such as stocks, bonds, real estate, precious metals, or in alternative investments such as private equity fund or hedge funds. Sovereign wealth funds invest globally. Most SWFs are funded by revenues from commodity exports or from foreign-exchange reserves held by the central bank.

Marthille Commune in Grand Est, France

Marthille is a commune in the Moselle department in Grand Est in north-eastern France.

Financial technology Subset of technologies used in finance

Financial technology is the technology and innovation that aims to compete with traditional financial methods in the delivery of financial services. It is an emerging industry that uses technology to improve activities in finance. The use of smartphones for mobile banking, investing, borrowing services, and cryptocurrency are examples of technologies aiming to make financial services more accessible to the general public. Financial technology companies consist of both startups and established financial institutions and technology companies trying to replace or enhance the usage of financial services provided by existing financial companies. A subset of fintech companies that focus on the insurance industry are collectively known as insurtech or insuretech companies.

Cerebral palsy football, also called 7-a-side football or formerly Paralympic football, is an adaptation of association football for athletes with cerebral palsy and other neurological disorders, including stroke and traumatic brain injury. From 1978 to 2014, cerebral palsy football was governed by the Cerebral Palsy International Sports and Recreation Association (CPISRA). In January 2015, governance of the sport was taken over by the International Federation of Cerebral Palsy Football, under the umbrella of Para Football.

STKRJ Katok 'B' or Kampong Katok 'B', also known as STKRJ Mata-Mata, is a public housing estate in Brunei-Muara District, Brunei, about 11 kilometres (6.8 mi) from the country's capital Bandar Seri Begawan. The total population was 6,108 in 2016. It is one of the estates for the Landless Indigenous Citizens' Housing Scheme, a public housing programme for the country's indigenous citizens.

The legal industry refers to the aggregation and integration of sectors within the economic system that provide legal goods and services. The global legal industry is fast-growing: in 2015, it was valued at USD 786 billion, USD 886 billion by 2018 and is expected to exceed USD 1 trillion by 2021. The United States and Europe dominate the legal industry, with the former accounting for more than half of the global market revenue. Meanwhile, Europe accounts for more than a quarter of revenue. Legal services in the Asia-Pacific region continues to grow, with total revenues of $103.3 billion in 2018.

References

  1. Staff, Investopedia (14 May 2007). "Creditor Nation".
  2. "IMF--Dissemination Standards Bulletin Board-- Subscribing Countries-- International". dsbb.imf.org.
  3. "New questions for a new year on UAE's surging markets". 12 January 2014.
  4. "GCC States: Eyeing Opportunities in the Global Financial Crisis". Stratfor.
  5. Dept, International Monetary Fund. Asia and Pacific. "People's Republic of China-Macao Special Administrative Region : 2016 Article IV Consultation-Press Release; and Staff Report".
  6. "Annual Economic Report" (PDF). sinoptic.ch. 31 May 2016.
  7. "Table 045 : International Investment Position - Census and Statistics Department". www.censtatd.gov.hk.
  8. "XE: USD / HKD Currency Chart. US Dollar to Hong Kong Dollar Rates". www.xe.com.
  9. "Population Estimates - Overview - Census and Statistics Department". www.censtatd.gov.hk.
  10. "Statistics Singapore - IMF Special Data Dissemination Standard - Economic and Financial Data for Singapore". 1 May 2016. Archived from the original on 1 May 2016.{{cite web}}: CS1 maint: bot: original URL status unknown (link)
  11. "XE: USD / SGD Currency Chart. US Dollar to Singapore Dollar Rates". www.xe.com.
  12. "Statistics Singapore - Latest Data" for Singapore Residents, i.e. citizens and permanent residents In Singapore's case, the non-resident population is about 30% of the total population (which is highly significant, compared to the much lower proportion of non-residents living in the other countries in this list); so the non-resident population (the vast majority of whom are temporary foreign workers), which has no share in Singapore's net external assets, should be excluded.
  13. "Economic and Financial Data for Norway - SSB". 28 June 2016. Archived from the original on 28 June 2016.{{cite web}}: CS1 maint: bot: original URL status unknown (link)
  14. "XE: USD / NOK Currency Chart. US Dollar to Norwegian Krone Rates". www.xe.com.
  15. "International economic affairs". data.snb.ch.
  16. "XE: USD / CHF Currency Chart. US Dollar to Swiss Franc Rates". www.xe.com.
  17. "Swiss Statistics - Overview". 28 June 2016. Archived from the original on 28 June 2016.
  18. "International Investment Position (End-Period Stocks)" (PDF). cbc.gov.tw.
  19. "Archived copy". Archived from the original on 2014-03-29. Retrieved 2014-02-02.{{cite web}}: CS1 maint: archived copy as title (link)
  20. "Banque centrale du Luxembourg - International investment position of Luxembourg". www.bcl.lu.
  21. 1 2 3 4 5 "XE: EUR / USD Currency Chart. Euro to US Dollar Rates". www.xe.com.
  22. "Table view". www.statistiques.public.lu.
  23. "Balance of payments and international investment position - De Nederlandsche Bank" ("T12.12 Net external assets; Yearly/Quarterly") Archived 2015-12-20 at the Wayback Machine
  24. "CBS StatLine - Select..." statline.cbs.nl.
  25. NBB. "International Investment Position". stat.nbb.be.
  26. NBB. "NBB Statistics". stat.nbb.be.
  27. "international investment position".
  28. "XE: USD / MUR Currency Chart. US Dollar to Mauritian Rupee Rates". www.xe.com.
  29. "Statistics Mauritius - Population and Vital Statistics". statsmauritius.govmu.org.
  30. "Statistics Mauritius - Population and Vital Statistics Year 2015". statsmauritius.govmu.org.
  31. "Saudi Arabia International Investment Position". ceicdata.com.
  32. "International Investment Position : Ministry of Finance". 28 June 2016. Archived from the original on 28 June 2016.{{cite web}}: CS1 maint: bot: original URL status unknown (link)
  33. "International Investment Position of Japan (End of 2015) : Ministry of Finance". 28 June 2016. Archived from the original on 28 June 2016.{{cite web}}: CS1 maint: bot: original URL status unknown (link)
  34. "XE: USD / JPY Currency Chart. US Dollar to Japanese Yen Rates". www.xe.com.
  35. "Statistics Bureau Home Page/Result of the Population Estimates". www.stat.go.jp.
  36. "Population Estimates 2016Jun. - Search from file - Search for statistics - Portal Site of Official Statistics of Japan". www.e-stat.go.jp.
  37. "IMF". 28 June 2016. Archived from the original on 28 June 2016.{{cite web}}: CS1 maint: bot: original URL status unknown (link)
  38. "XE: USD / DKK Currency Chart. US Dollar to Danish Krone Rates". www.xe.com.
  39. "Population at the first day of the quarter - StatBank Denmark - data and statistics" Archived 2014-10-21 at archive.today
  40. (PDF). 28 June 2016 https://web.archive.org/web/20160628112813/http://www.bundesbank.de/Redaktion/EN/Downloads/Statistics/External_Sector/International_Investment_Position/sdds_auslandsvermoegen_quartal.en.pdf?__blob=publicationFile. Archived from the original on 28 June 2016.{{cite web}}: Missing or empty |title= (help)CS1 maint: bot: original URL status unknown (link)
  41. "State & society - Current population - Population based on the 2011 Census - Federal Statistical Office (Destatis)". 28 June 2016. Archived from the original on 28 June 2016.{{cite web}}: CS1 maint: bot: original URL status unknown (link)
  42. "Economic and Financial Data For Malta". nso.gov.mt. Archived from the original on 2016-04-05.
  43. "The International Investment Position of Malta". 19 April 2016. Archived from the original on 19 April 2016.{{cite web}}: CS1 maint: bot: original URL status unknown (link)
  44. ""Bank of Israel - Data & Statistics - Subject Page" ("External Sector > International investment position")".
  45. "The Central Bureau of Statistics (Israel)-Time Series-DataBank-Population". cbs.gov.il.
  46. "Bank of Korea - International Investment Position (IIP) at the end of 2015 (preliminary)" (PDF). Archived from the original (PDF) on 2017-03-05. Retrieved 2020-03-08.
  47. "Population Projections for Provinces (2013~2040)" (pdf). Statistics Korea. 1 December 2015.
  48. "Минфин России :: National Summary Data Page (NSDP) :: National Summary Data Page (NSDP)". 27 June 2016. Archived from the original on 27 June 2016.{{cite web}}: CS1 maint: bot: original URL status unknown (link)
  49. "Statistics - External Sector Statistics - Bank of Russia". www.cbr.ru.
  50. "The time-series data of International Investment Position of China". safe.gov.cn. Archived from the original on 2016-06-02. Retrieved 2015-08-12.
  51. "National Data". data.stats.gov.cn.