Elections to Monmouthshire County Council were held on 1 May 2008. The whole council was up for election and the Conservative party held overall control of the council.
Monmouthshire County Council is the governing body for the Monmouthshire principal area – one of the unitary authorities of Wales.
The Conservative Party, officially the Conservative and Unionist Party, is a centre-right political party in the United Kingdom. The governing party since 2010, it is the largest in the House of Commons, with 313 Members of Parliament, and also has 249 members of the House of Lords, 18 members of the European Parliament, 31 Members of the Scottish Parliament, 12 members of the Welsh Assembly, eight members of the London Assembly and 8,916 local councillors.
Party | Seats | Gains | Losses | Net gain/loss | Seats % | Votes % | Votes | +/− | |
---|---|---|---|---|---|---|---|---|---|
Conservative | 29 | 5 | 0 | +5 | 67.44 | 47.15 | 12,879 | +3.55% | |
Liberal Democrat | 5 | 2 | 0 | +2 | 11.63 | 22.20 | 6,061 | +4.03% | |
Labour | 7 | 2 | 4 | -2 | 16.28 | 17.51 | 4,782 | -2.43% | |
Independent | 1 | 0 | 4 | -4 | 2.36 | 7.73 | 2,110 | -6.59% | |
Plaid Cymru | 1 | 0 | 1 | -1 | 2.36 | 4.75 | 1,296 | +1.74% | |
Green | 0 | 0 | 0 | = | 0.00 | 0.64 | 175 | +0.46% | |
UKIP | 0 | 0 | 0 | = | - | - | - | -0.80% |
Party | Seats | Gains | Losses | Net gain/loss | Seats % | Votes % | Votes | +/− | |
---|---|---|---|---|---|---|---|---|---|
Conservative | 28 | 3 | 0 | +3 | 80.00 | 52.50 | 11,746 | +4.93% | |
Liberal Democrat | 4 | 1 | 0 | +1 | 14.29 | 23.14 | 5,177 | +1.47% | |
Labour | 3 | 0 | 1 | -1 | 8.57 | 13.93 | 3,116 | -2.79% | |
Independent | 1 | 0 | 3 | -3 | 2.86 | 7.77 | 1,738 | -5.32% | |
Plaid Cymru | 0 | 0 | 0 | = | 0.00 | 1.88 | 423 | +1.15% | |
Green | 0 | 0 | 0 | = | 0.00 | 0.78 | 175 | +0.56% |
Party | Seats | Gains | Losses | Net gain/loss | Seats % | Votes % | Votes | +/− | |
---|---|---|---|---|---|---|---|---|---|
Labour | 4 | 2 | 2 | = | 50.00 | 33.81 | 1,666 | -2.65% | |
Conservative | 2 | 1 | 0 | +1 | 25.00 | 22.99 | 1,133 | -0.80% | |
Liberal Democrat | 1 | 1 | 0 | +1 | 12.50 | 17.94 | 884 | +17.94% | |
Plaid Cymru | 1 | 0 | 1 | -1 | 12.50 | 17.72 | 873 | +2.90% | |
Independent | 0 | 0 | 1 | -1 | 0.00 | 7.54 | 372 | -13.14% | |
Green | 0 | 0 | 0 | = | 0.00 | - | - | - | |
UKIP | 0 | 0 | 0 | = | - | - | - | -4.97% |
Party | Candidate | Votes | % | ± | |
---|---|---|---|---|---|
Conservative | Paul Richard Jordan [1] | 453 | 52.98 | -4.22 | |
Labour | Margaret Harris | 243 | 28.42 | +12.47 | |
Plaid Cymru | John Walters | 86 | 10.06 | +10.06 | |
Liberal Democrat | Patricia (Pat) Morris | 73 | 8.54 | +8.54 | |
Majority | 210 | 24.56 | -5.78 | ||
Turnout | 855 | 51.01 | -6.86 | ||
Conservative hold | Swing | -8.38 | |||
Party | Candidate | Votes | % | ± | |
---|---|---|---|---|---|
Conservative | Maureen Powell [2] | 370 | 45.48 | -1.54 | |
Independent | Anthony (Tony) O'Donovan | 283 | 33.61 | +11.43 | |
Labour | Margaret E. Phillips | 129 | 15.32 | -1.48 | |
Liberal Democrat | Tony R. Potts | 60 | 7.13 | -3.46 | |
Majority | 87 | 10.33 | -12.67 | ||
Turnout | 842 | 53.35 | -0.51 | ||
Conservative hold | Swing | -6.47 | |||
Party | Candidate | Votes | % | ± | |
---|---|---|---|---|---|
Liberal Democrat | Douglas L. Edwards [3] | 431 | 70.89 | +26.87 | |
Conservative | Nigel C. Beaven | 122 | 20.07 | -4.79 | |
Plaid Cymru | Mary Harris | 55 | 9.05 | +9.05 | |
Majority | 309 | 50.82 | +31.66 | ||
Turnout | 612 | 48.15 | -8.80 | ||
Liberal Democrat hold | Swing | +15.83 | |||
Party | Candidate | Votes | % | ± | |
---|---|---|---|---|---|
Liberal Democrat | James George [4] | 359 | 53.03 | +48.43 | |
Labour | Robin A. Griffiths | 164 | 24.22 | -16.50 | |
Conservative | Martin J. Hickman | 112 | 16.54 | -3.33 | |
Independent | Norma C. Watkins | 30 | 4.43 | -24.30 | |
Plaid Cymru | Laurie Jones | 12 | 1.77 | -4.31 | |
Majority | 195 | 28.81 | +16.82 | ||
Turnout | 677 | 43.63 | +6.26 | ||
Liberal Democrat gain from Labour | Swing | +32.29 | |||
Party | Candidate | Votes | % | ± | |
---|---|---|---|---|---|
Conservative | Jane P. Foulser [5] | 423 | 67.04 | +20.75 | |
Liberal Democrat | Caroline Duchet | 208 | 32.96 | +24.07 | |
Majority | 215 | 34.08 | +16.16 | ||
Turnout | 631 | 42.54 | -3.4 | ||
Conservative hold | Swing | ||||
Party | Candidate | Votes | % | ± | |
---|---|---|---|---|---|
Conservative | Philip (Phil) Murphy [6] | 458 | 71.56 | +16.15 | |
Labour | Julie Roberts | 118 | 18.15 | -17.81 | |
Liberal Democrat | Thomas (Tom) Sullivan | 64 | 9.85 | +1.66 | |
Majority | 430 | 34.08 | +16.16 | ||
Turnout | 640 | 46.14 | -4.37 | ||
Conservative hold | Swing | +16.98 | |||
Party | Candidate | Votes | % | ± | |
---|---|---|---|---|---|
Liberal Democrat | Phylip (Phil) A. D. Hobson [7] | 417 | 51.74 | -1.82 | |
Conservative | Martin Brady | 305 | 37.84 | -8.60 | |
Labour | David Roman | 84 | 10.42 | +10.42 | |
Majority | 112 | 13.09 | +6.78 | ||
Turnout | 806 | 53.47 | +0.80 | ||
Liberal Democrat hold | Swing | +3.89 | |||
Party | Candidate | Votes | % | ± | |
---|---|---|---|---|---|
Conservative | Stephanie M. Dovey [8] | 205 | 35.10 | +6.46 | |
Liberal Democrat | Henry Ashby | 203 | 34.76 | +22.03 | |
Labour | Pamela (Pam) Birchall | 176 | 30.14 | -10.06 | |
Majority | 2 | 0.34 | n/a | ||
Turnout | 584 | 35.74 | +1.04 | ||
Conservative gain from Labour | Swing | +8.26 | |||
Party | Candidate | Votes | % | ± | |
---|---|---|---|---|---|
Conservative | David L. S. Dovey [9] | 474 | 55.50 | +8.30 | |
Liberal Democrat | Henry Hodges | 270 | 31.62 | -11.45 | |
Labour | Hilary M. Beach | 110 | 12.88 | +3.15 | |
Majority | 204 | 23.88 | +19.75 | ||
Turnout | 854 | 40.44 | -4.91 | ||
Conservative hold | Swing | +9.88 | |||
Party | Candidate | Votes | % | ± | |
---|---|---|---|---|---|
Liberal Democrat | Jacqueline (Jacqui) Sullivan [10] | 362 | 58.96 | +9.70 | |
Conservative | Benjamin (Ben) Smith | 166 | 27.04 | -4.69 | |
Labour | Thomas (Tom) P. Kirton | 86 | 14.01 | -5.00 | |
Majority | 196 | 31.92 | +14.39 | ||
Turnout | 614 | 45.09 | +4.65 | ||
Liberal Democrat hold | Swing | +7.20 | |||
Party | Candidate | Votes | % | ± | |
---|---|---|---|---|---|
Labour | Armand C. Watts [11] | 396 | 54.17 | +0.03 | |
Conservative | Marian J. Lewis | 234 | 32.01 | -1.66 | |
Liberal Democrat | Anthony (Tony) Redhead | 101 | 13.82 | +1.63 | |
Majority | 162 | 22.16 | +1.69 | ||
Turnout | 731 | 39.74 | +2.39 | ||
Labour hold | Swing | +0.85 | |||
Party | Candidate | Votes | % | ± | |
---|---|---|---|---|---|
Labour | Roger G. Harris [12] | 308 | 51.94 | +11.78 | |
Conservative | Laura L. Pike | 219 | 36.93 | +5.71 | |
Liberal Democrat | Charlotte Jones | 66 | 11.13 | +5.76 | |
Majority | 89 | 15.01 | +6.07 | ||
Turnout | 593 | 39.63 | +0.00 | ||
Labour hold | Swing | +3.04 | |||
Party | Candidate | Votes | % | ± | |
---|---|---|---|---|---|
Conservative | Andrew C. James | 469 | - | ||
Independent | Robert (Bob) J. B. Wilcox | 381 | - | ||
Liberal Democrat | Nicholas (Nick) Tatam | 65 | - | ||
Majority | - | ||||
Turnout | 917 | 57.89 | |||
Conservative gain from Independent | Swing | ||||
Party | Candidate | Votes | % | ± | |
---|---|---|---|---|---|
Conservative | Robert J. W. Greenland | uncontested | - | ||
Majority | - | - | - | ||
Turnout | - | - | - | ||
Conservative hold | Swing | - | |||
Party | Candidate | Votes | % | ± | |
---|---|---|---|---|---|
Conservative | Bryan Jones | 623 | - | ||
Plaid Cymru | Edward H. Evans | 235 | - | ||
Majority | - | ||||
Turnout | 871 | 47.00 | -12.94 | ||
Conservative hold | Swing | ||||
Party | Candidate | Votes | % | ± | |
---|---|---|---|---|---|
Conservative | Valerie (Val) E. Smith | uncontested | - | ||
Conservative hold | Swing | - | |||
Party | Candidate | Votes | % | ± | |
---|---|---|---|---|---|
Independent | Simon G. M. Howarth | 887 | - | ||
Conservative | Giles Howard | 624 | - | ||
Independent | Adrian Edwards | 545 | 6.55 | - | |
Independent | Anthony (Tony) R. Carrington | 458 | - | ||
Independent | Martin L. Thomas | 310 | - | ||
Turnout | 52.17 | +4.81 | |||
Independent hold | Swing | - | |||
Conservative gain from Independent | Swing | ||||
Party | Candidate | Votes | % | ± | |
---|---|---|---|---|---|
Conservative | Eric Saxon | 345 | 56.84 | -13.22 | |
Liberal Democrat | Jan Shivel | 261 | 43.16 | +30.31 | |
Majority | 84 | 13.68 | -39.29 | ||
Turnout | 607 | 48.72 | -6.96 | ||
Conservative hold | Swing | -21.77 | |||
Party | Candidate | Votes | % | ± | |
---|---|---|---|---|---|
Conservative | Peter R. Clarke | Uncontested | - | ||
Conservative hold | Swing | - | |||
Party | Candidate | Votes | % | ± | |
---|---|---|---|---|---|
Conservative | Brian R. Hood | 655 | 66.70 | -9.01 | |
Labour | Margaret E. Willcock | 205 | 20.88 | +7.85 | |
Liberal Democrat | Tim Willott | 118 | 12.02 | +0.76 | |
Majority | 450 | 45.82 | -16.86 | ||
Turnout | 982 | 54.40 | -1.92 | ||
Conservative hold | Swing | -8.43 | |||
Party | Candidate | Votes | % | ± | |
---|---|---|---|---|---|
Conservative | Ruth Edwards | 530 | 74.54 | +32.73 | |
Liberal Democrat | Patrick Tandy | 181 | 25.46 | +17.57 | |
Majority | 349 | 49.08 | +41.88 | ||
Turnout | 711 | 51.82 | -11.16 | ||
Conservative hold | Swing | +7.58 | |||
Party | Candidate | Votes | % | ± | |
---|---|---|---|---|---|
Labour | Christine Walby | 276 | 50.27 | +8.58 | |
Conservative | Owen W. M. Marsh | 273 | 49.73 | +23.55 | |
Majority | 3 | 9.56 | -9.02 | ||
Turnout | 562 | 51.28 56.32 | -5.04 | ||
Labour hold | Swing | -7.49 | |||
Party | Candidate | Votes | % | ± | |
---|---|---|---|---|---|
Conservative | John Major | 513 | 61.27 | -3.55 | |
Labour | Neeta S. Baicher | 206 | 24.58 | -10.60 | |
Liberal Democrat | Paul Rutter | 119 | 14.15 | +14.15 | |
Majority | 307 | 36.69 | +7.05 | ||
Turnout | 838 | 39.59 | -1.03 | ||
Conservative hold | Swing | +3.53 | |||
Party | Candidate | Votes | % | ± | |
---|---|---|---|---|---|
Conservative | James Harris | 334 | 42.82 | +20.37 | |
Independent | Olive Evans | 209 | 26.80 | +26.80 | |
Independent | Brian A. Burt | 159 | 20.39 | +20.39 | |
Liberal Democrat | Ben Robbins | 78 | 9.99 | +9.99 | |
Majority | 125 | 16.02 | +15.33 | ||
Turnout | 782 | 33.00 | -3.68 | ||
Conservative gain from Labour | Swing | +3.22 | |||
Party | Candidate | Votes | % | ± | |
---|---|---|---|---|---|
Conservative | John Prosser | 234 | 39.13 | +2.95 | |
Independent | Ralph F. Chapman | 175 | 29.26 | +1.64 | |
Labour | Adrian J. G. Nelmes | 120 | 20.07 | -2.79 | |
Plaid Cymru | Stuart K. Neale | 35 | 5.85 | -0.61 | |
Liberal Democrat | Emily Robbins | 34 | 5.69 | -2.41 | |
Majority | 59 | 9.87 | +1.31 | ||
Turnout | 598 | 44.59 | -2.23 | ||
Conservative hold | Swing | +0.66 | |||
Party | Candidate | Votes | % | ± | |
---|---|---|---|---|---|
Conservative | Geoffrey (Geoff) C. Burrows | 350 | 63.99 | +10.39 | |
Liberal Democrat | Alison Willott | 197 | 36.01 | -10.39 | |
Majority | 153 | 27.98 | +20.78 | ||
Turnout | 548 | 58.54 | +5.03 | ||
Conservative hold | Swing | +10.39 | |||
Party | Candidate | Votes | % | ± | |
---|---|---|---|---|---|
Conservative | Bob Hayward | 549 | 64.14 | +16.70 | |
Liberal Democrat | Anthea M. Dewhurst | 307 | 35.86 | -16.70 | |
Majority | 242 | 28.28 | +23.16 | ||
Turnout | 861 | 47.54 | -10.82 | ||
Conservative gain from Liberal Democrat | Swing | +16.70 | |||
Party | Candidate | Votes | % | ± | |
---|---|---|---|---|---|
Conservative | Alan M. Wintle | 488 | 49.24 | +2.58 | |
Liberal Democrat | Richard Bond | 330 | 33.30 | -6.43 | |
Labour | Maureen Roach | 173 | 17.46 | +17.46 | |
Majority | 158 | 15.94 | +9.01 | ||
Turnout | 1000 | 41.88 | -1.55 | ||
Conservative hold | Swing | +4.51 | |||
The English Democrats is an English nationalist political party in England.
Guildford Council in Surrey, England is elected every four years.
Hertfordshire County Council in England is elected every four years. Since the last boundary changes, that took effect for the 2001 election, 77 councillors are elected for single member districts.
Elections to Monmouthshire County Council were held on 10 June 2004 on the same day of the European Elections.
The Broxbourne Council election, 2010 was held to elect council members of the Broxbourne Borough Council, a local government authority in Hertfordshire, England.
Elections to Calderdale Metropolitan Borough Council were held on 1 May 2008. One third of the council was up for election and the council stayed under no overall control with a minority Conservative administration.
The 2007 council elections in Guildford saw the Conservatives retain control over Guildford Borough Council. Full results for each ward can be found at Guildford Council election, full results, 2007.
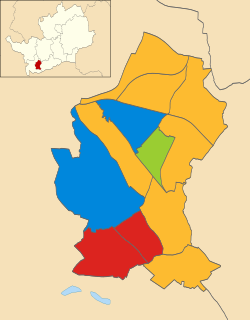
Elections to Watford Borough Council were held on 6 May 2010. Three years in every four, a third of the council retires and elections are held. The council election was held on the same day as the national General Election, when the Labour Party government lost power and the Watford parliamentary constituency was won by the Conservative Party.
Elections to Watford Borough Council in England were held on 5 May 2011. Three years in every four, a third of the council retires and elections are held.
The Norfolk County Council election took place across Norfolk on 2 May 2013, coinciding with local elections for all county councils in England. The results were announced the following day, Friday 3 May 2013. The result brought to an end 12 years of Conservative administration, who finished three seats short of a majority after losing 20 seats, leaving the Council in no overall control (NOC). UKIP and the Labour Party both made gains of 14 and 11 seats respectively. The Liberal Democrats and the Green Party both lost three seats each, whilst an independent won a single seat in North Norfolk.
The 2015 Ashfield District Council election took place on 7 May 2015, to elect members of Ashfield District Council in England. This was on the same day as other local elections.
The 2017 United Kingdom local elections were held on Thursday 4 May 2017. Local elections were held across Great Britain, with elections to 35 English local authorities and all councils in Scotland and Wales.
The 2017 Norfolk County Council election took place on 4 May 2017 as part of the 2017 local elections in the United Kingdom.
The inaugural Tees Valley mayoral election was held on 4 May 2017 to elect the mayor of the Tees Valley Combined Authority. The mayor was elected by the supplementary vote system. Subsequent elections will be held in May 2020 and every four years after.
Local elections were held in Wales on Thursday 4 May 2017 to elect members of all 22 local authorities, including the Isle of Anglesey, which was last up for election in 2013 due to having its elections delayed for a year. These local elections were held alongside local elections in Scotland and parts of England.
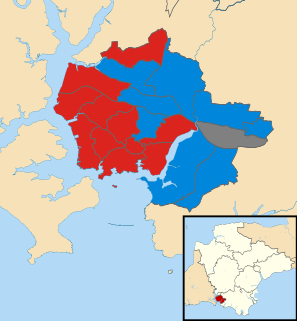
The 2018 Plymouth City Council election took place on 3 May 2018 to elect members of Plymouth City Council in England. The election was won by the Labour Party, who gained enough seats to achieve an overall majority and took control of the council.
The 2018 Wokingham Borough Council election took place on Thursday 3 May 2018. That was the same day as other United Kingdom local elections in order to elect members of Wokingham Unitary Council in Berkshire, England. One third of the council was up for election and the Conservative party stayed comfortably in overall control of the council.
Drybridge is an electoral ward in the town of Monmouth, Monmouthshire, Wales. The ward elects councillors to Monmouth Town Council and Monmouthshire County Council.