2016 U.S. presidential election | |
---|---|
Republican Party | |
Democratic Party | |
Third parties | |
Related races | |
| |
This page lists statewide public opinion polls that have been conducted relating to the 2016 United States presidential election in Florida, contested by Hillary Clinton (Democratic Party), Donald Trump (Republican Party), Gary Johnson (Libertarian Party) and Jill Stein (Green Party). The state was won by Donald Trump with 49.02% of the vote against 47.82% for Hillary Clinton.
Poll source | Date administered | Hillary Clinton | Donald Trump | Lead margin | Sample size | Margin of error |
---|---|---|---|---|---|---|
Quinnipiac University [1] | November 3–6, 2016 | 46% | 46% | Tied | 884 | ± 3.3% |
CNN/ORC [2] | October 27 – November 1, 2016 | 50% | 49% | 1 | 773 | ± 3.5% |
Quinnipiac University [3] | October 27 – November 1, 2016 | 47% | 45% | 2 | 626 | ± 3.9% |
Gravis Marketing/One America News Network [4] | October 31, 2016 | 51% | 49% | 2 | 1,995 | ± 2.2% |
New York Times Upshot/Siena College [5] | October 25–27, 2016 | 45% | 48% | 3 | 814 | ± 3.4% |
NBC News/Wall Street Journal/Marist [6] | October 25–26, 2016 | 46% | 46% | Tied | 779 | ± 3.5% |
University of North Florida [7] | October 20–25, 2016 | 46% | 44% | 2 | 836 | ± 3.4% |
Bloomberg/Selzer [8] | October 21–24, 2016 | 45% | 46% | 1 | 953 | ± 3.2% |
Quinnipiac University [9] | October 10–16, 2016 | 49% | 45% | 4 | 660 | ± 3.8% |
Public Policy Polling [10] | October 12–13, 2016 | 49% | 44% | 5 | 985 | ± 3.1% |
Ipsos/Reuters [11] | October 5–12, 2016 | 42% | 40% | 2 | 1,532 | ± 2.9% |
NBC News/Wall Street Journal/Marist [12] | October 3–5, 2016 | 46% | 44% | 2 | 700 | ± 3.7% |
University of North Florida [13] | September 27 – October 4, 2016 | 47% | 40% | 7 | 696 | ± 3.8% |
Quinnipiac University [14] | September 27 – October 2, 2016 | 49% | 44% | 5 | 545 | ± 4.2% |
Public Policy Polling [15] | September 27–28, 2016 | 48% | 45% | 3 | 826 | ± 3.4% |
Florida Chamber Political Institute [16] | September 15–20, 2016 | 45% | 42% | 3 | 617 | ± 4.0% |
New York Times Upshot/Siena College [17] | September 10–14, 2016 | 43% | 43% | Tied | 867 | ± 3.3% |
CNN/ORC [18] | September 7–12, 2016 | 46% | 50% | 4 | 788 | ± 3.5% |
Public Policy Polling [19] | September 4–6, 2016 | 47% | 46% | 1 | 744 | ± 3.6% |
Three-way race
Poll source | Date administered | Hillary Clinton | Donald Trump | Gary Johnson | Lead margin | Sample size | Margin of error |
---|---|---|---|---|---|---|---|
Remington Research Group/Axiom Strategies [20] | November 1–2, 2016 | 45% | 48% | 2% | 3 | 2,352 | ± 2.02% |
Remington Research/Axiom Strategies [21] | October 23–30, 2016 | 44% | 48% | 2% | 4 | 989 | ± 3.11% |
Remington Research Group/Axiom Strategies [22] | October 20–22, 2016 | 46% | 46% | 2% | Tied | 1,646 | ± 2.41% |
Florida Chamber Political Institute [16] | September 15–20, 2016 | 43% | 41% | 8% | 2 | 617 | ± 4.0% |
Four-way race
Poll source | Date administered | Hillary Clinton | Donald Trump | Gary Johnson | Jill Stein | Lead margin | Sample size | Margin of error |
---|---|---|---|---|---|---|---|---|
Trafalgar Group [23] | November 6, 2016 | 46% | 50% | 2% | 1% | 4 | 1,100 | ± 2.89% |
Quinnipiac University [1] | November 3–6, 2016 | 46% | 45% | 2% | 1% | 1 | 884 | ± 3.3% |
CBS News/YouGov [24] | November 2–4, 2016 | 45% | 45% | 4% | 2% | Tied | 1,188 | ± 3.6% |
Fox 13/Fox 35/Opinion Savvy [25] | November 1–2, 2016 | 49% | 45% | 3% | 1% | 4 | 603 | ± 4.0% |
CNN/ORC [2] | October 27 – November 1, 2016 | 49% | 47% | 3% | 1% | 2 | 773 | ± 3.5% |
Quinnipiac University [3] | October 27 – November 1, 2016 | 46% | 45% | 2% | 2% | 1 | 626 | ± 3.9% |
Gravis Marketing/One America News Network [4] | October 31, 2016 | 49% | 46% | 2% | 1% | 3 | 1,995 | ± 2.2% |
Trafalgar Group [26] | October 27–31, 2016 | 45% | 49% | 2% | 1% | 4 | 1,150 | ± 2.9% |
TargetSmart/William & Mary [27] | October 25–30, 2016 | 48% | 40% | 3% | 2% | 8 | 718 | N/A |
Emerson College [28] | October 26–27, 2016 | 46% | 45% | 4% | 0% | 1 | 500 | ± 4.3% |
New York Times Upshot/Siena College [5] | October 25–27, 2016 | 42% | 46% | 4% | 2% | 4 | 814 | ± 3.4% |
NBC News/Wall Street Journal/Marist [6] | October 25–26, 2016 | 45% | 44% | 5% | 2% | 1 | 779 | ± 3.5% |
Saint Leo University [29] | October 22–26, 2016 | 50% | 37% | 5% | 1% | 13 | 1,028 | ± 3.0% |
University of North Florida [7] | October 20–25, 2016 | 43% | 39% | 6% | 3% | 4 | 836 | ± 3.4% |
Bloomberg/Selzer [8] | October 21–24, 2016 | 43% | 45% | 4% | 2% | 2 | 953 | ± 3.2% |
SurveyUSA/Bay News 9/News 13 [30] | October 20–24, 2016 | 48% | 45% | 2% | 1% | 3 | 1,251 | ± 2.8% |
Florida Atlantic University [31] | October 21–23, 2016 | 46% | 43% | 3% | 2% | 3 | 500 | ± 4.3% |
CBS News/YouGov [32] | October 20–21, 2016 | 46% | 43% | 3% | 2% | 3 | 1,042 | ± 3.6% |
Opinion Savvy/Fox 13/Fox 35 [33] | October 20, 2016 | 49% | 45% | 3% | 2% | 4 | 538 | ± 4.2% |
Florida Chamber Political Institute [34] | October 16–19, 2016 | 46% | 42% | 5% | 1% | 4 | 507 | ± 4.4% |
Quinnipiac University [9] | October 10–16, 2016 | 48% | 44% | 4% | 1% | 4 | 660 | ± 3.8% |
Public Policy Polling [10] | October 12–13, 2016 | 46% | 42% | 5% | 1% | 4 | 985 | ± 3.1% |
Ipsos/Reuters [11] | October 5–12, 2016 | 42% | 38% | 6% | 2% | 4 | 1,532 | ± 2.9% |
Opinion Savvy [35] | October 10–11, 2016 | 47% | 44% | 5% | 1% | 3 | 533 | ± 4.2% |
Florida Atlantic University [36] | October 5–9, 2016 | 49% | 43% | 1% | 0% | 6 | 400 | ± 4.9% |
NBC News/Wall Street Journal/Marist [12] | October 3–5, 2016 | 45% | 42% | 5% | 3% | 3 | 700 | ± 3.7% |
Emerson College [37] | October 2–4, 2016 | 44% | 45% | 4% | 3% | 1 | 600 | ± 3.90% |
University of North Florida [13] | September 27 – October 4, 2016 | 41% | 38% | 6% | 3% | 3 | 696 | ± 3.8% |
Quinnipiac University [14] | September 27 – October 2, 2016 | 46% | 41% | 5% | 2% | 5 | 545 | ± 4.2% |
Opinion Savvy/Fox 13/Fox 35 [38] | September 28–29, 2016 | 47% | 46% | 4% | 2% | 1 | 619 | ± 4.0% |
Mason-Dixon [39] | September 27–29, 2016 | 46% | 42% | 7% | 1% | 4 | 820 | ± 3.5% |
Public Policy Polling [15] | September 27–28, 2016 | 45% | 43% | 3% | 1% | 2 | 826 | ± 3.4% |
Suffolk University [40] | September 19–21, 2016 | 44% | 45% | 3% | 1% | 1 | 500 | ± 4.4% |
Monmouth University [41] | September 16–19, 2016 | 46% | 41% | 6% | 1% | 5 | 400 | ± 4.9% |
Saint Leo University [42] | September 10–16, 2016 | 49% | 44% | 6% | 2% | 5 | 502 | ± 4.5% |
New York Times Upshot/Siena College [17] | September 10–14, 2016 | 41% | 40% | 9% | 2% | 1 | 867 | ± 3.3% |
CNN/ORC [18] | September 7–12, 2016 | 44% | 47% | 6% | 1% | 3 | 788 | ± 3.5% |
CBS News/YouGov [43] | September 7–9, 2016 | 44% | 42% | 5% | 2% | 2 | 1,193 | ± 3.5% |
JMC Analytics [44] | September 7–8, 2016 | 42% | 46% | 3% | 1% | 4 | 781 | ± 3.5% |
Public Policy Polling [19] | September 4–6, 2016 | 43% | 44% | 5% | 1% | 1 | 744 | ± 3.6% |
Poll source | Date administered | Hillary Clinton | Donald Trump | Lead margin | Sample size | Margin of error |
---|---|---|---|---|---|---|
Quinnipiac University [45] | August 27 – September 7, 2016 | 47% | 47% | Tied | 761 | ± 3.6% |
Florida Chamber Political Institute [46] | August 17–22, 2016 | 43% | 44% | 1 | 608 | ± 4.0% |
NBC News/Wall Street Journal/Marist [47] | August 4–10, 2016 | 44% | 39% | 5 | 862 | ± 3.3% |
Public Policy Polling [48] | August 5–7, 2016 | 46% | 43% | 3 | 938 | ± 3.2% |
Quinnipiac University [49] | July 30 – August 7, 2016 | 46% | 45% | 1 | 1,056 | ± 3.0% |
Suffolk University [50] | August 1–3, 2016 | 48% | 42% | 6 | 500 | ± 4.4% |
NBC News/Wall Street Journal/Marist [51] | July 5–11, 2016 | 44% | 37% | 7 | 871 | ± 3.3% |
Quinnipiac University [52] | June 30 – July 11, 2016 | 39% | 42% | 3 | 1,015 | ± 3.1% |
Gravis Marketing/One America News Network [53] | June 27–28, 2016 | 45% | 49% | 4 | 1,619 | ± 2.4% |
OnMessage [54] | June 26–28, 2016 | 45% | 47% | 2 | 800 | ± 3.46% |
Greenberg Quinlan Rosner [55] | June 11–20, 2016 | 52% | 39% | 13 | 300 | ± 5.66% |
Quinnipiac University [56] | June 8–19, 2016 | 47% | 39% | 8 | 975 | ± 3.1% |
45% | 39% | 6 | ||||
Public Policy Polling [57] | June 2–5, 2016 | 44% | 45% | 1 | 737 | ± 3.6% |
46% | 43% | 3 | ||||
CBS News/YouGov [58] | May 16–19, 2016 | 43% | 42% | 1 | 995 | ± 4% |
44% | 44% | Tied | ||||
Gravis Marketing [59] | May 17–18, 2016 | 46% | 42% | 4 | 2,542 | ± 2% |
Quinnipiac University [60] | April 27 – May 8, 2016 | 43% | 42% | 1 | 1,051 | ± 3.0% |
44% | 42% | 2 | ||||
Associated Industries of Florida [61] | April 25–27, 2016 | 49% | 36% | 13 | 604 | ± 5% |
48% | 39% | 9 | ||||
NBC News/Wall Street Journal/Marist [62] | March 4–10, 2016 | 49% | 41% | 8 | 2,422 | ± 2.0% |
48% | 43% | 5 | ||||
47% | 46% | 1 | ||||
50% | 42% | 8 | ||||
48% | 41% | 7 | ||||
CNN/ORC [63] | March 2–6, 2016 | 50% | 43% | 7 | 854 | 3.5% |
44% | 48% | 4 | ||||
46% | 47% | 1 | ||||
SurveyUSA/Bay News 9/News 13 [64] | March 4–6, 2016 | 44% | 45% | 1 | 1961 | 2.3% |
46% | 44% | 2 | ||||
45% | 44% | 1 | ||||
Public Policy Polling [65] | February 24–25, 2016 | 44% | 46% | 2 | 1012 | 3.1% |
47% | 39% | 8 | ||||
45% | 43% | 2 | ||||
44% | 47% | 3 | ||||
46% | 39% | 7 | ||||
44% | 42% | 2 | ||||
Florida Southern College Center [66] | January 30 – February 6, 2016 | 44.56% | 37.56% | 7 | 608 | 4% |
42.67% | 45.17% | 2.5 | ||||
44.9% | 41.69% | 3.21 | ||||
41.68% | 44.97% | 3.29 | ||||
47.99% | 38.78% | 9.21 | ||||
44.27% | 43% | 1.27 | ||||
46.07% | 36.73% | 9.34 | ||||
45.21% | 40.77% | 4.44 | ||||
Florida Atlantic University [67] | January 15–18, 2016 | 42% | 45% | 3 | 1008 | 3.0% |
44% | 47% | 3 | ||||
42% | 47% | 5 | ||||
46% | 46% | Tied | ||||
42% | 47% | 5 | ||||
47% | 42% | 5 | ||||
43% | 43% | Tied | ||||
Three-way race
Poll source | Date administered | Hillary Clinton | Donald Trump | Gary Johnson | Lead margin | Sample size | Margin of error |
---|---|---|---|---|---|---|---|
Florida Chamber Political Institute [46] | August 17–22, 2016 | 41% | 44% | 9% | 3 | 608 | ± 4.0% |
Greenberg Quinlan Rosner [68] | July 6–10, 2016 | 45% | 40% | 6% | 5 | 1,000 | ± 4.1% |
Greenberg Quinlan Rosner [55] | June 11–20, 2016 | 49% | 38% | 9% | 11 | 300 | ± 5.66% |
Mason-Dixon [69] | May 31 – June 2, 2016 | 45% | 42% | 6% | 3 | 625 | ± 4% |
42% | 42% | 8% | Tied | ||||
50% | 40% | 6% | 10 |
Four-way race
Poll source | Date administered | Hillary Clinton | Donald Trump | Gary Johnson | Jill Stein | Lead margin | Sample size | Margin of error |
---|---|---|---|---|---|---|---|---|
Quinnipiac University [45] | August 29 – September 7, 2016 | 43% | 43% | 8% | 2% | Tied | 761 | ± 3.6% |
Mason-Dixon [70] | August 22–24, 2016 | 44% | 42% | 6% | 2% | 2 | 625 | ± 4.0% |
ICITIZEN [71] | August 18–24, 2016 | 42% | 37% | 8% | 2% | 5 | 600 | ± 4.0% |
Florida Atlantic University [72] | August 19–22, 2016 | 41% | 43% | 8% | 2% | 2 | 1,200 | ± 3.0% |
Saint Leo University Polling Institute [73] | August 14–18, 2016 | 52% | 38% | 8% | 2% | 14 | 1,380 | ± 3.0% |
Monmouth University [74] | August 12–15, 2016 | 48% | 39% | 6% | 1% | 9 | 402 | ± 4.9% |
CBS News/YouGov [75] | August 10–12, 2016 | 45% | 40% | 5% | 2% | 5 | 1,194 | ± 3.6% |
Fox 13 Tampa Bay/Opinion Savvy [76] | August 10, 2016 | 45% | 44% | 6% | 1% | 1 | 622 | ± 4.0% |
NBC News/Wall Street Journal/Marist [47] | August 4–10, 2016 | 41% | 36% | 9% | 4% | 5 | 862 | ± 3.3% |
Quinnipiac University [49] | July 30 – August 7, 2016 | 43% | 43% | 7% | 3% | Tied | 1,056 | ± 3.0% |
Suffolk University [50] | August 1–3, 2016 | 43% | 39% | 4% | 3% | 4 | 500 | ± 4.4% |
NBC News/Wall Street Journal/Marist [51] | July 5–11, 2016 | 41% | 36% | 7% | 4% | 5 | 871 | ± 3.3% |
Quinnipiac University [52] | June 30 – July 11, 2016 | 36% | 41% | 7% | 4% | 5 | 1,015 | ± 3.1% |
JMC Analytics [77] | July 9–10, 2016 | 42% | 47% | 2% | 1% | 5 | 700 | ± 3.7% |
SurveyUSA/Bay News 9/News 13 [78] | June 25–27, 2016 | 46% | 42% | 2% | 1% | 4 | 1,873 | ± 2.4% |
CBS News/YouGov [79] | June 21–24, 2016 | 44% | 41% | 3% | 1% | 3 | 1,192 | ± 3.6% |
Quinnipiac University [56] | June 8–19, 2016 | 42% | 36% | 7% | 3% | 6 | 975 | ± 3.1% |
Public Policy Polling [80] | June 2–5, 2016 | 40% | 41% | 4% | 2% | 1 | 737 | ± 3.6% |
40% | 40% | 5% | 1% | Tied |
Poll source | Date administered | Democrat | % | Republican | % | Lead margin | Sample size | Margin of error |
---|---|---|---|---|---|---|---|---|
Quinnipiac University [81] | September 25 – October 5, 2015 | Joe Biden | 46% | Jeb Bush | 42% | 4 | 1173 | 2.9% |
Joe Biden | 45% | Ben Carson | 42% | 3 | ||||
Joe Biden | 49% | Carly Fiorna | 38% | 11 | ||||
Joe Biden | 46% | Marco Rubio | 43% | 3 | ||||
Joe Biden | 52% | Donald Trump | 38% | 14 | ||||
Hillary Clinton | 43% | Jeb Bush | 44% | 1 | ||||
Hillary Clinton | 45% | Ben Carson | 43% | 2 | ||||
Hillary Clinton | 44% | Carly Fiorna | 42% | 2 | ||||
Hillary Clinton | 44% | Marco Rubio | 45% | 1 | ||||
Hillary Clinton | 46% | Donald Trump | 41% | 5 | ||||
Bernie Sanders | 41% | Jeb Bush | 45% | 4 | ||||
Bernie Sanders | 40% | Ben Carson | 46% | 6 | ||||
Bernie Sanders | 41% | Carly Fiorna | 42% | 1 | ||||
Bernie Sanders | 41% | Marco Rubio | 46% | 5 | ||||
Bernie Sanders | 46% | Donald Trump | 41% | 5 | ||||
Public Policy Polling [82] | September 11–13, 2015 | Hillary Clinton | 42% | Jeb Bush | 45% | 3 | 814 | 3.4% |
Hillary Clinton | 40% | Ben Carson | 49% | 9 | ||||
Hillary Clinton | 45% | Ted Cruz | 43% | 2 | ||||
Hillary Clinton | 41% | Carly Fiorina | 46% | 5 | ||||
Hillary Clinton | 45% | Mike Huckabee | 43% | 2 | ||||
Hillary Clinton | 41% | John Kasich | 44% | 3 | ||||
Hillary Clinton | 43% | Marco Rubio | 48% | 5 | ||||
Hillary Clinton | 42% | Donald Trump | 48% | 6 | ||||
Hillary Clinton | 43% | Scott Walker | 45% | 2 | ||||
Bernie Sanders | 41% | Jeb Bush | 45% | 4 | ||||
Bernie Sanders | 33% | Ben Carson | 48% | 15 | ||||
Bernie Sanders | 37% | Carly Fiorina | 44% | 7 | ||||
Bernie Sanders | 41% | Donald Trump | 47% | 6 | ||||
Bernie Sanders | 40% | Scott Walker | 42% | 2 | ||||
Joe Biden | 42% | Jeb Bush | 45% | 3 | ||||
Joe Biden | 43% | Donald Trump | 47% | 4 | ||||
Quinnipiac University [83] | August 7–18, 2015 | Hillary Clinton | 41% | Donald Trump | 43% | 2 | 1,093 | ± 3% |
Hillary Clinton | 38% | Jeb Bush | 49% | 11 | ||||
Hillary Clinton | 39% | Marco Rubio | 51% | 12 | ||||
Joe Biden | 45% | Donald Trump | 42% | 3 | ||||
Joe Biden | 38% | Jeb Bush | 51% | 13 | ||||
Joe Biden | 42% | Marco Rubio | 48% | 6 | ||||
Bernie Sanders | 41% | Donald Trump | 45% | 4 | ||||
Bernie Sanders | 35% | Jeb Bush | 54% | 19 | ||||
Bernie Sanders | 36% | Marco Rubio | 52% | 16 | ||||
Quinnipiac University [84] | June 4–15, 2015 | Hillary Clinton | 46% | Jeb Bush | 42% | 4 | 1,147 | ± 3% |
Hillary Clinton | 46% | Chris Christie | 35% | 11 | ||||
Hillary Clinton | 48% | Ted Cruz | 37% | 11 | ||||
Hillary Clinton | 49% | Mike Huckabee | 38% | 11 | ||||
Hillary Clinton | 48% | John Kasich | 35% | 13 | ||||
Hillary Clinton | 46% | Rand Paul | 39% | 7 | ||||
Hillary Clinton | 47% | Marco Rubio | 44% | 3 | ||||
Hillary Clinton | 48% | Scott Walker | 38% | 10 | ||||
Mason-Dixon [85] | April 14–16, 2015 | Hillary Clinton | 43% | Jeb Bush | 47% | 4 | 625 | ± 4% |
Hillary Clinton | 43% | Marco Rubio | 49% | 6 | ||||
Quinnipiac University [86] | March 17–28, 2015 | Hillary Clinton | 42% | Jeb Bush | 45% | 3 | 1,087 | ± 3% |
Hillary Clinton | 44% | Chris Christie | 39% | 5 | ||||
Hillary Clinton | 48% | Ted Cruz | 39% | 9 | ||||
Hillary Clinton | 48% | Mike Huckabee | 40% | 8 | ||||
Hillary Clinton | 46% | Rand Paul | 43% | 3 | ||||
Hillary Clinton | 46% | Marco Rubio | 44% | 2 | ||||
Hillary Clinton | 46% | Scott Walker | 40% | 6 | ||||
Public Policy Polling [87] | March 19–22, 2015 | Hillary Clinton | 47% | Jeb Bush | 44% | 3 | 923 | ± 3.2% |
Hillary Clinton | 49% | Ben Carson | 41% | 8 | ||||
Hillary Clinton | 48% | Chris Christie | 41% | 7 | ||||
Hillary Clinton | 49% | Ted Cruz | 42% | 7 | ||||
Hillary Clinton | 49% | Mike Huckabee | 44% | 5 | ||||
Hillary Clinton | 46% | Rand Paul | 42% | 4 | ||||
Hillary Clinton | 50% | Rick Perry | 42% | 8 | ||||
Hillary Clinton | 48% | Marco Rubio | 46% | 2 | ||||
Hillary Clinton | 49% | Scott Walker | 41% | 8 | ||||
Joe Biden | 43% | Scott Walker | 43% | Tied | ||||
Elizabeth Warren | 42% | Scott Walker | 41% | 1 | ||||
Quinnipiac University [88] | January 22 – February 1, 2015 | Hillary Clinton | 44% | Jeb Bush | 43% | 1 | 936 | ± 3.2% |
Hillary Clinton | 51% | Chris Christie | 33% | 18 | ||||
Hillary Clinton | 51% | Mike Huckabee | 34% | 17 | ||||
Hillary Clinton | 50% | Rand Paul | 38% | 12 | ||||
Hillary Clinton | 49% | Marco Rubio | 39% | 10 | ||||
Gravis Marketing [89] | October 22–24, 2014 | Hillary Clinton | 45% | Jeb Bush | 46% | 1 | 861 | ± 3% |
Hillary Clinton | 46% | Marco Rubio | 39% | 7 | ||||
Gravis Marketing [90] | October 11–12, 2014 | Hillary Clinton | 37% | Jeb Bush | 36% | 1 | 1,023 | ± 3% |
Hillary Clinton | 43% | Marco Rubio | 35% | 8 | ||||
Public Policy Polling [91] | September 4–7, 2014 | Hillary Clinton | 46% | Jeb Bush | 44% | 2 | 818 | ± 3.4% |
Hillary Clinton | 46% | Chris Christie | 38% | 8 | ||||
Hillary Clinton | 51% | Ted Cruz | 36% | 15 | ||||
Hillary Clinton | 49% | Mike Huckabee | 40% | 9 | ||||
Hillary Clinton | 48% | Rand Paul | 40% | 8 | ||||
Hillary Clinton | 49% | Marco Rubio | 42% | 7 | ||||
Gravis Marketing [92] | August 14–24, 2014 | Hillary Clinton | 39% | Jeb Bush | 37% | 2 | 859 | ± 4% |
Hillary Clinton | 44% | Marco Rubio | 35% | 9 | ||||
SurveyUSA [93] | August 15–18, 2014 | Hillary Clinton | 48% | Mitt Romney | 41% | 7 | 852 | ± 3.4% |
Joe Biden | 39% | Mitt Romney | 47% | 8 | ||||
SurveyUSA [94] | July 31 – August 1, 2014 | Hillary Clinton | 50% | Rick Perry | 40% | 10 | 859 | ± 3.4% |
Joe Biden | 43% | Rick Perry | 44% | 1 | ||||
Quinnipiac University [95] | July 17–21, 2014 | Hillary Clinton | 49% | Jeb Bush | 42% | 7 | 1,251 | ± 2.8% |
Hillary Clinton | 54% | Chris Christie | 33% | 21 | ||||
Hillary Clinton | 53% | Rand Paul | 37% | 16 | ||||
Hillary Clinton | 53% | Marco Rubio | 39% | 14 | ||||
Hillary Clinton | 51% | Paul Ryan | 38% | 13 | ||||
SurveyUSA [96] | July 17–21, 2014 | Hillary Clinton | 47% | Jeb Bush | 41% | 6 | 836 | ± 3.5% |
Hillary Clinton | 49% | Chris Christie | 38% | 11 | ||||
Hillary Clinton | 46% | Rand Paul | 42% | 4 | ||||
Hillary Clinton | 53% | Marco Rubio | 39% | 14 | ||||
Joe Biden | 38% | Jeb Bush | 47% | 9 | ||||
Joe Biden | 39% | Chris Christie | 48% | 9 | ||||
Joe Biden | 39% | Rand Paul | 47% | 8 | ||||
Joe Biden | 43% | Marco Rubio | 46% | 3 | ||||
SurveyUSA [97] | June 30 – July 2, 2014 | Hillary Clinton | 46% | Rand Paul | 42% | 4 | 849 | ± 3.4% |
Joe Biden | 39% | Rand Paul | 47% | 8 | ||||
SurveyUSA [98] | June 20–23, 2014 | Hillary Clinton | 53% | Marco Rubio | 39% | 14 | 834 | ± 3.5% |
Joe Biden | 43% | Marco Rubio | 46% | 3 | ||||
SurveyUSA [99] | June 5–10, 2014 | Hillary Clinton | 47% | Jeb Bush | 41% | 6 | 850 | ± 3.4% |
Joe Biden | 38% | Jeb Bush | 47% | 9 | ||||
Public Policy Polling [100] | June 6–9, 2014 | Hillary Clinton | 46% | Jeb Bush | 45% | 1 | 672 | ± 3.8% |
Hillary Clinton | 46% | Chris Christie | 38% | 8 | ||||
Hillary Clinton | 50% | Ted Cruz | 39% | 11 | ||||
Hillary Clinton | 48% | Mike Huckabee | 41% | 7 | ||||
Hillary Clinton | 48% | Rand Paul | 42% | 6 | ||||
Hillary Clinton | 48% | Marco Rubio | 44% | 4 | ||||
Saint Leo University [101] | May 28 – June 4, 2014 | Hillary Clinton | 44% | Jeb Bush | 46% | 2 | 500 | ± 5% |
Hillary Clinton | 47% | Chris Christie | 40% | 7 | ||||
Hillary Clinton | 52% | Ted Cruz | 36% | 16 | ||||
Hillary Clinton | 50% | Paul Ryan | 40% | 10 | ||||
Hillary Clinton | 50% | Rand Paul | 38% | 12 | ||||
Hillary Clinton | 49% | Marco Rubio | 41% | 8 | ||||
Quinnipiac University [102] | April 23–28, 2014 | Hillary Clinton | 49% | Jeb Bush | 41% | 8 | 1,413 | ± 2.6% |
Hillary Clinton | 52% | Chris Christie | 34% | 18 | ||||
Hillary Clinton | 57% | Ted Cruz | 31% | 26 | ||||
Hillary Clinton | 53% | Mike Huckabee | 35% | 18 | ||||
Hillary Clinton | 55% | Rand Paul | 37% | 18 | ||||
Hillary Clinton | 52% | Marco Rubio | 40% | 12 | ||||
Hillary Clinton | 56% | Paul Ryan | 36% | 20 | ||||
Quinnipiac University [103] | January 22–27, 2014 | Hillary Clinton | 49% | Jeb Bush | 43% | 6 | 1,565 | ± 2.5% |
Hillary Clinton | 51% | Chris Christie | 35% | 16 | ||||
Hillary Clinton | 54% | Ted Cruz | 34% | 20 | ||||
Hillary Clinton | 53% | Rand Paul | 38% | 15 | ||||
Hillary Clinton | 51% | Marco Rubio | 41% | 10 | ||||
Hillary Clinton | 52% | Paul Ryan | 39% | 13 | ||||
Quinnipiac University [104] | November 12–17, 2013 | Hillary Clinton | 47% | Jeb Bush | 45% | 2 | 1,646 | ± 2.4% |
Hillary Clinton | 45% | Chris Christie | 41% | 4 | ||||
Hillary Clinton | 52% | Ted Cruz | 36% | 16 | ||||
Hillary Clinton | 51% | Rand Paul | 41% | 10 | ||||
Hillary Clinton | 50% | Marco Rubio | 43% | 7 | ||||
Hillary Clinton | 50% | Paul Ryan | 42% | 8 | ||||
Gravis Marketing [105] | November 8–10, 2013 | Hillary Clinton | 49% | Marco Rubio | 45% | 4 | 932 | ± 3% |
Quinnipiac University [106] | June 11–16, 2013 | Hillary Clinton | 50% | Jeb Bush | 43% | 7 | 1,176 | ± 2.9% |
Hillary Clinton | 53% | Marco Rubio | 41% | 12 | ||||
Joe Biden | 43% | Jeb Bush | 47% | 4 | ||||
Joe Biden | 43% | Marco Rubio | 45% | 2 | ||||
Public Policy Polling [107] | March 15–18, 2013 | Hillary Clinton | 53% | Jeb Bush | 40% | 13 | 500 | ± 4.4% |
Hillary Clinton | 56% | Marco Rubio | 40% | 16 | ||||
Hillary Clinton | 54% | Paul Ryan | 41% | 13 | ||||
Quinnipiac University [108] | March 13–18, 2013 | Hillary Clinton | 51% | Jeb Bush | 40% | 11 | 1,000 | ± 3.1% |
Hillary Clinton | 52% | Marco Rubio | 41% | 11 | ||||
Public Policy Polling [109] | January 11–13, 2013 | Hillary Clinton | 49% | Jeb Bush | 44% | 5 | 501 | ± 4.4% |
Hillary Clinton | 50% | Marco Rubio | 46% | 4 |
Three-way race
Poll source | Date administered | Democrat | % | Republican | % | Independent/ Third-party candidate | % | Lead margin | Sample size | Margin of error |
---|---|---|---|---|---|---|---|---|---|---|
Public Policy Polling [82] | September 11–13, 2015 | Hillary Clinton | 39% | Jeb Bush | 29% | Donald Trump | 27% | 10 | 814 | 3.4% |
Quinnipiac University [83] | August 7–18, 2015 | Hillary Clinton | 37% | Jeb Bush | 36% | Donald Trump | 19% | 1 | 1093 | 3% |
General election polling
Democratic primary polling
Republican primary polling
This is a list of nationwide public opinion polls that were conducted relating to the Republican primaries for the 2016 United States presidential election. The persons named in the polls were either declared candidates, former candidates, or received media speculation about their possible candidacy. On May 4, 2016, Donald Trump became the sole contender and presumptive nominee.
This is a list of nationwide public opinion polls that have been conducted relating to the Democratic primaries for the 2016 United States presidential election. The persons named in the polls are declared candidates, are former candidates, or have received media speculation about their possible candidacy.
This article contains opinion polling by U.S. state for the 2016 Republican Party presidential primaries. The shading for each poll indicates the candidate(s) which are within one margin of error of the poll's leader.
This article contains opinion polling by U.S. state for the 2016 Democratic Party presidential primaries. For currency and accuracy, please note the specific dates for each polling as listed below. For the significance of the earliest state votes, the Iowa caucuses and the New Hampshire primary, see United States presidential primary – Iowa and New Hampshire. To know when any given state votes, see the timeline of primaries and caucuses.
Statewide polls for the 2016 United States presidential election include the following. The polls listed here provide early data on opinion polling between the Democratic candidate, the Republican candidate, the Libertarian candidate, and the Green candidate. Prior to the parties' conventions, presumptive candidates were included in the polls. State polling is not conducted in all states for the election due to various factors. More polls usually are conducted in states that are considered swing states as more attention is given to the results. For determining a statistical tie, the margin of error provided by the polling source is applied to the result for each candidate.
This page lists nationwide public opinion polls that have been conducted relating to the 2016 United States presidential election. The two major party candidates were chosen at the Democratic National Convention and Republican National Convention in July 2016.
Statewide polls for the 2016 United States presidential election are as follows. The polls listed here, by state, are from 2013 to December 31, 2015, and provide early data on opinion polling between a possible Republican candidate against a possible Democratic candidate.
The 2016 Florida Democratic presidential primary took place on March 15 in the U.S. state of Florida as one of the Democratic Party's primaries ahead of the 2016 presidential election.
The 2016 New York Republican presidential primary was held on April 19 in the U.S. state of New York as one of the Republican Party's primaries ahead of the 2016 presidential election.
This page lists nationwide public opinion polling among demographics that have been conducted relating to the 2016 United States presidential election between prospective Democratic and Republican candidates. The two major party candidates were chosen at the Democratic National Convention and Republican National Convention in July 2016. The general election occurred on Tuesday, November 8, 2016.
The 2016 Ohio Republican presidential primary took place March 15 in the U.S. state of Ohio, as a part of the Republican Party's series of presidential primaries ahead of the 2016 presidential election. The Ohio primary was held alongside Republican primary elections in Florida, Illinois, Missouri and North Carolina, along with the Democratic contest in Ohio.
Statewide polls for the 2016 United States presidential election are as follows. The polls listed here, by state, are from January 1 to August 31, 2016, and provide early data on opinion polling between a possible Republican candidate against a possible Democratic candidate.
This is a list of opinion polls taken on the Presidency of Donald Trump in 2018.
The 2020 United States presidential election in Florida was held on Tuesday, November 3, 2020, as part of the 2020 United States presidential election, in which all 50 states and the District of Columbia participated. Florida voters chose electors to represent them in the Electoral College via a popular vote, pitting the Republican Party's nominee, incumbent president Donald Trump, and his running mate, Vice President Mike Pence, against Democratic Party nominee, former vice president Joe Biden, and his running mate, United States senator Kamala Harris, of California. Florida had 29 electoral votes in the Electoral College.
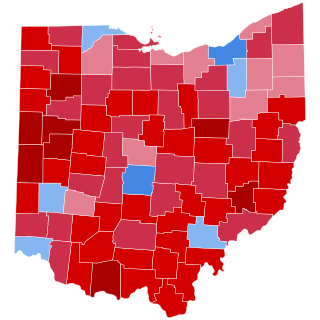
The 2020 United States presidential election in Ohio was held on Tuesday, November 3, 2020, as part of the 2020 United States presidential election in which all 50 states plus the District of Columbia participated. Ohio voters chose electors to represent them in the Electoral College via a popular vote, pitting the Republican Party's nominee—incumbent President Donald Trump and his running mate, Vice President Mike Pence—against the Democratic Party nominee, former Vice President Joe Biden and his running mate, California Senator Kamala Harris. Ohio had 18 electoral votes in the Electoral College.
The 2020 United States presidential election in Maine was held on Tuesday, November 3, 2020, as part of the 2020 United States presidential election in which all 50 states plus the District of Columbia participated. Maine voters chose electors to represent them in the Electoral College via a popular vote, pitting the Republican Party's nominee, incumbent President Donald Trump, and running mate Vice President Mike Pence against Democratic Party nominee, former Vice President Joe Biden, and his running mate California Senator Kamala Harris. Maine has four electoral votes in the Electoral College. Unlike all other states except Nebraska, Maine awards two electoral votes based on the statewide vote, and one vote for each congressional district.
This article contains opinion polling in New Hampshire for the 2016 Republican Party presidential primaries. The shading for each poll indicates the candidate(s) which are within one margin of error of the poll's leader.
The 2024 United States presidential election in Florida is scheduled to take place on Tuesday, November 5, 2024, as part of the 2024 United States elections in which all 50 states plus the District of Columbia will participate. Florida voters will choose electors to represent them in the Electoral College via a popular vote. The state of Florida has 30 electoral votes in the Electoral College, following reapportionment due to the 2020 United States census in which the state gained a seat.
The 2024 United States presidential election in Michigan is scheduled to take place on Tuesday, November 5, 2024, as part of the 2024 United States elections in which all 50 states plus the District of Columbia will participate. Michigan voters will choose electors to represent them in the Electoral College via a popular vote. The state of Michigan has 15 electoral votes in the Electoral College, following reapportionment due to the 2020 United States census in which the state lost a seat. Michigan is considered to be a crucial swing state in 2024.
The 2024 United States presidential election in Pennsylvania is scheduled to take place on Tuesday, November 5, 2024, as part of the 2024 United States elections in which all 50 states plus the District of Columbia will participate. Pennsylvania voters will choose electors to represent them in the Electoral College via a popular vote. The state of Pennsylvania has 19 electoral votes in the Electoral College, following reapportionment due to the 2020 United States census in which the state lost a seat.