Probability bounds analysis (PBA) is a collection of methods of uncertainty propagation for making qualitative and quantitative calculations in the face of uncertainties of various kinds. It is used to project partial information about random variables and other quantities through mathematical expressions. For instance, it computes sure bounds on the distribution of a sum, product, or more complex function, given only sure bounds on the distributions of the inputs. Such bounds are called probability boxes, and constrain cumulative probability distributions (rather than densities or mass functions).
This bounding approach permits analysts to make calculations without requiring overly precise assumptions about parameter values, dependence among variables, or even distribution shape. Probability bounds analysis is essentially a combination of the methods of standard interval analysis and classical probability theory. Probability bounds analysis gives the same answer as interval analysis does when only range information is available. It also gives the same answers as Monte Carlo simulation does when information is abundant enough to precisely specify input distributions and their dependencies. Thus, it is a generalization of both interval analysis and probability theory.
The diverse methods comprising probability bounds analysis provide algorithms to evaluate mathematical expressions when there is uncertainty about the input values, their dependencies, or even the form of mathematical expression itself. The calculations yield results that are guaranteed to enclose all possible distributions of the output variable if the input p-boxes were also sure to enclose their respective distributions. In some cases, a calculated p-box will also be best-possible in the sense that the bounds could be no tighter without excluding some of the possible distributions.
P-boxes are usually merely bounds on possible distributions. The bounds often also enclose distributions that are not themselves possible. For instance, the set of probability distributions that could result from adding random values without the independence assumption from two (precise) distributions is generally a proper subset of all the distributions enclosed by the p-box computed for the sum. That is, there are distributions within the output p-box that could not arise under any dependence between the two input distributions. The output p-box will, however, always contain all distributions that are possible, so long as the input p-boxes were sure to enclose their respective underlying distributions. This property often suffices for use in risk analysis and other fields requiring calculations under uncertainty.
History of bounding probability
The idea of bounding probability has a very long tradition throughout the history of probability theory. Indeed, in 1854 George Boole used the notion of interval bounds on probability in his The Laws of Thought.[1][2] Also dating from the latter half of the 19th century, the inequality attributed to Chebyshev described bounds on a distribution when only the mean and variance of the variable are known, and the related inequality attributed to Markov found bounds on a positive variable when only the mean is known. Kyburg[3] reviewed the history of interval probabilities and traced the development of the critical ideas through the 20th century, including the important notion of incomparable probabilities favored by Keynes.
Of particular note is Fréchet's derivation in the 1930s of bounds on calculations involving total probabilities without dependence assumptions. Bounding probabilities has continued to the present day (e.g., Walley's theory of imprecise probability.[4])
The methods of probability bounds analysis that could be routinely used in risk assessments were developed in the 1980s. Hailperin[2] described a computational scheme for bounding logical calculations extending the ideas of Boole. Yager[5] described the elementary procedures by which bounds on convolutions can be computed under an assumption of independence. At about the same time, Makarov,[6] and independently, Rüschendorf[7] solved the problem, originally posed by Kolmogorov, of how to find the upper and lower bounds for the probability distribution of a sum of random variables whose marginal distributions, but not their joint distribution, are known. Frank et al.[8] generalized the result of Makarov and expressed it in terms of copulas. Since that time, formulas and algorithms for sums have been generalized and extended to differences, products, quotients and other binary and unary functions under various dependence assumptions.[9][10][11][12][13][14]
Arithmetic expressions
Arithmetic expressions involving operations such as additions, subtractions, multiplications, divisions, minima, maxima, powers, exponentials, logarithms, square roots, absolute values, etc., are commonly used in risk analyses and uncertainty modeling. Convolution is the operation of finding the probability distribution of a sum of independent random variables specified by probability distributions. We can extend the term to finding distributions of other mathematical functions (products, differences, quotients, and more complex functions) and other assumptions about the intervariable dependencies. There are convenient algorithms for computing these generalized convolutions under a variety of assumptions about the dependencies among the inputs.[5][9][10][14]
Mathematical details
Let denote the space of distribution functions on the real numbers i.e.,
A p-box is a quintuple
where and , and are real intervals, and . This quintuple denotes the set of distribution functions such that:
If a function satisfies all the conditions above it is said to be inside the p-box. In some cases, there may be no information about the moments or distribution family other than what is encoded in the two distribution functions that constitute the edges of the p-box. Then the quintuple representing the p-box can be denoted more compactly as [B1, B2]. This notation harkens to that of intervals on the real line, except that the endpoints are distributions rather than points.
The notation denotes the fact that is a random variable governed by the distribution function F, that is,
Let us generalize the tilde notation for use with p-boxes. We will write X ~ B to mean that X is a random variable whose distribution function is unknown except that it is inside B. Thus, X ~ F ∈ B can be contracted to X ~ B without mentioning the distribution function explicitly.
If X and Y are independent random variables with distributions F and G respectively, then X + Y = Z ~ H given by
This operation is called a convolution on F and G. The analogous operation on p-boxes is straightforward for sums. Suppose
If X and Y are stochastically independent, then the distribution of Z = X + Y is inside the p-box
Finding bounds on the distribution of sums Z = X + Ywithout making any assumption about the dependence between X and Y is actually easier than the problem assuming independence. Makarov[6][8][9] showed that
The convolution under the intermediate assumption that X and Y have positive dependence is likewise easy to compute, as is the convolution under the extreme assumptions of perfect positive or perfect negative dependency between X and Y.[14]
Generalized convolutions for other operations such as subtraction, multiplication, division, etc., can be derived using transformations. For instance, p-box subtraction A − B can be defined as A + (−B), where the negative of a p-box B = [B1, B2] is [B2(−x), B1(−x)].
Logical expressions
Logical or Boolean expressions involving conjunctions (AND operations), disjunctions (OR operations), exclusive disjunctions, equivalences, conditionals, etc. arise in the analysis of fault trees and event trees common in risk assessments. If the probabilities of events are characterized by intervals, as suggested by Boole[1] and Keynes[3] among others, these binary operations are straightforward to evaluate. For example, if the probability of an event A is in the interval P(A) = a = [0.2, 0.25], and the probability of the event B is in P(B) = b = [0.1, 0.3], then the probability of the conjunction is surely in the interval
P(A & B) = a × b
= [0.2, 0.25] × [0.1, 0.3]
= [0.2 × 0.1, 0.25 × 0.3]
= [0.02, 0.075]
so long as A and B can be assumed to be independent events. If they are not independent, we can still bound the conjunction using the classical Fréchet inequality. In this case, we can infer at least that the probability of the joint event A & B is surely within the interval
It is also possible to compute interval bounds on the conjunction or disjunction under other assumptions about the dependence between A and B. For instance, one might assume they are positively dependent, in which case the resulting interval is not as tight as the answer assuming independence but tighter than the answer given by the Fréchet inequality. Comparable calculations are used for other logical functions such as negation, exclusive disjunction, etc. When the Boolean expression to be evaluated becomes complex, it may be necessary to evaluate it using the methods of mathematical programming[2] to get best-possible bounds on the expression. A similar problem one presents in the case of probabilistic logic (see for example Gerla 1994). If the probabilities of the events are characterized by probability distributions or p-boxes rather than intervals, then analogous calculations can be done to obtain distributional or p-box results characterizing the probability of the top event.
Magnitude comparisons
The probability that an uncertain number represented by a p-box D is less than zero is the interval Pr(D < 0) = [F(0), F̅(0)], where F̅(0) is the left bound of the probability box D and F(0) is its right bound, both evaluated at zero. Two uncertain numbers represented by probability boxes may then be compared for numerical magnitude with the following encodings:
A < B = Pr(A − B < 0),
A > B = Pr(B − A < 0),
A ≤ B = Pr(A − B ≤ 0), and
A ≥ B = Pr(B − A ≤ 0).
Thus the probability that A is less than B is the same as the probability that their difference is less than zero, and this probability can be said to be the value of the expression A < B.
Like arithmetic and logical operations, these magnitude comparisons generally depend on the stochastic dependence between A and B, and the subtraction in the encoding should reflect that dependence. If their dependence is unknown, the difference can be computed without making any assumption using the Fréchet operation.
Sampling-based computation
Some analysts[15][16][17][18][19][20] use sampling-based approaches to computing probability bounds, including Monte Carlo simulation, Latin hypercube methods or importance sampling. These approaches cannot assure mathematical rigor in the result because such simulation methods are approximations, although their performance can generally be improved simply by increasing the number of replications in the simulation. Thus, unlike the analytical theorems or methods based on mathematical programming, sampling-based calculations usually cannot produce verified computations. However, sampling-based methods can be very useful in addressing a variety of problems which are computationally difficult to solve analytically or even to rigorously bound. One important example is the use of Cauchy-deviate sampling to avoid the curse of dimensionality in propagating interval uncertainty through high-dimensional problems.[21]
Relationship to other uncertainty propagation approaches
P-boxes and probability bounds analysis have been used in many applications spanning many disciplines in engineering and environmental science, including:
In information theory, the entropy of a random variable is the average level of "information", "surprise", or "uncertainty" inherent to the variable's possible outcomes. Given a discrete random variable , which takes values in the set and is distributed according to , the entropy is
In probability theory and statistics, a probability distribution is the mathematical function that gives the probabilities of occurrence of different possible outcomes for an experiment. It is a mathematical description of a random phenomenon in terms of its sample space and the probabilities of events.
A random variable is a mathematical formalization of a quantity or object which depends on random events. The term 'random variable' in its mathematical definition refers to neither randomness nor variability but instead is a mathematical function in which
In probability theory, a probability density function (PDF), density function, or density of an absolutely continuous random variable, is a function whose value at any given sample in the sample space can be interpreted as providing a relative likelihood that the value of the random variable would be equal to that sample. Probability density is the probability per unit length, in other words, while the absolute likelihood for a continuous random variable to take on any particular value is 0, the value of the PDF at two different samples can be used to infer, in any particular draw of the random variable, how much more likely it is that the random variable would be close to one sample compared to the other sample.
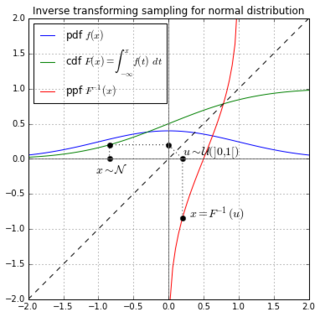
Inverse transform sampling is a basic method for pseudo-random number sampling, i.e., for generating sample numbers at random from any probability distribution given its cumulative distribution function.
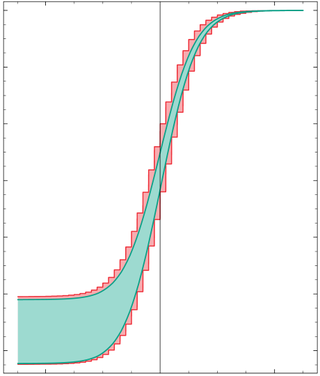
In probability theory, there exist several different notions of convergence of sequences of random variables, including convergence in probability, convergence in distribution, and almost sure convergence. The different notions of convergence capture different properties about the sequence, with some notions of convergence being stronger than others. For example, convergence in distribution tells us about the limit distribution of a sequence of random variables. This is a weaker notion than convergence in probability, which tells us about the value a random variable will take, rather than just the distribution.
In probability theory, Chebyshev's inequality provides an upper bound on the probability of deviation of a random variable from its mean. More specifically, the probability that a random variable deviates from its mean by more than is at most , where is any positive constant and is the standard deviation.
The posterior probability is a type of conditional probability that results from updating the prior probability with information summarized by the likelihood via an application of Bayes' rule. From an epistemological perspective, the posterior probability contains everything there is to know about an uncertain proposition, given prior knowledge and a mathematical model describing the observations available at a particular time. After the arrival of new information, the current posterior probability may serve as the prior in another round of Bayesian updating.
In statistics, propagation of uncertainty is the effect of variables' uncertainties on the uncertainty of a function based on them. When the variables are the values of experimental measurements they have uncertainties due to measurement limitations which propagate due to the combination of variables in the function.
In statistics and information theory, a maximum entropy probability distribution has entropy that is at least as great as that of all other members of a specified class of probability distributions. According to the principle of maximum entropy, if nothing is known about a distribution except that it belongs to a certain class, then the distribution with the largest entropy should be chosen as the least-informative default. The motivation is twofold: first, maximizing entropy minimizes the amount of prior information built into the distribution; second, many physical systems tend to move towards maximal entropy configurations over time.
Interval arithmetic is a mathematical technique used to mitigate rounding and measurement errors in mathematical computation by computing function bounds. Numerical methods involving interval arithmetic can guarantee relatively reliable and mathematically correct results. Instead of representing a value as a single number, interval arithmetic or interval mathematics represents each value as a range of possibilities.
In metrology, measurement uncertainty is the expression of the statistical dispersion of the values attributed to a measured quantity. All measurements are subject to uncertainty and a measurement result is complete only when it is accompanied by a statement of the associated uncertainty, such as the standard deviation. By international agreement, this uncertainty has a probabilistic basis and reflects incomplete knowledge of the quantity value. It is a non-negative parameter.
In probability theory, heavy-tailed distributions are probability distributions whose tails are not exponentially bounded: that is, they have heavier tails than the exponential distribution. In many applications it is the right tail of the distribution that is of interest, but a distribution may have a heavy left tail, or both tails may be heavy.
Inequalities are very important in the study of information theory. There are a number of different contexts in which these inequalities appear.
Free convolution is the free probability analog of the classical notion of convolution of probability measures. Due to the non-commutative nature of free probability theory, one has to talk separately about additive and multiplicative free convolution, which arise from addition and multiplication of free random variables. These operations have some interpretations in terms of empirical spectral measures of random matrices.
A probability box is a characterization of uncertain numbers consisting of both aleatoric and epistemic uncertainties that is often used in risk analysis or quantitative uncertainty modeling where numerical calculations must be performed. Probability bounds analysis is used to make arithmetic and logical calculations with p-boxes.
In mathematics, a credal set is a set of probability distributions or, more generally, a set of probability measures. A credal set is often assumed or constructed to be a closed convex set. It is intended to express uncertainty or doubt about the probability model that should be used, or to convey the beliefs of a Bayesian agent about the possible states of the world.
The convolution/sum of probability distributions arises in probability theory and statistics as the operation in terms of probability distributions that corresponds to the addition of independent random variables and, by extension, to forming linear combinations of random variables. The operation here is a special case of convolution in the context of probability distributions.
P-boxes and probability bounds analysis have been used in many applications spanning many disciplines in engineering and environmental science, including:
In probability theory and statistics, the Dirichlet process (DP) is one of the most popular Bayesian nonparametric models. It was introduced by Thomas Ferguson as a prior over probability distributions.
1 2 Yager, R.R. (1986). Arithmetic and other operations on Dempster–Shafer structures. International Journal of Man-machine Studies25: 357–366.
1 2 Makarov, G.D. (1981). Estimates for the distribution function of a sum of two random variables when the marginal distributions are fixed. Theory of Probability and Its Applications26: 803–806.
↑ Rüschendorf, L. (1982). Random variables with maximum sums. Advances in Applied Probability14: 623–632.
1 2 Frank, M.J., R.B. Nelsen and B. Schweizer (1987). Best-possible bounds for the distribution of a sum—a problem of Kolmogorov. Probability Theory and Related Fields74: 199–211.
1 2 3 Williamson, R.C., and T. Downs (1990). Probabilistic arithmetic I: Numerical methods for calculating convolutions and dependency bounds. International Journal of Approximate Reasoning4: 89–158.
↑ Berleant, D. (1993). Automatically verified reasoning with both intervals and probability density functions. Interval Computations1993 (2) : 48–70.
↑ Berleant, D., G. Anderson, and C. Goodman-Strauss (2008). Arithmetic on bounded families of distributions: a DEnv algorithm tutorial. Pages 183–210 in Knowledge Processing with Interval and Soft Computing, edited by C. Hu, R.B. Kearfott, A. de Korvin and V. Kreinovich, Springer ( ISBN978-1-84800-325-5).
1 2 Berleant, D., and C. Goodman-Strauss (1998). Bounding the results of arithmetic operations on random variables of unknown dependency using intervals. Reliable Computing4: 147–165.
↑ Alvarez, D. A., 2006. On the calculation of the bounds of probability of events using infinite random sets. International Journal of Approximate Reasoning43: 241–267.
↑ Baraldi, P., Popescu, I. C., Zio, E., 2008. Predicting the time to failure of a randomly degrading component by a hybrid Monte Carlo and possibilistic method. IEEE Proc. International Conference on Prognostics and Health Management.
↑ Batarseh, O. G., Wang, Y., 2008. Reliable simulation with input uncertainties using an interval-based approach. IEEE Proc. Winter Simulation Conference.
↑ Roy, Christopher J., and Michael S. Balch (2012). A holistic approach to uncertainty quantification with application to supersonic nozzle thrust. International Journal for Uncertainty Quantification2 (4): 363–81 doi:10.1615/Int.J.UncertaintyQuantification.2012003562.
↑ Zhang, H., Mullen, R. L., Muhanna, R. L. (2010). Interval Monte Carlo methods for structural reliability. Structural Safety32: 183–190.
↑ Zhang, H., Dai, H., Beer, M., Wang, W. (2012). Structural reliability analysis on the basis of small samples: an interval quasi-Monte Carlo method. Mechanical Systems and Signal Processing37 (1–2): 137–51 doi:10.1016/j.ymssp.2012.03.001.
↑ Flander, L., W. Dixon, M. McBride, and M. Burgman. (2012). Facilitated expert judgment of environmental risks: acquiring and analysing imprecise data. International Journal of Risk Assessment and Management16: 199–212.
↑ Enszer, J.A., Y. Lin, S. Ferson, G.F. Corliss and M.A. Stadtherr (2011). Probability bounds analysis for nonlinear dynamic process models. AIChE Journal57: 404–422.
↑ Enszer, Joshua Alan, (2010). Verified Probability Bound Analysis for Dynamic Nonlinear Systems. Dissertation, University of Notre Dame.
↑ Nong, A., and K. Krishnan (2007). Estimation of interindividual pharmacokinetic variability factor for inhaled volatile organic chemicals using a probability-bounds approach. Regulatory Toxicology and Pharmacology48: 93–101.
↑ Fetz, Thomas; Tonon, Fulvio (2008). "Probability bounds for series systems with variables constrained by sets of probability measures". International Journal of Reliability and Safety. 2 (4): 309. doi:10.1504/IJRS.2008.022079.
1 2 Augustsson, A., M. Filipsson, T. Öberg, B. Bergbäck (2011). Climate change—an uncertainty factor in risk analysis of contaminated land. Science of the Total Environment409: 4693–4700.
↑ Karanki, D.R., H.S. Kushwaha, A.K. Verma, and S. Ajit. (2009). Uncertainty analysis based on probability bounds (p-box) approach in probabilistic safety assessment. Risk Analysis29: 662–75.
↑ Sander, P., B. Bergbäck and T. Öberg (2006). Uncertain numbers and uncertainty in the selection of input distributions—Consequences for a probabilistic risk assessment of contaminated land. Risk Analysis26: 1363–1375.
↑ Minnery, J.G., J.G. Jacangelo, L.I. Boden, D.J. Vorhees and W. Heiger-Bernays (2009). Sensitivity analysis of the pressure-based direct integrity test for membranes used in drinking water treatment. Environmental Science and Technology43(24): 9419–9424.
↑ Regan, H.M., B.E. Sample and S. Ferson (2002). Comparison of deterministic and probabilistic calculation of ecological soil screening levels. Environmental Toxicology and Chemistry 21: 882–890.
↑ Moore, Dwayne R.J.; Breton, Roger L.; Delong, Tod R.; Ferson, Scott; Lortie, John P.; MacDonald, Drew B.; McGrath, Richard; Pawlisz, Andrzej; Svirsky, Susan C.; Teed, R. Scott; Thompson, Ryan P.; Whitfield Aslund, Melissa (2016). "Ecological risk assessment for mink and short-tailed shrew exposed to PCBS, dioxins, and furans in the Housatonic River area". Integrated Environmental Assessment and Management. 12 (1): 174–184. doi:10.1002/ieam.1661. PMID25976918.
↑ Oberkampf, W.L., and C. J. Roy. (2010). Verification and Validation in Scientific Computing. Cambridge University Press.
↑ Regan, H.M., B.K. Hope, and S. Ferson (2002). Analysis and portrayal of uncertainty in a food web exposure model. Human and Ecological Risk Assessment8: 1757–1777.
↑ Ferson, S., and W.T. Tucker (2004). Reliability of risk analyses for contaminated groundwater. Groundwater Quality Modeling and Management under Uncertainty, edited by S. Mishra, American Society of Civil Engineers Reston, VA.
↑ Crespo, Luis G.; Kenny, Sean P.; Giesy, Daniel P. (2013). "Reliability analysis of polynomial systems subject to p-box uncertainties". Mechanical Systems and Signal Processing. 37 (1–2): 121–136. Bibcode:2013MSSP...37..121C. doi:10.1016/j.ymssp.2012.08.012.
↑ Ferson, S., D.R.J. Moore, P.J. Van den Brink, T.L. Estes, K. Gallagher, R. O'Connor and F. Verdonck. (2010). Bounding uncertainty analyses. Pages 89–122 in Application of Uncertainty Analysis to Ecological Risks of Pesticides, edited by W. J. Warren-Hicks and A. Hart. CRC Press, Boca Raton, Florida.
↑ Batarseh, O.G.Y., (2010). An Interval Based Approach to Model Input Uncertainty in Discrete-event Simulation. Ph.D. dissertation, University of Central Florida.
↑ Goldwasser, L., L. Ginzburg and S. Ferson (2000). Variability and measurement error in extinction risk analysis: the northern spotted owl on the Olympic Peninsula. Pages 169–187 in Quantitative Methods for Conservation Biology, edited by S. Ferson and M. Burgman, Springer-Verlag, New York.
↑ Hayes, K.R. (2011).Uncertainty and uncertainty analysis methods: Issues in quantitative and qualitative risk modeling with application to import risk assessment ACERA project (0705). Report Number: EP102467, CSIRO, Hobart, Australia.
↑ Patelli, E; de Angelis, M (2015). "Line sampling approach for extreme case analysis in presence of aleatory and epistemic uncertainties". Safety and Reliability of Complex Engineered Systems. pp.2585–2593. doi:10.1201/b19094-339. ISBN978-1-138-02879-1.
↑ Sentz, K., and S. Ferson (2011). Probabilistic bounding analysis in the quantification of margins and uncertainties. Reliability Engineering and System Safety96: 1126–1136.
↑ Rozell, Daniel J., and Sheldon J. Reaven (2012). Water pollution risk associated with natural gas extraction from the Marcellus Shale. Risk Analysis32: 1382–1393.
Ferson, Scott (2002). RAMAS Risk Calc 4.0 Software: Risk Assessment with Uncertain Numbers. Boca Raton, Florida: Lewis Publishers. ISBN978-1-56670-576-9.
Gerla, G. (1994). "Inferences in Probability Logic". Artificial Intelligence. 70 (1–2): 33–52. doi:10.1016/0004-3702(94)90102-3.
Oberkampf, William L.; Roy, Christopher J. (2010). Verification and Validation in Scientific Computing. New York: Cambridge University Press. ISBN978-0-521-11360-1.
This page is based on this Wikipedia article Text is available under the CC BY-SA 4.0 license; additional terms may apply. Images, videos and audio are available under their respective licenses.