Results of the 1922 New South Wales state election

Last updated

1922 New South Wales state election [1]
Legislative Assembly
<< 19201925 >>

Contents

Enrolled voters1,251,023
Votes cast875,464 Turnout 70.00+13.81
Informal votes31,771Informal3.63−6.07
Summary of votes by party
PartyPrimary votes %SwingSeatsChange
  Nationalist 364,21143.17+13.2541+13
  Labor 324,67738.48−4.6036−7
  Progressive 93,48811.08−4.049−6
  Independent 31,8803.78−1.0710
  Democratic 14,3541.70−0.691+1
  Independent Labor 7,4380.88+0.880 
  Ind. Coalitionist5,7270.68+0.681+1
  Industrial Labor 1,6740.20+0.200 
 Soldier's Nationalist2440.03+0.030 
Total843,693  90 

The 1922 New South Wales state election was for 90 seats representing 24 electoral districts, with each district returning between 3 and 5 members. [1] This was the second election in New South Wales that took place under a modified Hare-Clark voting system. The average number of enrolled voters per member was 13,785, ranging from Sturt (10,386) to Ryde (15,722). [2]

Results by electoral district

Balmain

1922 New South Wales state election: Balmain [3]
PartyCandidateVotes%±%
Quota 7,380
Labor Robert Stuart-Robertson (elected 5)5,95013.4+4.3
Labor John Quirk (elected 3)5,90313.3+3.1
Labor Tom Keegan (elected 4)5,67912.8+4.4
Labor John Doyle (defeated)4,3139.7+2.1
Labor David Ryan1,7804.0+4.0
Nationalist Robert Stopford (elected 2)6,26414.1+1.4
Nationalist Albert Lane (elected 1)5,25811.9+11.9
Nationalist Albert Smith (defeated)3,2947.4-2.4
Nationalist Thomas Greentree1,8844.3+4.3
Nationalist Alfred Henry 1,5633.5+3.5
Democratic John Sheehy2,1634.9+4.9
Industrial Labor Henry Collins640.1+0.1
Industrial Labor John Hood630.1+0.1
Independent Solomon Amein990.20.0
Total formal votes44,27795.9+9.5
Informal votes1,8764.1-9.5
Turnout 46,15369.0+14.7
Party total votes
Labor 23,62553.4-6.3
Nationalist 18,26341.2+18.8
Democratic 2,1634.9-2.4
Industrial Labor 1270.3+0.3
Independent Solomon Amein990.20.0

Bathurst

1922 New South Wales state election: Bathurst [4]
PartyCandidateVotes%±%
Quota 7,351
Labor James Dooley (elected 2)7,70826.2-5.0
Labor Valentine Johnston (defeated)5,74519.5-2.6
Labor Gus Kelly 3371.2+1.2
Nationalist John Fitzpatrick (elected 1)8,44928.7+3.2
Nationalist Charles Rosenthal (elected 3)3,80812.9+12.9
Nationalist Alfred Craig8162.8+2.8
Progressive Arthur Brown1,1623.9-4.1
Progressive Samuel Whitmee9033.1+3.1
Progressive Alfred Birney3481.2+1.2
Progressive Frederic Swann1250.4+0.4
Total formal votes29,40196.3+1.5
Informal votes1,1343.7-1.5
Turnout 30,53571.1+8.7
Party total votes
Labor 13,79046.9-6.4
Nationalist 13,07344.5+11.7
Progressive 2,5388.6-4.6

Botany

1922 New South Wales state election: Botany [5]
PartyCandidateVotes%±%
Labor Thomas Mutch (elected 4)6,73315.0-5.3
Labor William McKell (elected 5)6,17613.8-1.6
Labor Bill Ratcliffe (elected 3)5,81613.0+8.3
Labor Frank Burke (elected 2)4,72210.5-5.9
Labor Simon Hickey (defeated)4,2399.5-0.6
Nationalist John Lee (elected 1)9,36520.9+5.1
Nationalist David Alexander1,3623.0+3.0
Nationalist William Pritchard1,2692.8+2.8
Nationalist William Wassall7561.7+1.7
Nationalist Albert Dunning5321.2+1.2
Democratic Daniel McGrath3,0416.8+6.8
Independent Fred Page 5231.2+1.2
Independent George Overhill1170.3+0.3
Industrial Labor William Wallace710.2+0.2
Independent Patrick Mulheron630.1+0.1
Total formal votes44,78595.0+10.5
Informal votes2,3775.0-10.5
Turnout 47,16268.6+16.8
Party total votes
Labor 27,68661.8-5.2
Nationalist 13,28429.7+9.9
Democratic 3,0416.8-0.8
Independent Fred Page 5231.2+1.2
Independent George Overhill1170.3+0.3
Industrial Labor 710.2+0.2
Independent Patrick Mulheron630.1+0.1

Byron

1922 New South Wales state election: Byron [6]
PartyCandidateVotes%±%
Nationalist George Nesbitt (elected 1)8,67228.8+5.2
Nationalist Stephen Perdriau (elected 2)6,81322.6+22.6
Nationalist John Williams1,0003.3+3.3
Labor Tom Swiney (defeated)6,78222.5+2.9
Labor Roger Kiely2770.9+0.9
Labor Thomas Reidy940.3+0.3
Progressive William Missingham (elected 3)3,08410.20.0
Progressive William Zuill 2,7409.1+9.1
Progressive Stephen Blackman6322.1+2.1
Total formal votes30,09497.2+4.1
Informal votes8672.8-4.1
Turnout 30,96170.8+15.1
Party total votes
Nationalist 16,48554.8+21.9
Labor 7,15323.8+3.0
Progressive 6,45621.4-9.1

Cootamundra

1922 New South Wales state election: Cootamundra [7]
PartyCandidateVotes%±%
Labor Peter Loughlin (elected 1)6,25822.6-3.1
Labor James McGirr (elected 3)5,57720.1-7.2
Labor Ken Hoad 2,0977.6+7.6
Progressive Hugh Main (elected 2)5,96621.5+7.5
Progressive Frederick Tout2,4558.9+8.9
Progressive Thomas Hough1,0563.8+3.8
Nationalist Arthur Manning 3,41012.3+12.3
Nationalist Alfred Wilcox4481.6+1.6
Nationalist George O'Brien2681.0+1.0
Independent William Lucas1700.6+0.6
Total formal votes27,70596.4+1.3
Informal votes1,0273.6-1.3
Turnout 28,73270.6+3.7
Party total votes
Labor 13,93250.3-4.4
Progressive 9,47734.2+6.3
Nationalist 4,12614.9-2.5
Independent William Lucas1700.6+0.6

Cumberland

1922 New South Wales state election: Cumberland [8]
PartyCandidateVotes%±%
Nationalist William FitzSimons (elected 1)7,49825.8+25.8
Nationalist Bruce Walker (elected 3)6,70123.0+0.8
Nationalist Ernest Carr (defeated)6,55522.5+9.0
Labor Voltaire Molesworth (elected 2)7,43425.6+2.4
Labor Charles York1450.5+0.5
Progressive Edwin Crowther3261.1+1.1
Progressive Albert Smith2931.0+1.0
Progressive Reuben Jenner1380.5+0.5
Total formal votes29,09097.0+4.6
Informal votes8833.0-4.6
Turnout 29,97370.0+15.7
Party total votes
Nationalist 20,75471.3+22.8
Labor 7,57926.1-4.4
Progressive 7572.6-10.6

Eastern Suburbs

1922 New South Wales state election: Eastern Suburbs [9]
PartyCandidateVotes%±%
Quota 8,537
Nationalist Charles Oakes (elected 1)10,29720.1+5.2
Nationalist Harold Jaques (elected 3)5,84011.4-3.6
Nationalist Hyman Goldstein (elected 4)5,10610.0+10.0
Nationalist Millicent Preston-Stanley 4,0127.8+7.8
Nationalist William Foster 2,6275.1+5.1
Labor Bob O'Halloran (elected 2)5,94411.6+0.6
Labor Daniel Dwyer (defeated)1,6203.2-1.1
Labor Alfred Warton8591.7+1.7
Labor Robert Campbell6971.4+1.4
Labor Frank Green4800.9+0.9
Democratic Cyril Fallon (elected 5)5,58110.9+10.9
Progressive Joseph Barracluff2,2004.3+4.3
Progressive Frederick Davison2650.5+0.5
Progressive Donald McDonald1880.4+0.4
Progressive Edwin Sautelle1810.4+0.4
Progressive John Keenan1600.3+0.3
Progressive Alfred Barber650.1+0.1
Progressive Alfred Finney580.1+0.1
Independent Richard Meagher 2,4904.9+4.9
Independent Labor Scott Campbell [lower-alpha 1] 2,2424.4+4.4
Soldier's Nationalist Frederick Marks2440.5+0.5
Independent Labor John Hackett470.1+0.1
Independent Jack Lamier130.03+0.03
Total formal votes51,21697.0+8.5
Informal votes1,5773.0-8.5
Turnout 52,79369.1+18.0
Party total votes
Nationalist 27,88254.4+11.1
Labor 9,60018.7-12.0
Democratic 5,58110.9+10.9
Progressive 3,1176.1-5.6
Independent Richard Meagher 2,4904.9+4.9
Independent Labor Johnston Campbell2,2424.4+4.4
Ind. Nationalist Frederick Marks2440.5+0.5
Independent Labor John Hackett470.1+0.1
Independent Jack Lamier130.03+0.03

Goulburn

1922 New South Wales state election: Goulburn [11]
PartyCandidateVotes%±%
Quota 6,427
Labor John Bailey (elected 1)7,32928.5-7.1
Labor Frank Morgan2,0808.1+6.0
Labor Thomas Butler1760.7+0.7
Progressive Thomas Rutledge (elected 3)3,70714.4+2.7
Progressive John O'Reilly2,82011.0+11.0
Progressive Edward Halliday1,8217.1+7.1
Nationalist John Perkins (elected 2)4,60717.9+17.9
Nationalist Henry Bate 3,07812.0+12.0
Independent Francis Grogan760.3+0.3
Independent Samuel Rose120.1+0.1
Total formal votes25,70696.0+5.3
Informal votes1,0594.0-5.3
Turnout 26,76569.6+11.3
Party total votes
Labor 9,58537.3-1.4
Progressive 8,34832.5+11.2
Nationalist 7,68529.9+0.5
Independent Francis Grogan760.3+0.3
Independent Samuel Rose120.1+0.1

Maitland

1922 New South Wales state election: Maitland [12]
PartyCandidateVotes%±%
Quota 6,863
Nationalist Walter Bennett (elected 3)5,41019.7+2.0
Nationalist William Cameron (elected 2)4,78417.4+7.4
Nationalist George Walter4,44616.2+16.2
Labor Walter O'Hearn (elected 1)8,46130.8+12.8
Labor William Brennan 8012.92.9
Labor John Culbert 1170.4+0.4
Progressive Benjamin Gelling2,0607.5+7.5
Progressive Cecil Tindale1,1504.2-1.8
Progressive Herbert Ralston1750.6+0.6
Independent Patrick Ferry470.2+0.2
Total formal votes27,45196.0+4.5
Informal votes1,1304.0-4.5
Turnout 28,58169.5+14.2
Party total votes
Nationalist 14,64053.3+21.2
Labor 9,37934.2-2.9
Progressive 3,38512.3-17.6
Independent Patrick Ferry470.2+0.2

Murray

1922 New South Wales state election: Murray [13]
PartyCandidateVotes%±%
Quota 6,162
Nationalist Richard Ball (elected 1)7,93332.2+12.3
Nationalist Edward Collins 1,8957.7+7.7
Nationalist John Jelbart3421.4+1.4
Labor William O'Brien (elected 2)6,34325.7+1.3
Labor Patrick Quilty2,1378.7+8.7
Labor Walter Boston 1,6746.8+6.8
Progressive Matthew Kilpatrick (elected 3)3,04312.3+8.6
Progressive Ernest Field7383.0+3.0
Progressive John Smithenbecker5392.2+2.2
Total formal votes24,64495.8+2.1
Informal votes1,0924.2-2.1
Turnout 25,73665.2+9.3
Party total votes
Nationalist 10,17041.3+10.1
Labor 10,15441.2-4.7
Progressive 4,32017.5-5.4

Murrumbidgee

1922 New South Wales state election: Murrumbidgee [14]
PartyCandidateVotes%±%
Quota 6,322
Labor Martin Flannery (elected 1)9,51637.6+20.4
Labor James Tully 6002.4+2.4
Labor James Lyons 2140.9+0.9
Progressive Ernest Buttenshaw (elected 2)8,70134.4+23.1
Progressive George Wilson 5442.1+2.1
Progressive Henry Moulder 5322.1+2.1
Progressive James Milthorpe5062.0+2.0
Nationalist Arthur Grimm (elected 3)3,71214.7-2.5
Nationalist William Hall7232.9+2.9
Nationalist John Macallister860.3+0.3
Independent James McMahon1510.6+0.6
Total formal votes25,28595.0+4.3
Informal votes1,3215.0-4.3
Turnout 26,60663.9+4.9
Party total votes
Labor 10,33040.9-5.0
Progressive 10,28340.7+15.9
Nationalist 4,52117.9+0.7
Independent James McMahon1510.6+0.6

Namoi

1922 New South Wales state election: Namoi [15]
PartyCandidateVotes%±%
Quota 6,483
Nationalist Frank Chaffey (elected 2)5,82322.5+9.4
Nationalist Walter Wearne (elected 3)5,36320.7+5.8
Labor Patrick Scully (elected 1)7,88030.4-6.5
Labor William Scully 1,6026.2+4.4
Labor Septimus Humphries3251.3+1.3
Progressive Roland Green 1,9067.3+7.3
Progressive Albert Studdy5992.3+2.3
Independent Robert Levien 2,4339.4-1.2
Total formal votes25,93196.0+2.5
Informal votes1,0874.0-2.5
Turnout 27,01870.2+8.5
Party total votes
Nationalist 11,18643.1+18.0
Labor 9,80737.8-3.6
Progressive 2,5059.7-13.2
Independent Robert Levien 2,4339.4-1.2

Newcastle

1922 New South Wales state election: Newcastle [16]
PartyCandidateVotes%±%
Quota 8,688
Labor Jack Baddeley (elected 2)11,85022.7+22.7
Labor David Murray (elected 4)6,62912.7+6.2
Labor Hugh Connell (elected 3)3,6467.0-13.5
Labor David Watson 2,3564.5+4.5
Labor Amram Lewis1,5292.9-1.3
Independent Walter Skelton (elected 1)13,13225.2+25.2
Nationalist Magnus Cromarty (elected 5)2,8335.4+5.4
Nationalist John Fegan (defeated)1,6023.1-3.3
Nationalist Harry Wheeler1,2602.4+2.4
Nationalist Robert Kilgour1,0522.0+2.0
Nationalist Kenneth Mathieson5161.0+1.0
Independent Labor Arthur Gardiner (defeated)4,6448.9-8.8
Independent Thomas Hoare5661.1+1.1
Progressive George Jenner2950.6+0.6
Progressive John Cram1510.3+0.3
Independent James Gilligan380.1+0.1
Independent William Jeffery270.1+0.1
Total formal votes52,12696.7+9.3
Informal votes1,7713.3-9.3
Turnout 53,89775.2+16.1
Party total votes
Labor 26,01049.9-7.6
Independent Walter Skelton 13,13225.2+25.2
Nationalist 7,26313.9+1.0
Independent Labor Arthur Gardiner 4,6448.9-8.8
Independent Thomas Hoare5661.1+1.1
Progressive 4460.9-2.3
Independent James Gilligan380.1+0.1
Independent William Jeffery270.1+0.1

North Shore

1922 New South Wales state election: North Shore [17]
PartyCandidateVotes%±%
Quota 8,456
Nationalist Reginald Weaver (elected 1)10,22620.2+4.9
Nationalist Richard Arthur (elected 4)5,48810.8-3.4
Nationalist Arthur Cocks (elected 3)5,48310.8+2.8
Nationalist Alfred Reid (defeated)4,4698.8
Nationalist Arthur Walker2,4934.9
Nationalist Albert Whatmore2,0884.12
Labor Cecil Murphy (elected 2)8,30216.4+8.5
Labor James Donaldson5051.0+1.0
Labor John Cochran 2060.4+0.4
Labor Arthur Tonge 63+0.1+0.1
Labor William Killingsworth430.1+0.1
Ind. Coalitionist William Fell (elected 5)5,72711.3+11.3
Democratic Timothy O'Donoghue3,5697.0-0.3
Independent Jacob Fotheringham1,3812.7+2.7
Independent Edward Clark6331.3-1.5
Independent Harry Meatheringham580.1+0.1
Total formal votes50,73497.7+10.4
Informal votes1,2052.3-10.4
Turnout 51,93972.8+16.8
Party total votes
Nationalist 30,24759.6+13.7
Labor 9,11918.0-0.3
Ind. Coalitionist William Fell 5,72711.3+11.3
Democratic 3,5697.0-0.3
Independent Jacob Fotheringham1,3812.7+2.7
Independent Edward Clark6331.3-1.5
Independent Harry Meatheringham580.1+0.1

Northern Tableland

1922 New South Wales state election: Northern Tableland
PartyCandidateVotes%±%
Quota 5,819
Progressive Michael Bruxner (elected 1)9,09439.1+15.6
Progressive David Drummond (elected 3)3,49315.0+5.0
Progressive James McIlveen5632.4+2.4
Labor Alfred McClelland (elected 2)6,27627.0-2.5
Labor Phillip Killey7043.0+3.0
Labor Amos Clarke4221.8+1.8
Nationalist David Doull1,5326.6+6.6
Nationalist George Ring8723.7+3.7
Nationalist Albert Head3181.4+1.4
Total formal votes23,27495.4+1.8
Informal votes1,1224.6-1.8
Turnout 24,39665.5+8.1
Party total votes
Progressive 13,15056.5+7.5
Labor 7,40231.8-5.4
Nationalist 2,72211.7-2.0

Oxley

1922 New South Wales state election: Oxley [18]
PartyCandidateVotes%±%
Quota 7,634
Progressive Roy Vincent (elected 2)3,84412.6+12.6
Progressive Richard Price (defeated)3,49511.4-8.4
Progressive Lewis Martin 2,1166.9+6.9
Progressive Harold Henderson1,7605.8+5.8
Progressive Matthew Wallace1,1453.8+3.8
Progressive Charles Algie9133.0+3.0
Progressive Albert Whatson3661.2+1.2
Nationalist Theodore Hill (elected 1)3,91412.8+12.8
Nationalist Henry Morton 3,62211.9-6.1
Nationalist William McRae1,7485.7+5.7
Labor Joseph Fitzgerald (elected 3)4,23413.9-9.3
Labor Alfred O'Neill2,4988.2+8.2
Labor Frederick Bennett3831.3+1.3
Independent Patrick Moran4961.6+1.6
Total formal votes30,53496.8+3.4
Informal votes1,0023.2-3.4
Turnout 31,53673.0+19.8
Party total votes
Progressive 13,63944.7-10.5
Nationalist 9,28430.4+12.4
Labor 7,11523.3-1.6
Independent Patrick Moran4961.6+1.6

Parramatta

1922 New South Wales state election: Parramatta [19]
PartyCandidateVotes%±%
Quota 7,837
Nationalist Albert Bruntnell (elected 1)13,46843.0+7.2
Nationalist Leicester Simpson2,1646.9+6.9
Nationalist Thomas Morrow (elected 3)8542.7+2.7
Nationalist Charles Willoughby3301.0+1.0
Labor Jack Lang (elected 2)12,90641.2-8.3
Labor Bill Ely (defeated)8212.6+0.3
Labor George Harrison1850.6+0.6
Independent Labor Saxon Hurst3471.1+1.1
Independent Labor James Boughey1580.5+0.5
Independent John Blake1120.4+0.4
Total formal votes31,34596.4+4.7
Informal votes1,1833.6-4.7
Turnout 32,52871.4+14.3
Party total votes
Nationalist 16,81653.6+15.0
Labor 13,91244.4-8.1
Independent Labor Saxon Hurst3471.1+1.1
Independent Labor James Boughey1580.5+0.5
Independent John Blake1120.4+0.4

Ryde

1922 New South Wales state election: Ryde [20]
PartyCandidateVotes%±%
Quota 9,454
Nationalist Thomas Henley (elected 1)16,00728.2+5.9
Nationalist David Anderson (elected 2)7,73213.6+5.2
Nationalist Edward Loxton (elected 3)6,86612.1-4.5
Nationalist Thomas Bavin (elected 5)4,9468.7+8.7
Nationalist Norman McIntosh3,2605.7+5.7
Nationalist Herbert Small2,0663.6+3.6
Labor Robert Greig (elected 4)8,23814.5+5.9
Labor William Hutchison4,9698.8-0.5
Labor John English5741.0+1.0
Labor Thomas Maher4010.7+0.7
Labor Alexander Mackie3230.6+0.6
Progressive Ernest Thompson9231.6+1.6
Independent John Pattison4150.7+0.7
Total formal votes56,72097.1+8.1
Informal votes1,6642.9-8.1
Turnout 58,38474.3+17.1
Party total votes
Nationalist 40,87772.1+32.6
Labor 14,50525.6-2.8
Progressive Ernest Thompson9231.6-10.2
Independent John Pattison4150.7+0.7

St George

1922 New South Wales state election: St George [21]
PartyCandidateVotes%±%
Quota 8,832
Nationalist Thomas Ley (elected 1)10,07119.0+19.0
Nationalist Guy Arkins (elected 2)8,71716.4+6.9
Nationalist William Bagnall (elected 4)4,8299.1-6.2
Nationalist John Ewen2,6365.0+5.0
Nationalist Francis Farrar1,3712.6+2.6
Nationalist John Willson6941.3+1.3
Labor Mark Gosling (elected 3)8,42315.9+10.5
Labor George Cann (elected 5)6,81812.9-8.1
Labor Sam Toombs 4,8529.2-0.9
Labor Patrick Donovan1,5863.0+0.5
Labor Arthur Jones6101.2+1.2
Progressive Reginald McDonald1,9993.8+3.8
Progressive John Cordell1260.2+0.2
Progressive John Wilson800.1+0.1
Independent John Cooper980.2+0.2
Independent Henry Short620.1+0.1
Independent John Gager170.03+0.03
Total formal votes52,98996.4+6.0
Informal votes1,9633.6-6.0
Turnout 54,95273.5+15.9
Party total votes
Nationalist 28,31853.4+21.1
Labor 22,28942.1+0.4
Progressive 2,2054.2-13.5
Independent John Cooper980.2+0.2
Independent Henry Short620.1+0.1
Independent John Gager170.03+0.03

Sturt

1922 New South Wales state election: Sturt [22]
PartyCandidateVotes%±%
Quota 4,371
Labor Mat Davidson (elected 1)5,47231.3+7.1
Labor Jabez Wright (elected 3)1,92211.0-7.4
Labor Ted Horsington 7084.1+4.1
Nationalist Brian Doe (elected 2)3,40119.5-5.1
Nationalist William Daish1,6709.5+9.5
Nationalist John Wicks7074.0+4.0
Industrial Labor Donald Grant 1,3787.9+7.9
Independent Ernest Wetherell8564.9+4.9
Independent William Couch7854.5+4.5
Progressive Walter O'Grady5052.9+2.9
Independent Charles Dooley760.4+0.4
Total formal votes17,48094.5+2.4
Informal votes1,0135.5-2.4
Turnout 18,49359.4+9.7
Party total votes
Labor 8,10246.4+0.7
Nationalist 5,77833.0+6.8
Industrial Labor 1,3787.9+7.9
Independent Ernest Wetherell8564.9+4.9
Independent William Couch7854.5+4.5
Progressive 5052.9+2.9
Independent Charles Dooley760.4+0.4

Sydney

1922 New South Wales state election: Sydney [23]
PartyCandidateVotes%±%
Quota 6,351
Labor Greg McGirr (elected 1)6,30416.6+16.6
Labor John Birt (elected 4)5,43314.30.0
Labor Patrick Minahan (elected 5)3,7569.9+0.3
Labor Michael Burke (defeated)3,5899.4-0.6
Labor George Mullins 1,7184.5+4.5
Nationalist Joseph Jackson (elected 2)4,86412.8+2.9
Nationalist Daniel Levy (elected 3)3,1788.3-9.8
Nationalist Richard Caldwell1,9295.1+5.1
Nationalist Ernest Salmon1,6724.4+4.4
Nationalist Ernest Marks 1,6184.2+4.2
Nationalist William Nicholls2470.6+0.6
Independent Ben Fuller 3,0007.9+7.9
Independent Edward Price2270.6+0.6
Independent Henry Jones1660.4+0.4
Industrial Labor William McCristal 980.3+0.3
Independent Richard Allen830.2+0.2
Independent Sydney Brown480.1+0.1
Independent Alfred Bartlett360.1+0.1
Independent Albert Clifton280.1+0.1
Independent Charles Tuck280.1+0.1
Independent Edwin Miller250.1+0.1
Independent William Pickup190.1+0.1
Independent Solomon Rosenberg140.04+0.04
Independent Robert Williams110.03+0.03
Independent Ernest Llewelyn110.03+0.03
Total formal votes38,10295.7+11.0
Informal votes1,7144.3-11.0
Turnout 39,81658.1+13.7
Party total votes
Labor 20,80054.6+1.0
Nationalist 13,50835.4+7.3
Independent Ben Fuller 3,0007.9+7.9
Independent Edward Price2270.6+0.6
Independent Henry Jones1660.4+0.4
Industrial Labor 980.3+0.3
Independent Richard Allen830.2+0.2
Independent Sydney Brown480.1+0.1
Independent Alfred Bartlett360.1+0.1
Independent Albert Clifton280.1+0.1
Independent Charles Tuck280.1+0.1
Independent Edwin Miller250.1+0.1
Independent William Pickup190.1+0.1
Independent Solomon Rosenberg140.04+0.04
Independent Robert Williams110.03+0.03
Independent Ernest Llewelyn110.03+0.03

Wammerawa

1922 New South Wales state election: Wammerawa [24]
PartyCandidateVotes%±%
Quota 6,571
Labor Bill Dunn (elected 1)6,85426.1-13.6
Labor Joseph Clark (defeated)4,81018.3+8.8
Labor William Webster 8213.1-1.1
Progressive Harold Thorby (elected 2)2,85510.9+0.4
Progressive Gordon Wilkins 2,5229.6+9.6
Progressive George Oram9303.5+3.5
Progressive James Berryman7262.8+2.8
Progressive Edward Scully3661.4+1.4
Progressive Edward Kater2661.0+1.0
Nationalist Percy Shortland1,3865.3+5.3
Nationalist John Macdonald1,3145.0+5.0
Nationalist John Wark5162.0+2.0
Independent William Ashford (elected 3)2,89111.0+11.0
Independent Arthur Heany230.1+0.1
Total formal votes26,28096.3+4.2
Informal votes1,0013.7-4.2
Turnout 27,28171.3+8.0
Party total votes
Labor 12,48547.5-5.9
Progressive 7,66529.2+8.3
Nationalist 3,21612.2-12.0
Independent William Ashford 2,89111.0+11.0
Independent Arthur Heany230.1+0.1

Petition and recount

Joseph Clark petitioned the Governor against the return of William Ashford, alleging that the returning officer made an error in calculating the transfer value for the distribution of surplus to quota votes. [25] The Committee of Elections and Qualifications upheld the petition, overturning the election of Ashford and declaring that Clark was elected as the member for Wammerawa. [26] [27]

Western Suburbs

1922 New South Wales state election: Western Suburbs [28]
PartyCandidateVotes%±%
Quota 8,274
Nationalist Tom Hoskins (elected 3)8,12716.4+3.3
Nationalist John Ness (elected 4)8,05516.2+16.2
Nationalist James Wilson (elected 5)7,08214.3+14.3
Nationalist Sydney Shillington (defeated)3,9127.9-3.3
Nationalist William Simpson 1,5543.1+3.1
Labor Edward McTiernan (elected 1)9,59819.3+8.7
Labor Carlo Lazzarini (elected 2)6,98614.1+0.3
Labor James Stewart6721.4+1.4
Labor Harold Macdonald4991.0+1.0
Labor Joseph Smith970.2+0.2
Progressive Alexander Huie 2,6705.4+5.4
Progressive Clare Wilson3880.8+0.8
Total formal votes49,64096.9+7.9
Informal votes1,5823.1-7.9
Turnout 51,22274.0+16.2
Party total votes
Nationalist 28,73057.9+21.8
Labor 17,85236.0-0.4
Progressive 3,0586.2-2.0

Wollondilly

1922 New South Wales state election: Wollondilly [29]
PartyCandidateVotes%±%
Quota 7,222
Nationalist Sir George Fuller (elected 1)11,50739.8+11.6
Nationalist Mark Morton (elected 3)3,22911.2-6.5
Nationalist Samuel Emmett6472.2+2.2
Labor Billy Davies (elected 2)8,20828.4-9.5
Labor John Cleary (defeated)4,15814.4+6.5
Labor Walter Thompson1000.4+0.4
Progressive William Howarth7112.5+2.5
Independent Arthur Silvey-Reardon3241.1-0.6
Total formal votes28,88496.3+2.2
Informal votes1,1213.7-2.2
Turnout 30,00575.4+14.9
Party total votes
Nationalist 15,38353.2+7.3
Labor 12,46643.2-9.2
Progressive 7112.5+2.5
Independent Arthur Silvey-Reardon3241.1-0.6

See also

Notes

  1. Scott Campbell had been nominated by the Labor Party for the 1920 election however his endorsement was withdrawn before the polling day because he signed a pledge for the unconditional release of twelve imprisoned members of the Industrial Workers of the World. [10]

Related Research Articles

Wammerawa was an electoral district for the Legislative Assembly in the Australian State of New South Wales, created in 1920, with the introduction of proportional representation and named after an alternative name for the Macquarie River. It mainly replaced Mudgee, Castlereagh and Liverpool Plains and elected three members simultaneously. In 1927, it was split into Mudgee, Castlereagh and Liverpool Plains.

Members of the New South Wales Legislative Assembly who served in the 26th parliament of New South Wales held heir seats from 1922 to 1925. They were elected at the 1922 state election on 25 March 1922. The Speaker was Daniel Levy.

Members of the New South Wales Legislative Assembly who served in the 25th parliament of New South Wales held their seats from 1920 to 1922. They were elected at the 1920 state election on 20 March 1920. The Speaker was Daniel Levy with the exception of 13–20 December 1921 when he was replaced by Simon Hickey.

<span class="mw-page-title-main">1925 New South Wales state election</span> State election for New South Wales, Australia in May 1925

The 1925 New South Wales state election was held on 30 May 1925. This election was for all of the 90 seats in the 27th New South Wales Legislative Assembly and was conducted in multiple-member constituencies using the Hare Clark single transferable vote. The 26th parliament of New South Wales was dissolved on 18 April 1925 by the Governor, Sir Dudley de Chair, on the advice of the Premier Sir George Fuller.

Ryde, an electoral district of the Legislative Assembly in the Australian state of New South Wales, has had four incarnations since it was first established in 1894. It has returned one member for most of its existence, except for the period 1920 to 1927 when it returned five members.

Sydney, an electoral district of the Legislative Assembly in the Australian state of New South Wales, has had two incarnations, the first from 1920 to 1927 as a five-member electorate, the second from 2007 to the present as a single-member electorate.

Balmain, an electoral district of the Legislative Assembly in the Australian state of New South Wales, has had three incarnations since it was established in 1880. It expanded from 1 to 2 to 3 to 4 members before being abolished in 1894. It was re-established in 1904 returning 1 member until 1920. When multiple member constituencies were established using the Hare-Clark single transferable vote in 1920, Balmain returned 5 members. It had a single member from 1927 when the state returned to single member electorates. It was abolished in 1991 and largely replaced by Port Jackson which included the Sydney CBD. It was re-established in 2007 when Port Jackson was abolished.

<span class="mw-page-title-main">William Ashford (politician)</span> Australian politician

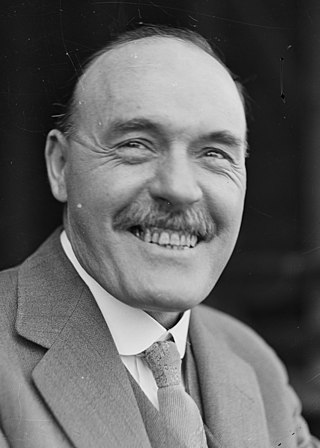
William George Ashford was an Australian politician.

<span class="mw-page-title-main">1922 New South Wales state election</span> State election for New South Wales, Australia in March 1922

The 1922 New South Wales state election was held on 25 March 1922. This election was for all of the 90 seats in the 26th New South Wales Legislative Assembly and it was conducted in multiple member constituencies using the Hare Clark single transferable vote. The 25th parliament of New South Wales was dissolved on 17 February 1922 by the Governor, Sir Walter Edward Davidson, on the advice of the Premier James Dooley.

<span class="mw-page-title-main">Frank Farnell</span> Australian politician (1861–1929)

Frank Farnell was a member of the New South Wales Legislative Assembly representing Central Cumberland and Ryde for the Free Trade Party.

This is a list of electoral district results for the 1950 New South Wales state election.

The 1930 New South Wales state election was for 90 electoral districts each returning a single member with compulsory preferential voting. The principal change from the 1927 election was the division of the state into 3 zones, Sydney with forty-three districts, Newcastle with five, and the country with forty-two. While the average number of enrolled voters per electorate was 16,009, in the country zone the average was 13,028,, in Newcastle 18,933, and Sydney 18,580.

The 1927 New South Wales state election was for 90 electoral districts returning 90 members and all elections were held on 8 October 1927.

The 1925 New South Wales state election was for 90 seats representing 24 electoral districts, with each district returning between 3 and 5 members. This was the third and final election in New South Wales that took place under a modified Hare-Clark voting system. The average number of enrolled voters per member was 14,690, ranging from Sturt (10,297) to Ryde (19,119).

The 1920 New South Wales state election was for 90 seats representing 24 electoral districts, with each district returning between 3 and 5 members. This was the first election in New South Wales that took place under a modified Hare-Clark voting system. The average number of enrolled voters per member was 12,805, ranging from Sturt (11,539) to Sydney (13,478).

The 1858 New South Wales colonial election was to return 54 members of Legislative Assembly composed of 34 electoral districts with 18 returning 1 member, 13 returning 2 members, two returning 3 members and one returning 4 members, all with a first past the post system. In multi-member districts, because each voter could cast more than one vote, it is not possible to total the votes to show the number of voters and voter turnout in these districts is estimated. 17 members from 14 districts were returned unopposed. The electoral districts and boundaries were established under the Electoral Act 1851 (NSW) for the former Legislative Council.

Eastern Suburbs, an electoral district of the Legislative Assembly in the Australian state of New South Wales was created in 1920 and abolished in 1927.

Wammerawa, an electoral district of the Legislative Assembly in the Australian state of New South Wales, was created in 1920 and abolished in 1927.

The 1904 New South Wales state election involved 90 electoral districts returning one member each. The election was conducted on the basis of a simple majority or first-past-the-post voting system. There were two significant changes from the 1901 election, the first was that women were given the right to vote, which saw an increase in the number of enrolled voters from 345,500 in 1901, to 689,490 in 1904. The second was that as a result of the 1903 New South Wales referendum, the number of members of the Legislative Assembly was reduced from 125 to 90. The combined effect of the changes meant that the average number of enrolled voters per electorate went from 2,764, to 7,661, an increase of 277%. Leichhardt was the only district that was not substantially changed, while The Macquarie and The Murray districts retained nothing but the name.

Sturt, an electoral district of the Legislative Assembly in the Australian state of New South Wales, had two incarnations, from 1889 until 1968 and from 1971 until 1981.

References

  1. 1 2 Green, Antony. "1922 election totals". New South Wales Election Results 1856-2007. Parliament of New South Wales . Retrieved 2 October 2019.
  2. Green, Antony. "1922 Turnout". New South Wales Election Results 1856-2007. Parliament of New South Wales . Retrieved 16 November 2021.
  3. Green, Antony. "1922 Balmain". New South Wales Election Results 1856-2007. Parliament of New South Wales . Retrieved 3 May 2020.
  4. Green, Antony. "1922 Bathurst". New South Wales Election Results 1856-2007. Parliament of New South Wales . Retrieved 3 May 2020.
  5. Green, Antony. "1922 Botany". New South Wales Election Results 1856-2007. Parliament of New South Wales . Retrieved 3 May 2020.
  6. Green, Antony. "1922 Byron". New South Wales Election Results 1856-2007. Parliament of New South Wales . Retrieved 3 May 2020.
  7. Green, Antony. "1922 Cootamundra". New South Wales Election Results 1856-2007. Parliament of New South Wales . Retrieved 3 May 2020.
  8. Green, Antony. "1922 Cumberland". New South Wales Election Results 1856-2007. Parliament of New South Wales . Retrieved 3 May 2020.
  9. Green, Antony. "1922 Eastern Suburbs". New South Wales Election Results 1856-2007. Parliament of New South Wales . Retrieved 3 May 2020.
  10. "The ALP: definite action taken against candidates who sign pledges". The Sydney Morning Herald . 10 March 1920. p. 11. Retrieved 2 November 2019 via National Library of Australia.
  11. Green, Antony. "1922 Goulburn". New South Wales Election Results 1856-2007. Parliament of New South Wales . Retrieved 3 May 2020.
  12. Green, Antony. "1922 Maitland". New South Wales Election Results 1856-2007. Parliament of New South Wales . Retrieved 3 May 2020.
  13. Green, Antony. "1922 Murray". New South Wales Election Results 1856-2007. Parliament of New South Wales . Retrieved 3 May 2020.
  14. Green, Antony. "1922 Murrumbidgee". New South Wales Election Results 1856-2007. Parliament of New South Wales . Retrieved 3 May 2020.
  15. Green, Antony. "1922 Namoi". New South Wales Election Results 1856-2007. Parliament of New South Wales . Retrieved 3 May 2020.
  16. Green, Antony. "1922 Newcastle". New South Wales Election Results 1856-2007. Parliament of New South Wales . Retrieved 3 May 2020.
  17. Green, Antony. "1922 North Shore". New South Wales Election Results 1856-2007. Parliament of New South Wales . Retrieved 3 May 2020.
  18. Green, Antony. "1922 Oxley". New South Wales Election Results 1856-2007. Parliament of New South Wales . Retrieved 3 May 2020.
  19. Green, Antony. "1922 Parramatta". New South Wales Election Results 1856-2007. Parliament of New South Wales . Retrieved 3 May 2020.
  20. Green, Antony. "1922 Ryde". New South Wales Election Results 1856-2007. Parliament of New South Wales . Retrieved 3 May 2020.
  21. Green, Antony. "1922 St George". New South Wales Election Results 1856-2007. Parliament of New South Wales . Retrieved 3 May 2020.
  22. Green, Antony. "1922 Sturt". New South Wales Election Results 1856-2007. Parliament of New South Wales . Retrieved 3 May 2020.
  23. Green, Antony. "1922 Sydney". New South Wales Election Results 1856-2007. Parliament of New South Wales . Retrieved 3 May 2020.
  24. Green, Antony. "1922 Wammerawa". New South Wales Election Results 1856-2007. Parliament of New South Wales . Retrieved 3 May 2020.
  25. "Petition: electoral district of Wammerawa". Government Gazette of the State of New South Wales . No. 97. 22 June 1922. p. 3410. Retrieved 4 November 2019 via National Library of Australia.
  26. "Wammerawa: Mr Ashford ousted, Mr Clark elected, committee's decision". The Sydney Morning Herald . 27 July 1922. p. 6. Retrieved 4 November 2019 via National Library of Australia.
  27. Green, Antony. "1922 Wammerawa recount". New South Wales Election Results 1856-2007. Parliament of New South Wales . Retrieved 4 November 2019.
  28. Green, Antony. "1922 Western Suburbs". New South Wales Election Results 1856-2007. Parliament of New South Wales . Retrieved 3 May 2020.
  29. Green, Antony. "1922 Wollondilly". New South Wales Election Results 1856-2007. Parliament of New South Wales . Retrieved 3 May 2020.