Results of the 1973 New South Wales state election (Legislative Assembly)

Last updated

New South Wales state election, 17 November 1973 [1] [2]
Legislative Assembly
<< 19711976 >>

Contents

Enrolled voters2,767,876 [lower-alpha 1]
Votes cast2,560,653 Turnout 92.51-0.75
Informal votes69,225Informal2.70+0.36
Summary of votes by party
PartyPrimary votes %SwingSeatsChange
  Labor 1,069,61442.93–2.0944– 1
  Liberal 843,32533.85–1.8934+ 2
  Country 261,50410.48+1.8318+ 1
  Democratic Labor 148,3785.96+2.791+ 1
  Australia 104,8214.21+3.150± 0
  Communist 8380.03–0.060± 0
  Independent 63,3582.54–3.242± 0
Total2,491,428  99 

This is a list of electoral district results for the 1973 New South Wales state election. [1]

Results by Electoral district

Albury

1973 New South Wales state election: Albury [3]
PartyCandidateVotes%±%
Liberal Gordon Mackie 11,94856.7+5.3
Labor Gordon Mitchell7,37535.0-2.8
Democratic Labor Anthony Quinn1,7618.3-2.5
Total formal votes21,08498.3
Informal votes3611.7
Turnout 21,44592.9
Two-party-preferred result
Liberal Gordon Mackie 13,35763.4+3.4
Labor Gordon Mitchell7,72736.6-3.4
Liberal hold Swing +3.4

Armidale

1973 New South Wales state election: Armidale [4]
PartyCandidateVotes%±%
Country David Leitch 13,29659.7-2.2
Labor Judith Waters8,05336.2-1.9
Democratic Labor Peter McRae9224.1+4.1
Total formal votes22,27198.7
Informal votes2851.3
Turnout 22,55694.4
Two-party-preferred result
Country David Leitch 14,03363.0+1.1
Labor Judith Waters8,23837.0-1.1
Country hold Swing +1.1

Ashfield

1973 New South Wales state election: Ashfield [5]
PartyCandidateVotes%±%
Liberal David Hunter 13,07747.4+2.5
Labor Bede Spillane11,62542.1-1.4
Australia John Jordan1,5315.6+0.1
Democratic Labor Mary Burton1,3775.0-1.1
Total formal votes27,61096.5
Informal votes9933.5
Turnout 28,60390.7
Two-party-preferred result
Liberal David Hunter 14,81053.6+1.5
Labor Bede Spillane12,80046.4-1.5
Liberal hold Swing +1.5

Auburn

1973 New South Wales state election: Auburn [6]
PartyCandidateVotes%±%
Labor Peter Cox 19,37162.8-4.9
Liberal Arthur Deane9,48030.8-1.5
Democratic Labor Christopher Carroll1,9796.4+6.4
Total formal votes30,83097.0
Informal votes9603.0
Turnout 31,79093.7
Two-party-preferred result
Labor Peter Cox 19,76764.1-3.6
Liberal Arthur Deane11,06335.9+3.6
Labor hold Swing -3.6

Balmain

1973 New South Wales state election: Balmain [7]
PartyCandidateVotes%±%
Labor Roger Degen 18,01369.2-3.8
Democratic Labor Gary Doherty4,19616.1+16.1
Australia Rosemary Smith3,83914.7+14.7
Total formal votes26,04894.6
Informal votes1,4765.4
Turnout 27,52489.5
Two-candidate-preferred result
Labor Roger Degen 19,93376.5+3.5
Democratic Labor Gary Doherty6,11523.5+23.5
Labor hold Swing N/A

Bankstown

1973 New South Wales state election: Bankstown [8]
PartyCandidateVotes%±%
Labor Nick Kearns 18,92062.0-1.9
Liberal John Ghent10,30633.8-2.3
Democratic Labor Joseph Sanders1,3034.3+4.3
Total formal votes30,52997.0
Informal votes9413.0
Turnout 31,47093.8
Two-party-preferred result
Labor Nick Kearns 19,18162.8-1.1
Liberal John Ghent11,34837.2+1.1
Labor hold Swing -1.1

Barwon

1973 New South Wales state election: Barwon [9]
PartyCandidateVotes%±%
Country Geoff Crawford 14,02075.5+24.8
Australia Graham Gifford4,54024.5+24.5
Total formal votes18,56096.2
Informal votes7253.8
Turnout 19,28591.7
Country hold Swing +18.8

Bass Hill

1973 New South Wales state election: Bass Hill [10]
PartyCandidateVotes%±%
Labor Neville Wran 17,41360.7-6.1
Liberal Raymond Clark-Smith11,27739.3+6.1
Total formal votes28,69096.4
Informal votes1,0603.6
Turnout 29,75094.5
Labor hold Swing -6.1

Bathurst

1973 New South Wales state election: Bathurst [11]
PartyCandidateVotes%±%
Country Clive Osborne 12,65959.9+9.2
Labor Maxwell Hanrahan7,69836.5-8.3
Democratic Labor John O'Grady7653.6+3.6
Total formal votes21,12298.8
Informal votes2591.2
Turnout 21,38195.6
Two-party-preferred result
Country Clive Osborne 13,27162.8+10.9
Labor Maxwell Hanrahan7,85137.2-10.9
Country hold Swing +10.9

Blacktown

1973 New South Wales state election: Blacktown [12]
PartyCandidateVotes%±%
Labor Gordon Barnier 16,27258.3-1.1
Liberal John Lyon8,93532.0+0.6
Democratic Labor Stan Aster-Stater1,2074.3-1.6
Independent George Perrin1,1354.1+4.1
Independent F. Ivor3661.3+1.3
Total formal votes27,91595.3
Informal votes1,3894.7
Turnout 29,30493.6
Two-party-preferred result
Labor Gordon Barnier 17,50062.7+0.4
Liberal John Lyon10,41537.3-0.4
Labor hold Swing +0.4

Bligh

1973 New South Wales state election: Bligh [13]
PartyCandidateVotes%±%
Liberal John Barraclough 16,76766.3+7.5
Australia Julia Featherstone6,65626.3+26.3
Democratic Labor Monica Quigley1,8837.4+4.5
Total formal votes25,30695.1
Informal votes1,2984.9
Turnout 26,60484.0
Two-candidate-preferred result
Liberal John Barraclough 17,70970.0+5.9
Australia Julia Featherstone7,59730.0+30.0
Liberal hold Swing +5.9

Blue Mountains

1973 New South Wales state election: Blue Mountains [14]
PartyCandidateVotes%±%
Independent Harold Coates 1,22954.9+0.1
Labor Mick Clough 9,33941.9+2.5
Democratic Labor Joseph Conroy7093.2-0.8
Total formal votes22,27798.6
Informal votes3141.4
Turnout 22,59194.0
Two-candidate-preferred result
Independent Harold Coates 12,58456.5-1.2
Labor Mick Clough 9,69343.5+1.2
Independent hold Swing -1.2

Broken Hill

1973 New South Wales state election: Broken Hill [15]
PartyCandidateVotes%±%
Labor Lew Johnstone unopposed
Labor hold 

Burrendong

1973 New South Wales state election: Burrendong [16]
PartyCandidateVotes%±%
Country Roger Wotton 9,37344.3-3.9
Labor Leo Nott 9,05142.8-9.0
Liberal Beryl Bowman 2,72112.9+12.9
Total formal votes21,14599.0
Informal votes2141.0
Turnout 21,35994.4
Two-party-preferred result
Country Roger Wotton 11,38453.8+5.6
Labor Leo Nott 9,76146.2-5.6
Country gain from Labor Swing +5.6

Burrinjuck

1973 New South Wales state election: Burrinjuck [17]
PartyCandidateVotes%±%
Labor Terry Sheahan 9,69049.0-9.5
Liberal Leon Garry4,07920.6+1.9
Country James Brooks2,87614.5-8.3
Country Edward O'Connor2,70213.6+13.6
Democratic Labor John Roche4422.2+2.2
Total formal votes19,78998.2
Informal votes3631.8
Turnout 20,15295.1
Two-party-preferred result
Labor Terry Sheahan 10,30052.0-7.8
Country James Brooks9,48948.0+7.8
Labor hold Swing -7.8

Burwood

1973 New South Wales state election: Burwood [18]
PartyCandidateVotes%±%
Liberal John Jackett 14,40157.2+5.6
Labor Phil O'Neill 9,14236.3+2.5
Democratic Labor Agnes Bannon1,6426.5+6.5
Total formal votes25,18597.0
Informal votes7653.0
Turnout 25,95091.1
Two-party-preferred result
Liberal John Jackett 15,71562.4-1.4
Labor Phil O'Neill 9,47037.6+1.4
Liberal hold Swing -1.4

Byron

1973 New South Wales state election: Byron [19]
PartyCandidateVotes%±%
Country Jack Boyd 12,39761.8+7.3
Labor James Constable6,58932.8-12.7
Australia Brian Halesworth1,0835.4+5.4
Total formal votes20,06998.7
Informal votes2571.3
Turnout 20,32692.5
Two-party-preferred result
Country Jack Boyd 12,90064.3+9.8
Labor James Constable7,16935.7-9.8
Country hold Swing +9.8

Campbelltown

1973 New South Wales state election: Campbelltown [20]
PartyCandidateVotes%±%
Labor Cliff Mallam 14,01651.7-6.5
Liberal John Marsden11,32141.80.0
Independent Elizabeth Bye1,0003.7+3.7
Democratic Labor Francis Bulger7532.8+2.8
Total formal votes27,09097.3
Informal votes7442.7
Turnout 27,83493.9
Two-party-preferred result
Labor Cliff Mallam 15,07455.6-2.6
Liberal John Marsden12,01644.4+2.6
Labor hold Swing -2.6

Canterbury

1973 New South Wales state election: Canterbury [21]
PartyCandidateVotes%±%
Labor Kevin Stewart 16,78458.8-3.7
Liberal Jack Backer10,29636.1-1.4
Democratic Labor John George1,4485.1+5.1
Total formal votes28,52896.4
Informal votes1,0713.6
Turnout 29,59991.0
Two-party-preferred result
Labor Kevin Stewart 17,07859.9-2.6
Liberal Jack Backer11,45040.1+2.6
Labor hold Swing -2.6

Casino

1973 New South Wales state election: Casino [22]
PartyCandidateVotes%±%
Labor Don Day 9,53047.1-3.9
Country Donald McRae4,52922.4-26.6
Country Owen Wainwright4,09220.2+20.2
Independent Clifford Hirst2,08410.3+10.3
Total formal votes20,23599.1
Informal votes1810.9
Turnout 20,41693.9
Two-party-preferred result
Labor Don Day 10,31851.00.0
Country Donald McRae9,91749.00.0
Labor hold Swing 0.0

Castlereagh

1973 New South Wales state election: Castlereagh [23]
PartyCandidateVotes%±%
Labor Jack Renshaw 9,44650.3-6.1
Country Albert Green6,74835.9+14.4
Liberal Lionel Gray2,58613.8-2.8
Total formal votes18,78098.5
Informal votes2801.5
Turnout 19,06092.1
Two-party-preferred result
Labor Jack Renshaw 9,64051.3-7.4
Country Albert Green9,14048.7+7.4
Labor hold Swing -7.4

Cessnock

1973 New South Wales state election: Cessnock [24]
PartyCandidateVotes%±%
Labor George Neilly 17,09378.1-2.3
Democratic Labor Bernard Burke4,80121.9+21.9
Total formal votes21,89497.4
Informal votes5832.6
Turnout 22,47795.9
Labor hold Swing -2.3

Charlestown

1973 New South Wales state election: Charlestown [25]
PartyCandidateVotes%±%
Labor Richard Face 16,54353.9-0.8
Liberal Paul Clarkson11,27236.7+0.3
Australia John Steele1,8135.9+2.2
Democratic Labor Ignatius Philippa1,0623.5-1.7
Total formal votes30,69098.0
Informal votes6262.0
Turnout 31,31696.0
Two-party-preferred result
Labor Richard Face 17,91058.4+0.1
Liberal Paul Clarkson12,78041.6-0.1
Labor hold Swing +0.1

Clarence

1973 New South Wales state election: Clarence [26]
PartyCandidateVotes%±%
Country Matt Singleton 15,23663.9+28.8
Labor Patricia Oakman6,87728.9-7.2
Democratic Labor William Eckersley9944.2+4.2
Australia Terrence Hancock7273.1+3.1
Total formal votes23,83498.6
Informal votes3451.4
Turnout 24,17994.4
Two-party-preferred result
Country Matt Singleton 16,23068.1+13.0
Labor Patricia Oakman7,60431.9-13.0
Country hold Swing +13.0

Coogee

1973 New South Wales state election: Coogee [27]
PartyCandidateVotes%±%
Labor Michael Cleary 13,09245.5+3.1
Liberal Ross Freeman 12,95845.1-1.5
Australia Ann Sutherland1,9176.7+6.7
Democratic Labor Betty Stepkovitch7792.7-1.8
Total formal votes28,74697.1
Informal votes8692.9
Turnout 29,61588.4
Two-party-preferred result
Liberal Ross Freeman 14,37750.01-2.9
Labor Michael Cleary 14,36949.99+2.9
Liberal hold Swing -2.9

Corrimal

1973 New South Wales state election: Corrimal [28]
PartyCandidateVotes%±%
Labor Laurie Kelly 15,98558.1
Liberal Robert Law7,82228.4
Australia Susan Healy2,3878.7
Democratic Labor Peter Daly1,3044.7
Total formal votes27,49897.2
Informal votes7962.8
Turnout 28,29492.8
Two-party-preferred result
Labor Laurie Kelly 17,80664.8+1.5
Liberal Robert Law9,69135.2-1.5
Labor hold Swing +1.5

Cronulla

1973 New South Wales state election: Cronulla [29]
PartyCandidateVotes%±%
Liberal Ian Griffith 14,78250.8+0.7
Labor Michael Egan 11,68640.2-2.0
Australia Marjory Gray1,9366.6+6.6
Democratic Labor Bernard Forshaw7002.4+2.4
Total formal votes29,10498.6
Informal votes4231.4
Turnout 29,52794.1
Two-party-preferred result
Liberal Ian Griffith 15,92354.7+2.2
Labor Michael Egan 13,18145.3-2.2
Liberal hold Swing +2.2

Davidson

1973 New South Wales state election: Davidson [30]
PartyCandidateVotes%±%
Liberal Dick Healey 15,29861.3-18.9
Labor Walter Willington5,89723.6+23.6
Australia Veronica Carey2,72910.9+10.9
Democratic Labor Thomas Colman1,0484.2-15.6
Total formal votes24,97298.2
Informal votes4541.8
Turnout 25,42693.4
Two-party-preferred result
Liberal Dick Healey 17,22869.0-11.2
Labor Walter Willington7,74431.0+31.0
Liberal hold Swing -11.2

Drummoyne

1973 New South Wales state election: Drummoyne [31]
PartyCandidateVotes%±%
Labor Michael Maher 13,70149.8-7.2
Liberal Brian Barber12,41945.1+2.1
Democratic Labor Vincent Abrams1,4025.1+5.1
Total formal votes27,52297.0
Informal votes8413.0
Turnout 28,36393.9
Two-party-preferred result
Labor Michael Maher 13,95050.7-6.3
Liberal Brian Barber13,57249.3+6.3
Labor hold Swing -6.3

Dubbo

1973 New South Wales state election: Dubbo [32]
PartyCandidateVotes%±%
Liberal John Mason 13,69560.8+9.0
Labor Emily Renshaw7,64934.0-6.2
Democratic Labor Michael Stephens1,1735.2-2.8
Total formal votes22,51798.8
Informal votes2831.2
Turnout 22,80094.3
Two-party-preferred result
Liberal John Mason 14,63365.0+6.8
Labor Emily Renshaw7,88435.0-6.8
Liberal hold Swing +6.8

Earlwood

1973 New South Wales state election: Earlwood [33]
PartyCandidateVotes%±%
Liberal Eric Willis 15,49851.6-5.7
Labor Colin Williams11,62838.7-4.0
Australia Alexander Paterson1,5665.2+5.2
Democratic Labor Doris Allison1,3314.4+4.4
Total formal votes30,02397.2
Informal votes8482.8
Turnout 30,87195.1
Two-party-preferred result
Liberal Eric Willis 17,03356.7-0.6
Labor Colin Williams12,99043.3+0.6
Liberal hold Swing -0.6

East Hills

1973 New South Wales state election: East Hills [34]
PartyCandidateVotes%±%
Labor Pat Rogan 16,33754.4-2.5
Liberal John Edwards9,84232.8+11.5
Australia Robert Walsh2,1657.2+7.2
Democratic Labor John Anderson1,6645.6+5.6
Total formal votes30,00897.8
Informal votes6592.2
Turnout 30,66795.4
Two-party-preferred result
Labor Pat Rogan 18,33761.1-2.3
Liberal John Edwards11,67138.9+2.3
Labor hold Swing -2.3

Eastwood

1973 New South Wales state election: Eastwood [35]
PartyCandidateVotes%±%
Liberal Jim Clough 17,98062.5+3.3
Australia John Butterworth7,95627.7+27.7
Democratic Labor Paul Burton2,8349.8+9.8
Total formal votes28,77097.3
Informal votes7882.7
Turnout 29,55892.8
Two-candidate-preferred result
Liberal Jim Clough 19,39767.4-0.9
Australia John Butterworth9,37332.6+32.6
Liberal hold Swing -0.9

Fairfield

1973 New South Wales state election: Fairfield [36]
PartyCandidateVotes%±%
Labor Eric Bedford 17,71364.0-0.3
Liberal Domenic Pangallo7,84328.3-3.6
Australia Robert Tuckwell1,2974.7+4.7
Democratic Labor Maurice George8403.0+3.0
Total formal votes27,69395.0
Informal votes1,4585.0
Turnout 29,15192.2
Two-party-preferred result
Labor Eric Bedford 18,78967.8-1.6
Liberal Domenic Pangallo8,90432.2+1.6
Labor hold Swing -1.6

Fuller

1973 New South Wales state election: Fuller [37]
PartyCandidateVotes%±%
Liberal Peter Coleman 14,26049.8+3.6
Labor William Waters10,23135.7-7.5
Australia Jean Braithwaite1,9326.8+6.8
Independent Philip Arantz1,3664.8+4.8
Democratic Labor Timothy Abrams8493.0+3.0
Total formal votes28,63897.6
Informal votes7112.4
Turnout 29,34993.2
Two-party-preferred result
Liberal Peter Coleman 15,82355.3+3.1
Labor William Waters12,81544.7-3.1
Liberal hold Swing +3.1

Georges River

1973 New South Wales state election: Georges River [38]
PartyCandidateVotes%±%
Labor Frank Walker 13,53345.4-6.0
Liberal Roderick MacKenzie13,24144.4-4.2
Australia Peter Eden1,6145.4+5.4
Democratic Labor Charles Kane8452.8+2.8
Independent Kenneth Cavanough5551.9+1.9
Total formal votes29,788897.9
Informal votes6312.1
Turnout 30,41995.3
Two-party-preferred result
Labor Frank Walker 15,10350.7-0.7
Liberal Roderick MacKenzie14,68549.3+0.7
Labor hold Swing -0.7

Gloucester

1973 New South Wales state election: Gloucester [39]
PartyCandidateVotes%±%
Country Leon Punch 12,70865.2+3.1
Labor Terence Wallis4,35522.3-5.3
Democratic Labor Herbert Collins2,43512.5+12.5
Total formal votes19,49898.6
Informal votes2731.4
Turnout 19,77192.7
Two-party-preferred result
Country Leon Punch 14,65675.2+10.4
Labor Terence Wallis4,84224.8-10.4
Country hold Swing +10.4

Gordon

1973 New South Wales state election: Gordon [40]
PartyCandidateVotes%±%
Democratic Labor Kevin Harrold 20,70779.4+61.0
Labor Miron Shapira5,37220.6+20.6
Total formal votes26,07996.3
Informal votes1,0043.7
Turnout 27,08392.3
Democratic Labor gain from Liberal Swing N/A

The sitting member was Harry Jago (Liberal) who failed to nominate in time. [40]

Gosford

1973 New South Wales state election: Gosford [41]
PartyCandidateVotes%±%
Liberal Malcolm Brooks 12,30752.7+6.6
Labor Brian McGowan 10,18243.6-4.3
Democratic Labor William Dunbar8733.7+3.7
Total formal votes23,36298.3
Informal votes3961.7
Turnout 23,75893.5
Two-party-preferred result
Liberal Malcolm Brooks 13,00555.7+4.6
Labor Brian McGowan 10,35744.3-4.6
Liberal notional  hold Swing +4.6

The sitting member was Keith O'Connell (Labor) however the 1973 redistribution made Gosford a notional Liberal seat and O'Connell successfully contested the new seat of Peats.

Goulburn

1973 New South Wales state election: Goulburn [42]
PartyCandidateVotes%±%
Country Ron Brewer 13,38664.0+2.0
Labor Noel Lane6,45330.8-7.2
Democratic Labor Raymond Albrighton7733.7+3.7
Independent Evan Treharne3111.5+1.5
Total formal votes20,92398.3
Informal votes3541.7
Turnout 21,27795.0
Two-party-preferred result
Country Ron Brewer 14,21567.9+5.9
Labor Noel Lane6,70832.1-5.9
Country hold Swing +5.9

Granville

1973 New South Wales state election: Granville [43]
PartyCandidateVotes%±%
Labor Pat Flaherty 18,35366.5-0.8
Liberal John Newland7,96428.9-3.8
Democratic Labor Terrence Luthy1,2664.6+4.6
Total formal votes27,58396.4
Informal votes1,0323.6
Turnout 28,61592.6
Two-party-preferred result
Labor Pat Flaherty 18,60667.5+0.2
Liberal John Newland8,97732.5-0.2
Labor hold Swing +0.2

Hawkesbury

1973 New South Wales state election: Hawkesbury [44]
PartyCandidateVotes%±%
Liberal Kevin Rozzoli 16,18360.9+10.0
Labor Peter Stone8,05030.3-12.3
Independent John McMahon8403.2+3.2
Australia Peter Knowland7622.9+2.9
Democratic Labor Emma Ekman7272.7+2.7
Total formal votes26,56296.7
Informal votes9123.3
Turnout 27,47491.8
Two-party-preferred result
Liberal Kevin Rozzoli 17,66466.5+10.0
Labor Peter Stone8,89833.5-10.0
Liberal hold Swing +10.0

Heathcote

1973 New South Wales state election: Heathcote [45]
PartyCandidateVotes%±%
Labor Rex Jackson 16,49058.50.0
Liberal Philip Benwell8,06928.6-5.0
Independent Norman Tonkin2,7439.7+9.7
Democratic Labor Margaret Silva8873.2+3.2
Total formal votes28,18997.9
Informal votes6172.1
Turnout 28,80694.0
Two-party-preferred result
Labor Rex Jackson 18,46465.5-1.7
Liberal Philip Benwell9,72534.5+1.7
Labor hold Swing -1.7

Heffron

1973 New South Wales state election: Heffron [46]
PartyCandidateVotes%±%
Labor Laurie Brereton 18,75368.0+1.9
Democratic Labor Paul Evans5,59620.3+20.3
Australia Peter Clark3,23311.7+11.7
Total formal votes27,58294.8
Informal votes1,5255.2
Turnout 29,10789.6
Two-candidate-preferred result
Labor Laurie Brereton 20,36973.8+7.7
Democratic Labor Paul Evans7,21326.2+26.2
Labor notional  hold Swing +7.7

Heffron was a new seat with a notional Labor majority.

Hornsby

1973 New South Wales state election: Hornsby [47]
PartyCandidateVotes%±%
Liberal Neil Pickard 17,78860.0+5.6
Labor Brian Silvia9,85233.2+33.2
Democratic Labor Cecil Wallace2,0216.8+0.3
Total formal votes29,66197.9
Informal votes6472.1
Turnout 30,30893.2
Two-party-preferred result
Liberal Neil Pickard 19,40565.4+5.6
Labor Brian Silvia10,25634.6+34.6
Liberal hold Swing +5.6

Hurstville

1973 New South Wales state election: Hurstville [48]
PartyCandidateVotes%±%
Liberal Tom Mead 14,22848.7+1.3
Labor Kevin Ryan 12,39842.5+2.0
Independent Paul Flottmann1,7616.0+6.0
Democratic Labor Anthony Young8212.8-2.5
Total formal votes29,20898.1
Informal votes5581.9
Turnout 29,76694.0
Two-party-preferred result
Liberal Tom Mead 15,50453.1+0.3
Labor Kevin Ryan 13,70446.9-0.3
Liberal hold Swing +0.3

Illawarra

1973 New South Wales state election: Illawarra [49]
PartyCandidateVotes%±%
Labor George Petersen 19,52372.7+13.0
Democratic Labor Everardus Himmelreich7,31827.3+22.8
Total formal votes26,84195.3
Informal votes1,3234.7
Turnout 28,16493.0
Labor hold Swing +1.6

Kirribilli

1973 New South Wales state election: Kirribilli [50]
PartyCandidateVotes%±%
Liberal John Waddy 13,98159.2+4.1
Labor Irene Anderson8,12434.4+4.3
Democratic Labor Margaret Colman1,5216.4-5.4
Total formal votes23,62697.5
Informal votes6092.5
Turnout 24,23584.9
Two-party-preferred result
Liberal John Waddy 15,19864.3-1.7
Labor Irene Anderson8,42835.7+1.7
Liberal hold Swing -1.7

Kogarah

1973 New South Wales state election: Kogarah [51]
PartyCandidateVotes%±%
Labor Bill Crabtree 16,25854.3-0.1
Liberal Edward Griffiths12,49741.7+2.8
Democratic Labor Harold Rich1,1954.0+4.0
Total formal votes29,95097.9
Informal votes6352.1
Turnout 30,58593.5
Two-party-preferred result
Labor Bill Crabtree 16,49755.1-3.5
Liberal Edward Griffiths13,45344.9+3.5
Labor hold Swing -3.5

Ku-ring-gai

1973 New South Wales state election: Ku-ring-gai [52]
PartyCandidateVotes%±%
Liberal John Maddison 21,35777.6
Labor Ian Cameron4,93217.9
Democratic Labor Norma Boyle1,2354.5
Total formal votes27,52498.1
Informal votes5251.9
Turnout 28,04992.6
Two-party-preferred result
Liberal John Maddison 22,34581.2+0.1
Labor Ian Cameron5,17918.8-0.1
Liberal notional  hold Swing +0.1

Ku-ring-gai was a new seat with a notional Liberal majority.

Lake Macquarie

1973 New South Wales state election: Lake Macquarie [53]
PartyCandidateVotes%±%
Labor Merv Hunter 17,35566.0+1.1
Independent Colin Fisher5,10219.4+19.4
Democratic Labor Donald Richards3,85114.6+14.6
Total formal votes26,30897.4
Informal votes7012.6
Turnout 27,00993.8
Two-candidate-preferred result
Labor Merv Hunter 19,28173.2+8.3
Independent Colin Fisher7,02726.8+26.8
Labor hold Swing +8.3

Lakemba

1973 New South Wales state election: Lakemba [54]
PartyCandidateVotes%±%
Labor Vince Durick 17,46456.9-2.5
Liberal Philip Gregory11,31336.9-3.7
Independent Douglas Morgan1,1453.7+3.7
Democratic Labor Anthony Hook7692.5+2.5
Total formal votes30,69196.5
Informal votes1,1103.5
Turnout 31,80192.3
Two-party-preferred result
Labor Vince Durick 18,32359.7+0.3
Liberal Philip Gregory12,36840.3-0.3
Labor hold Swing +0.3

Lane Cove

1973 New South Wales state election: Lane Cove [55]
PartyCandidateVotes%±%
Liberal Ken McCaw 16,68161.0+1.7
Labor Robert Toner5,36719.6-2.8
Australia Malcolm Hilbery3,54012.9+0.6
Democratic Labor Francis Hernage1,2704.6-1.5
Independent Gregory Lewis3151.2+1.2
Independent Peter Livesey1740.6+0.6
Total formal votes27,34797.5
Informal votes7062.5
Turnout 28,05390.3
Two-party-preferred result
Liberal Ken McCaw 18,95169.3+0.2
Labor Robert Toner8,39630.7-0.2
Liberal hold Swing +0.2

Lismore

1973 New South Wales state election: Lismore [56]
PartyCandidateVotes%±%
Country Bruce Duncan 15,12071.8-28.2
Labor Frederick Braid5,10524.2+24.2
Democratic Labor William Hunt5762.7+2.7
Independent William Hargrave2581.2+1.2
Total formal votes21,05998.5
Informal votes3291.5
Turnout 21,38893.1
Two-party-preferred result
Country Bruce Duncan 15,75174.8-25.2
Labor Frederick Braid5,30825.2+25.2
Country hold Swing -25.2

Liverpool

1973 New South Wales state election: Liverpool [57]
PartyCandidateVotes%±%
Labor George Paciullo 18,62266.9+0.2
Liberal Richard Lennon7,67827.6+4.2
Democratic Labor Doris Brown1,5265.5-4.4
Total formal votes27,82696.1
Informal votes1,1283.9
Turnout 28,95492.5
Two-party-preferred result
Labor George Paciullo 18,92668.0-0.7
Liberal Richard Lennon8,90032.0+0.7
Labor hold Swing -0.7

Maitland

1973 New South Wales state election: Maitland [58]
PartyCandidateVotes%±%
Liberal Milton Morris 15,29564.4+6.4
Labor George Lyons6,89429.1-6.6
Democratic Labor Reginald Hughes1,5426.5+0.2
Total formal votes23,73198.3
Informal votes4011.7
Turnout 24,13296.2
Two-party-preferred result
Liberal Milton Morris 16,51769.6+6.1
Labor George Lyons7,21430.4-6.1
Liberal hold Swing +6.1

Manly

1973 New South Wales state election: Manly [59]
PartyCandidateVotes%±%
Liberal Douglas Darby 14,23155.1-3.9
Labor Allan Hughes7,75530.0-1.8
Australia John Alexander2,91211.3+11.3
Democratic Labor Bernard Fox9403.6-3.8
Total formal votes25,83897.6
Informal votes6372.4
Turnout 26,47590.6
Two-party-preferred result
Liberal Douglas Darby 16,27863.0-2.8
Labor Allan Hughes9,56037.0+2.8
Liberal hold Swing -2.8

Maroubra

1973 New South Wales state election: Maroubra [60]
PartyCandidateVotes%±%
Labor Bill Haigh 15,42755.5-3.5
Liberal Ronald Burkitt9,63334.7+0.8
Australia Norwood Hartley1,7096.2+6.2
Democratic Labor John Martin1,0253.7-1.6
Total formal votes27,79497.0
Informal votes8623.0
Turnout 28,65691.4
Two-party-preferred result
Labor Bill Haigh 16,64959.9-1.0
Liberal Ronald Burkitt11,14540.1+1.0
Labor hold Swing -1.0

Marrickville

1973 New South Wales state election: Marrickville [61]
PartyCandidateVotes%±%
Labor Tom Cahill 17,97266.8+3.3
Liberal George Lamont7,63428.4-8.1
Democratic Labor Anthony Kiely1,3154.9+4.9
Total formal votes26,92195.1
Informal votes1,3794.9
Turnout 28,30090.0
Two-party-preferred result
Labor Tom Cahill 18,23567.7+4.2
Liberal George Lamont8,68632.3-4.2
Labor hold Swing +4.2

Merrylands

1973 New South Wales state election: Merrylands [62]
PartyCandidateVotes%±%
Labor Jack Ferguson 17,77058.1-9.1
Liberal Garry Dent11,14036.4+3.6
Australia Geoffrey Thomas1,6825.5+5.5
Total formal votes30,59296.3
Informal votes1,1603.7
Turnout 31,75292.3
Two-party-preferred result
Labor Jack Ferguson 18,94761.9-5.3
Liberal Garry Dent11,64538.1+5.3
Labor hold Swing -5.3

Miranda

1973 New South Wales state election: Miranda [63]
PartyCandidateVotes%±%
Liberal Tim Walker 14,48451.2+4.3
Labor John Brookfield10,65337.6-3.2
Australia Neva Wendt2,0837.4-0.1
Democratic Labor Bill Casey1,0853.8-0.9
Total formal votes28,30598.4
Informal votes4511.6
Turnout 28,75694.8
Two-party-preferred result
Liberal Tim Walker 15,97756.4+3.8
Labor John Brookfield12,32843.6-3.8
Liberal hold Swing +3.8

Monaro

1973 New South Wales state election: Monaro [64]
PartyCandidateVotes%±%
Liberal Steve Mauger 10,87654.2+1.0
Labor Margaret Gleeson8,42042.0-4.8
Democratic Labor Gerald O'Shaughnessy7763.9+3.9
Total formal votes20,07297.5
Informal votes5142.5
Turnout 20,58691.3
Two-party-preferred result
Liberal Steve Mauger 11,49757.3+4.1
Labor Margaret Gleeson8,57542.7-4.1
Liberal hold Swing +4.1

Mosman

1973 New South Wales state election: Mosman [65]
PartyCandidateVotes%±%
Liberal David Arblaster 17,20066.0+3.3
Australia Allan Mann6,76325.9+15.9
Democratic Labor Peter Keogh2,1128.1+0.3
Total formal votes26,07597.4
Informal votes7072.6
Turnout 26,78290.9
Two-candidate-preferred result
Liberal David Arblaster 18,25670.0-3.4
Australia Allan Mann7,81930.0+30.0
Liberal hold Swing -3.4

Mount Druitt

1973 New South Wales state election: Mount Druitt [66]
PartyCandidateVotes%±%
Labor Tony Johnson 13,42357.8-7.2
Liberal Neiven Harrison6,76529.1-5.9
Independent Patrick Chalker2,1969.5+9.5
Democratic Labor Francesco Rea8353.6+3.6
Total formal votes23,21995.9
Informal votes9914.1
Turnout 24,21091.5
Two-party-preferred result
Labor Tony Johnson 14,68863.3-1.7
Liberal Neiven Harrison8,53136.7+1.7
Labor hold Swing -1.7

Munmorah

1973 New South Wales state election: Munmorah [67]
PartyCandidateVotes%±%
Labor Harry Jensen 17,55163.5-3.0
Liberal William Jackson8,52830.8+1.7
Democratic Labor Raymond Connolly1,5705.7+1.3
Total formal votes27,64998.4
Informal votes4461.6
Turnout 28,09594.4
Two-party-preferred result
Labor Harry Jensen 17,86564.6-2.6
Liberal William Jackson9,78435.4+2.6
Labor hold Swing -2.6

Murray

1973 New South Wales state election: Murray [68]
PartyCandidateVotes%±%
Independent Bruce Jeffery 5,94234.6+34.6
Liberal Mary Meillon 5,72333.3+19.0
Labor Douglas Drew4,04523.6+23.6
Independent Gregory Graham1,0416.1+6.1
Democratic Labor Brian Maw3512.0-6.3
Independent Kevin Lowndes620.4+0.4
Total formal votes17,16496.4
Informal votes6473.6
Turnout 17,81189.5
Two-party-preferred result
Liberal Mary Meillon 11,98069.8
Labor Douglas Drew5,18430.2
Two-candidate-preferred result
Liberal Mary Meillon 9,04452.7+52.7
Independent Bruce Jeffery 8,12047.3+47.3
Liberal gain from Independent Swing N/A

Murrumbidgee

1973 New South Wales state election: Murrumbidgee [69]
PartyCandidateVotes%±%
Labor Lin Gordon 9,71249.7-4.0
Liberal Donald Mackay 5,30927.2+0.8
Country Bernardino Zappacosta4,04220.7+5.8
Democratic Labor John Hagan4652.4-2.5
Total formal votes19,52897.9
Informal votes4112.1
Turnout 19,93991.8
Two-party-preferred result
Labor Lin Gordon 10,10051.7-4.5
Liberal Donald Mackay 9,42848.3+4.5
Labor hold Swing -4.5

Nepean

1973 New South Wales state election: Nepean [70]
PartyCandidateVotes%±%
Liberal Ron Rofe 12,52647.3
Labor Kathleen Tucker 10,24038.7
Independent John Allan1,4705.6
Independent Gregory Woodward1,4355.4
Democratic Labor David Sanson6772.6
Independent Maurice Sharp1200.5
Total formal votes26,46896.4
Informal votes9763.6
Turnout 27,44492.6
Two-party-preferred result
Liberal Ron Rofe 14,09753.3+1.4
Labor Kathleen Tucker 12,37146.7-1.4
Liberal notional  hold Swing +1.4

The sitting member was Ron Mulock (Labor) however the 1973 redistribution made Gosford a notional Liberal seat and Mulock successfully contested the new seat of Penrith.

Newcastle

1973 New South Wales state election: Newcastle [71]
PartyCandidateVotes%±%
Labor Arthur Wade 15,24158.6-0.2
Liberal Richard Bevan7,99430.7-4.4
Australia Peter Baldwin1,9037.3+4.2
Democratic Labor Charin Godfrey8723.4+0.4
Total formal votes26,01097.6
Informal votes6312.4
Turnout 26,64194.0
Two-party-preferred result
Labor Arthur Wade 16,36762.9+1.3
Liberal Richard Bevan9,64337.1-1.3
Labor hold Swing +1.3

Northcott

1973 New South Wales state election: Northcott [72]
PartyCandidateVotes%±%
Liberal Jim Cameron 18,68665.4-1.7
Australia Vivienne Berzin6,82923.9+2.7
Democratic Labor Michael Kane2,4498.6+8.6
Republican Franciscus Leechburch-Auwers6162.2+2.2
Total formal votes28,58097.2
Informal votes8302.8
Turnout 29,41093.2
Two-candidate-preferred result
Liberal Jim Cameron 20,21970.4-2.6
Australia Vivienne Berzin8,36129.6+2.6
Liberal hold Swing -2.6

Orange

1973 New South Wales state election: Orange [73]
PartyCandidateVotes%±%
Country Charles Cutler 14,59665.8+12.4
Labor Joseph Ryan6,38728.8-3.5
Democratic Labor Robert Hansen1,2025.4-0.4
Total formal votes22,18598.5
Informal votes3371.5
Turnout 22,52294.5
Two-party-preferred result
Country Charles Cutler 15,55870.1+8.6
Labor Joseph Ryan6,62729.9-8.6
Country hold Swing +8.6

Oxley

1973 New South Wales state election: Oxley [74]
PartyCandidateVotes%±%
Country Bruce Cowan 15,02070.1-6.7
Labor Bruce Langford5,77226.9+26.9
Democratic Labor Gary Phillips6302.9+2.9
Total formal votes21,42298.7
Informal votes2871.3
Turnout 21,70995.5
Two-party-preferred result
Country Bruce Cowan 15,55872.6-4.2
Labor Bruce Langford6,62727.4+27.4
Country hold Swing -4.2

Parramatta

1973 New South Wales state election: Parramatta [75]
PartyCandidateVotes%±%
Labor Dan Mahoney 16,52455.6-1.6
Liberal Hilton Robinson11,71939.5-0.3
Democratic Labor Mary Woodbury1,4644.9+4.9
Total formal votes29,70797.9
Informal votes6432.1
Turnout 30,35090.4
Two-party-preferred result
Labor Dan Mahoney 16,81756.6-3.1
Liberal Hilton Robinson12,89043.4+3.1
Labor hold Swing -3.1

Peats

1973 New South Wales state election: Peats [76]
PartyCandidateVotes%±%
Labor Keith O'Connell 15,94857.3-1.5
Liberal Graeme Hallett11,88642.7+1.5
Total formal votes27,83497.8
Informal votes6172.2
Turnout 28,45193.4
Labor notional  hold Swing -1.5

Peats was a new seat with a notional Labor majority.

Penrith

1973 New South Wales state election: Penrith [77]
PartyCandidateVotes%±%
Labor Ron Mulock 15,63456.6
Liberal Eileen Cammack10,62338.5
Independent Joseph Stein1,3695.0
Total formal votes27,62697.1
Informal votes8132.9
Turnout 28,43991.5
Two-party-preferred result
Labor Ron Mulock 16,54759.9+0.8
Liberal Eileen Cammack11,07940.1-0.8
Labor notional  hold Swing +0.8

Penrith was a new seat with a notional Labor majority.

Phillip

1973 New South Wales state election: Phillip [78]
PartyCandidateVotes%±%
Labor Pat Hills 16,52365.5-6.6
Liberal Walter O'Donoghue4,59418.2-1.3
Australia Jennifer Baker1,8317.3+7.3
Democratic Labor Kristina Aster-Stater1,0074.0-4.4
Communist Joseph Owens8383.3+3.3
Independent John Hawkins4361.7+1.7
Total formal votes25,22994.3
Informal votes1,5145.7
Turnout 26,74383.9
Two-party-preferred result
Labor Pat Hills 18,90074.9+1.1
Liberal Walter O'Donoghue6,32925.1-1.1
Labor hold Swing +1.1

Pittwater

1973 New South Wales state election: Pittwater [79]
PartyCandidateVotes%±%
Liberal Robert Askin 15,52264.0+2.0
Labor Dorothy Jeffery7,14429.5+29.5
Democratic Labor Kevin Lee1,5836.5+0.3
Total formal votes24,24997.6
Informal votes6072.4
Turnout 24,85690.6
Two-party-preferred result
Liberal Robert Askin 16,78869.2-1.4
Labor Dorothy Jeffery7,46130.8+1.4
Liberal notional  hold Swing -1.4

Pittwater was a new seat with a notional Liberal majority.

Raleigh

1973 New South Wales state election: Raleigh [80]
PartyCandidateVotes%±%
Country Jim Brown 14,34768.4+8.0
Labor Ken Reed 6,61331.6+0.8
Total formal votes20,96098.5
Informal votes3091.5
Turnout 21,26994.5
Country hold Swing +2.9

Rockdale

1973 New South Wales state election: Rockdale [81]
PartyCandidateVotes%±%
Labor Brian Bannon 16,82662.7
Liberal Kenneth Gates9,05633.7
Democratic Labor Alan Lewis9683.6
Total formal votes26,85096.3
Informal votes1,0193.7
Turnout 27,86993.5
Two-party-preferred result
Labor Brian Bannon 17,02063.40.0
Liberal Kenneth Gates9,83036.60.0
Labor hold Swing 0.0

South Coast

1973 New South Wales state election: South Coast [82]
PartyCandidateVotes%±%
Independent John Hatton 10,42144.7-4.4
Liberal Doug Otton8,26435.5-15.4
Country Alexander Cochrane1,5026.5+6.5
Independent Robert Coburn1,4406.2+6.2
Country Basil Emery1,2895.5+5.5
Independent Robert Burke3811.6+1.6
Total formal votes23,29796.8
Informal votes7643.2
Turnout 24,06193.1
Two-candidate-preferred result
Independent John Hatton 12,04851.7+2.6
Liberal Doug Otton11,24948.3-2.6
Independent gain from Liberal Swing +2.6

The sitting member Jack Beale (Liberal) resigned from Parliament in October 1973. [82]

Sturt

1973 New South Wales state election: Sturt [83]
PartyCandidateVotes%±%
Country Tim Fischer 13,01267.6+28.1
Labor John Foley5,25927.3+27.3
Democratic Labor Joseph Lenehan9625.0-3.8
Total formal votes19,23398.8
Informal votes2401.2
Turnout 19,47393.7
Two-party-preferred result
Country Tim Fischer 13,78271.7+7.4
Labor John Foley5,45428.3+28.3
Country hold Swing +7.4

Tamworth

1973 New South Wales state election: Tamworth [84]
PartyCandidateVotes%±%
Country Noel Park 7,88435.9-6.9
Liberal Neil Roberts5,90226.9+26.9
Labor William Forrest3,88817.7-17.3
Labor William Bischoff2,95913.5+13.5
Australia Joan Byrne5592.6+2.6
Independent Leonard Hill4672.1+2.1
Democratic Labor Peter Young3041.4+1.4
Total formal votes21,96395.9
Informal votes9434.1
Turnout 22,90694.0
Two-party-preferred result
Country Noel Park 13,97563.6+5.5
Labor William Forrest7,98836.4-5.5
Country hold Swing +5.5

Temora

1973 New South Wales state election: Temora [85]
PartyCandidateVotes%±%
Country Jim Taylor 11,17164.2+12.7
Labor Alroy Provan4,52026.0-11.4
Democratic Labor Terence Brady9595.5+5.5
Independent Donald Douglas7604.4+4.4
Total formal votes17,41099.0
Informal votes1701.0
Turnout 17,58088.5
Two-party-preferred result
Country Jim Taylor 12,27470.5+13.5
Labor Alroy Provan5,13629.5-13.5
Country hold Swing +13.5

Tenterfield

1973 New South Wales state election: Tenterfield [86]
PartyCandidateVotes%±%
Country Tim Bruxner 13,00568.6+12.1
Labor Alice Clifford5,94431.4-7.8
Total formal votes18,94998.8
Informal votes2341.2
Turnout 19,18391.7
Country hold Swing +9.9

The Hills

1973 New South Wales state election: The Hills [87]
PartyCandidateVotes%±%
Liberal Max Ruddock 16,98866.4+6.0
Labor Judith Mackinolty7,37628.8-3.1
Democratic Labor John Woulfe1,2254.8-2.8
Total formal votes25,58998.4
Informal votes4181.6
Turnout 26,00795.0
Two-party-preferred result
Liberal Max Ruddock 17,96870.2+3.7
Labor Judith Mackinolty7,62129.8-3.7
Liberal hold Swing +3.7

Upper Hunter

1973 New South Wales state election: Upper Hunter [88]
PartyCandidateVotes%±%
Country Col Fisher 14,41361.2+4.6
Labor Kenneth Cosgrove8,36035.5-7.9
Democratic Labor Kathleen Buckingham7113.3+3.3
Total formal votes23,54498.8
Informal votes2771.2
Turnout 23,82195.2
Two-party-preferred result
Country Col Fisher 15,03063.8+7.2
Labor Kenneth Cosgrove8,51436.2-7.2
Country hold Swing +7.2

Vaucluse

1973 New South Wales state election: Vaucluse [89]
PartyCandidateVotes%±%
Liberal Keith Doyle 15,90663.1-1.1
Australia Brian Hickey6,40325.4+25.4
Democratic Labor Doris Anderson2,90111.5+11.5
Total formal votes25,21094.5
Informal votes1,4635.5
Turnout 26,67388.0
Two-candidate-preferred result
Liberal Keith Doyle 17,35768.8+0.3
Australia Brian Hickey7,85331.2+31.2
Liberal hold Swing +0.3

Wagga Wagga

1973 New South Wales state election: Wagga Wagga [90]
PartyCandidateVotes%±%
Liberal Wal Fife 13,10563.6+2.7
Labor Kenneth Fletcher5,42926.4-3.9
Democratic Labor Kevin Murphy1,0885.3-3.5
Australia Pamela Osmond9854.8+4.8
Total formal votes20,60798.5
Informal votes3151.5
Turnout 20,92292.2
Two-party-preferred result
Liberal Wal Fife 14,36969.7+1.7
Labor Kenneth Fletcher6,23830.3-1.7
Liberal hold Swing +1.7

Wakehurst

1973 New South Wales state election: Wakehurst [91]
PartyCandidateVotes%±%
Liberal Allan Viney 14,87653.4-0.9
Labor Colin McIlwraith8,80131.6-7.0
Australia Pamela Wilson2,7709.9+9.9
Democratic Labor Terrence Fay1,4125.1-2.0
Total formal votes27,85997.3
Informal votes7822.7
Turnout 28,64190.4
Two-party-preferred result
Liberal Allan Viney 17,11461.4+1.4
Labor Colin McIlwraith10,74538.6-1.4
Liberal hold Swing +1.4

Wallsend

1973 New South Wales state election: Wallsend [92]
PartyCandidateVotes%±%
Labor Ken Booth 22,60271.3+2.6
Democratic Labor Robert Godfrey5,82118.4+14.9
Australia Desmond Kynaston3,27310.3+10.3
Total formal votes31,69696.8
Informal votes1,0443.2
Turnout 32,74095.7
Two-candidate-preferred result
Labor Ken Booth 24,23976.5+7.1
Democratic Labor Robert Godfrey7,45723.5+23.5
Labor hold Swing +7.1

Waratah

1973 New South Wales state election: Waratah [93]
PartyCandidateVotes%±%
Labor Sam Jones 21,15872.4+3.8
Democratic Labor Anne McCosker5,60019.2+19.2
Independent George Wawryck2,4538.4+8.4
Total formal votes29,21197.0
Informal votes9103.0
Turnout 30,12194.9
Two-candidate-preferred result
Labor Sam Jones 22,38576.6+8.0
Democratic Labor Anne McCosker6,82623.4+23.4
Labor hold Swing +8.0

Waverley

1973 New South Wales state election: Waverley [94]
PartyCandidateVotes%±%
Labor Syd Einfeld 12,06551.1-7.5
Liberal Hans Dreyer9,03138.2-3.2
Australia Virginia Walker1,5866.7+6.7
Democratic Labor Dominique Droulers6042.6+2.6
Independent Martin Smith3411.4+1.4
Total formal votes23,62795.7
Informal votes1,0554.3
Turnout 24,68286.5
Two-party-preferred result
Labor Syd Einfeld 13,32256.4-2.2
Liberal Hans Dreyer10,30543.6+2.2
Labor hold Swing -2.2

Wentworthville

1973 New South Wales state election: Wentworthville [95]
PartyCandidateVotes%±%
Labor Ernie Quinn 16,68655.5-5.3
Liberal Edward Roberts11,13337.0-2.2
Independent Ian Purdie2,2677.5+7.5
Total formal votes30,08696.8
Informal votes9843.2
Turnout 31,07092.9
Two-party-preferred result
Labor Ernie Quinn 18,08060.1-0.7
Liberal Edward Roberts12,00639.9+0.7
Labor hold Swing -0.7

Willoughby

1973 New South Wales state election: Willoughby [96]
PartyCandidateVotes%±%
Liberal Laurie McGinty 16,32261.1+4.5
Labor Alwynne Pengelly6,47124.2-3.9
Australia Mary McNish 2,5749.6+1.4
Democratic Labor Reginald Lawson1,3335.0+1.4
Total formal votes26,70097.4
Informal votes7232.6
Turnout 27,42390.5
Two-party-preferred result
Liberal Laurie McGinty 18,50069.3+4.5
Labor Alwynne Pengelly8,20030.7-4.5
Liberal hold Swing +4.5

Wollondilly

1973 New South Wales state election: Wollondilly [97]
PartyCandidateVotes%±%
Liberal Tom Lewis 13,42655.3-0.4
Labor Bill Knott 7,58231.2-5.0
Independent Dianne Allen1,7147.1+7.1
Australia Jill Kerr1,0074.2+4.2
Democratic Labor Bernard McRae5542.3-1.8
Total formal votes24,28398.3
Informal votes4151.7
Turnout 24,69892.3
Two-party-preferred result
Liberal Tom Lewis 15,05562.0+1.0
Labor Bill Knott 9,22838.0-1.0
Liberal hold Swing +1.0

Wollongong

1973 New South Wales state election: Wollongong [98]
PartyCandidateVotes%±%
Labor Eric Ramsay 17,02261.8
Liberal Ian Brown9,61334.9
Democratic Labor Raymond Proust9243.4
Total formal votes27,55996.2
Informal votes1,0903.8
Turnout 28,64992.6
Two-party-preferred result
Labor Eric Ramsay 17,20762.4+3.6
Liberal Ian Brown10,35237.6-3.6
Labor hold Swing +3.6

Woronora

1973 New South Wales state election: Woronora [99]
PartyCandidateVotes%±%
Labor Maurie Keane 12,74745.6
Liberal Evelyn Thompson10,26136.7
Independent Jean Manuel2,81610.1
Independent Walter Skarschewski1,3374.8
Democratic Labor William Goslett8012.9
Total formal votes27,96297.3
Informal votes7612.7
Turnout 28,72392.3
Two-party-preferred result
Labor Maurie Keane 14,58652.2-3.5
Liberal Evelyn Thompson13,37647.8+3.5
Labor hold Swing -3.5

Yaralla

1973 New South Wales state election: Yaralla [100]
PartyCandidateVotes%±%
Liberal Lerryn Mutton 14,92453.8+3.0
Labor Derek Margerison10,70338.6-3.5
Democratic Labor Terence McCormack2,1077.6+0.5
Total formal votes27,73497.7
Informal votes6522.3
Turnout 28,38691.1
Two-party-preferred result
Liberal Lerryn Mutton 16,59059.8+3.6
Labor Derek Margerison11,14440.2-3.6
Liberal hold Swing +3.6

Young

1973 New South Wales state election: Young [101]
PartyCandidateVotes%±%
Country George Freudenstein 11,67157.4+9.0
Labor Kenneth Gunn7,88738.8-6.1
Democratic Labor John Hawkins7643.8-2.9
Total formal votes20,32299.2
Informal votes1610.8
Turnout 20,48395.1
Two-party-preferred result
Country George Freudenstein 12,28260.4+6.6
Labor Kenneth Gunn8,04039.6-6.6
Country hold Swing +6.6

See also

Notes

  1. There were 2,788,733 enrolled voters but 20,857 were enrolled in Broken Hill (Labor) which was uncontested at the election. [1]

Related Research Articles

<span class="mw-page-title-main">Electoral district of Penrith</span>

Penrith is an electoral district of the Legislative Assembly in the Australian state of New South Wales since 1973. It is represented by Karen McKeown of the Labor Party. It has been traditionally a safe Labor seat for most of its history but has had times where it has fallen to the Liberal Party.

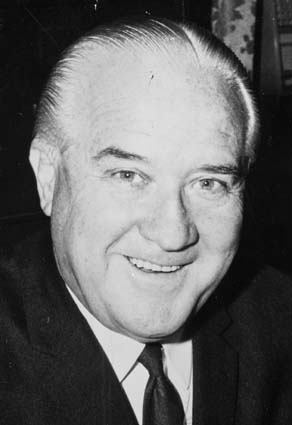
Ronald Ernest Arthur Rofe was an Australian politician and member of the New South Wales Legislative Assembly from 1973 until 1978. He was a member of the Liberal Party.

<span class="mw-page-title-main">1973 New South Wales state election</span> State election for New South Wales, Australia in November 1973

Elections for the New South Wales Legislative Assembly were held in the state of New South Wales, Australia, on Saturday 17 November 1973. The result was a win for the Liberal-Country Party coalition under Sir Robert Askin, which had been in office since 1965. As of 2023, this was the first and only time the Coalition won a fourth-term in New South Wales.

Alfred Ernest Bennett was an Australian politician. He was a Labor Party member of the New South Wales Legislative Assembly from 1962 to 1965, representing the electorate of Nepean.

Keith O'Connell was an Australian politician. He was a Labor member of the New South Wales Legislative Assembly from 1971 to 1984, representing Gosford until 1973 and Peats thereafter.

Annandale, an electoral district of the Legislative Assembly in the Australian state of New South Wales, had two incarnations, the first from 1894 to 1920, the second from 1927 to 1950.

Drummoyne, an electoral district of the Legislative Assembly in the Australian state of New South Wales, has had two incarnations, the first from 1913 to 1920, the second from 1927 to the present.

Willoughby, an electoral district of the Legislative Assembly in the Australian state of New South Wales. The district has had four incarnations, the first from 1894 to 1904, the second from 1913 to 1920, the third from 1927 to 1988, and the fourth from 1991 to the present.

Gosford, an electoral district of the Legislative Assembly in the Australian state of New South Wales, has existed from 1950 to the present.

Penrith, an electoral district of the Legislative Assembly in the Australian state of New South Wales, was created in 1973.

Bligh, an electoral district of the Legislative Assembly in the Australian state of New South Wales was created in 1962 and abolished in 2007.

Peats, an electoral district of the Legislative Assembly in the Australian state of New South Wales, existed from 1973 until its abolition in 2007 and was always held by the Labor party.

This is a list of electoral district results for the 1991 New South Wales state election.

The 1981 New South Wales state election involved 99 electoral districts returning one member each. The election was conducted on the basis of optional preferential voting system. There was a significant change from the 1978 election as a result of the passage of the Parliamentary Electorates and Elections (Amendment) Act 1979, and the Constitution (Amendment) Act 1979. The effect of these Acts was to end the electoral malapportionment requiring that the number of electors within each electoral district be within 10%. Under the previous zoning system, a seat in the "central area" had a quota of 34,067, but could be as high as 40,880 while a "country area" seat had a quota of 26,016 but could be as low as 20,813. The effect of the 1980 redistribution was to create 6 new seats in Sydney Newcastle and Wollongong and abolishing 6 country seats.

This is a list of electoral district results for the 1962 New South Wales state election.

This is a list of electoral district results for the 1950 New South Wales state election.

Castlereagh, an electoral district of the Legislative Assembly in the Australian state of New South Wales had two incarnations, from 1904 until 1920 and from 1927 until 1991.

Kirribilli, an electoral district of the Legislative Assembly in the Australian state of New South Wales, was created in 1962 and abolished in 1981.

St Marys, an electoral district of the Legislative Assembly in the Australian state of New South Wales had two incarnations, from 1981 to 1988 and from 1991 to 1999.

Nepean, an electoral district of the Legislative Assembly in the Australian state of New South Wales, had two incarnations, from 1859 to 1904 and from 1927 to 1981.

References

  1. 1 2 3 Green, Antony. "1973 election totals". New South Wales Election Results 1856-2007. Parliament of New South Wales . Retrieved 13 August 2019.
  2. Hughes, Colin A. (1977). A handbook of Australian government and politics, 1965-1974. ANU Press. p.  108. ISBN   978-0-7081-1340-0.
  3. Green, Antony. "1973 Albury". New South Wales Election Results 1856-2007. Parliament of New South Wales . Retrieved 4 May 2020.
  4. Green, Antony. "1973 Armidale". New South Wales Election Results 1856-2007. Parliament of New South Wales . Retrieved 4 May 2020.
  5. Green, Antony. "1973 Ashfield". New South Wales Election Results 1856-2007. Parliament of New South Wales . Retrieved 4 May 2020.
  6. Green, Antony. "1973 Auburn". New South Wales Election Results 1856-2007. Parliament of New South Wales . Retrieved 4 May 2020.
  7. Green, Antony. "1973 Balmain". New South Wales Election Results 1856-2007. Parliament of New South Wales . Retrieved 4 May 2020.
  8. Green, Antony. "1973 Bankstown". New South Wales Election Results 1856-2007. Parliament of New South Wales . Retrieved 4 May 2020.
  9. Green, Antony. "1973 Barwon". New South Wales Election Results 1856-2007. Parliament of New South Wales . Retrieved 4 May 2020.
  10. Green, Antony. "1973 Bass Hill". New South Wales Election Results 1856-2007. Parliament of New South Wales . Retrieved 4 May 2020.
  11. Green, Antony. "1973 Bathurst". New South Wales Election Results 1856-2007. Parliament of New South Wales . Retrieved 4 May 2020.
  12. Green, Antony. "1973 Blacktown". New South Wales Election Results 1856-2007. Parliament of New South Wales . Retrieved 4 May 2020.
  13. Green, Antony. "1973 Bligh". New South Wales Election Results 1856-2007. Parliament of New South Wales . Retrieved 4 May 2020.
  14. Green, Antony. "1973 Blue Mountains". New South Wales Election Results 1856-2007. Parliament of New South Wales . Retrieved 4 May 2020.
  15. Green, Antony. "1973 Broken Hill". New South Wales Election Results 1856-2007. Parliament of New South Wales . Retrieved 4 May 2020.
  16. Green, Antony. "1973 Burrendong". New South Wales Election Results 1856-2007. Parliament of New South Wales . Retrieved 4 May 2020.
  17. Green, Antony. "1973 Burrinjuck". New South Wales Election Results 1856-2007. Parliament of New South Wales . Retrieved 4 May 2020.
  18. Green, Antony. "1973 Burwood". New South Wales Election Results 1856-2007. Parliament of New South Wales . Retrieved 4 May 2020.
  19. Green, Antony. "1973 Byron". New South Wales Election Results 1856-2007. Parliament of New South Wales . Retrieved 4 May 2020.
  20. Green, Antony. "1973 Campbelltown". New South Wales Election Results 1856-2007. Parliament of New South Wales . Retrieved 4 May 2020.
  21. Green, Antony. "1973 Canterbury". New South Wales Election Results 1856-2007. Parliament of New South Wales . Retrieved 4 May 2020.
  22. Green, Antony. "1973 Casino". New South Wales Election Results 1856-2007. Parliament of New South Wales . Retrieved 4 May 2020.
  23. Green, Antony. "1973 Castlereagh". New South Wales Election Results 1856-2007. Parliament of New South Wales . Retrieved 4 May 2020.
  24. Green, Antony. "1973 Cessnock". New South Wales Election Results 1856-2007. Parliament of New South Wales . Retrieved 4 May 2020.
  25. Green, Antony. "1973 Charlestown". New South Wales Election Results 1856-2007. Parliament of New South Wales . Retrieved 4 May 2020.
  26. Green, Antony. "1973 Clarence". New South Wales Election Results 1856-2007. Parliament of New South Wales . Retrieved 4 May 2020.
  27. Green, Antony. "1973 Coogee". New South Wales Election Results 1856-2007. Parliament of New South Wales . Retrieved 4 May 2020.
  28. Green, Antony. "1973 Corrimal". New South Wales Election Results 1856-2007. Parliament of New South Wales . Retrieved 4 May 2020.
  29. Green, Antony. "1973 Cronulla". New South Wales Election Results 1856-2007. Parliament of New South Wales . Retrieved 4 May 2020.
  30. Green, Antony. "1973 Davidson". New South Wales Election Results 1856-2007. Parliament of New South Wales . Retrieved 4 May 2020.
  31. Green, Antony. "1973 Drummoyne". New South Wales Election Results 1856-2007. Parliament of New South Wales . Retrieved 4 May 2020.
  32. Green, Antony. "1973 Dubbo". New South Wales Election Results 1856-2007. Parliament of New South Wales . Retrieved 4 May 2020.
  33. Green, Antony. "1973 Earlwood". New South Wales Election Results 1856-2007. Parliament of New South Wales . Retrieved 4 May 2020.
  34. Green, Antony. "1973 East Hills". New South Wales Election Results 1856-2007. Parliament of New South Wales . Retrieved 4 May 2020.
  35. Green, Antony. "1973 Eastwood". New South Wales Election Results 1856-2007. Parliament of New South Wales . Retrieved 4 May 2020.
  36. Green, Antony. "1973 Fairfield". New South Wales Election Results 1856-2007. Parliament of New South Wales . Retrieved 4 May 2020.
  37. Green, Antony. "1973 Fuller". New South Wales Election Results 1856-2007. Parliament of New South Wales . Retrieved 4 May 2020.
  38. Green, Antony. "1973 Georges River". New South Wales Election Results 1856-2007. Parliament of New South Wales . Retrieved 4 May 2020.
  39. Green, Antony. "1973 Gloucester". New South Wales Election Results 1856-2007. Parliament of New South Wales . Retrieved 4 May 2020.
  40. 1 2 Green, Antony. "1973 Gordon". New South Wales Election Results 1856-2007. Parliament of New South Wales . Retrieved 4 May 2020.
  41. Green, Antony. "1973 Gosford". New South Wales Election Results 1856-2007. Parliament of New South Wales . Retrieved 4 May 2020.
  42. Green, Antony. "1973 Goulburn". New South Wales Election Results 1856-2007. Parliament of New South Wales . Retrieved 4 May 2020.
  43. Green, Antony. "1973 Granville". New South Wales Election Results 1856-2007. Parliament of New South Wales . Retrieved 4 May 2020.
  44. Green, Antony. "1973 Hawkesbury". New South Wales Election Results 1856-2007. Parliament of New South Wales . Retrieved 4 May 2020.
  45. Green, Antony. "1973 Heathcote". New South Wales Election Results 1856-2007. Parliament of New South Wales . Retrieved 4 May 2020.
  46. Green, Antony. "1973 Heffron". New South Wales Election Results 1856-2007. Parliament of New South Wales . Retrieved 4 May 2020.
  47. Green, Antony. "1973 Hornsby". New South Wales Election Results 1856-2007. Parliament of New South Wales . Retrieved 4 May 2020.
  48. Green, Antony. "1973 Hurstville". New South Wales Election Results 1856-2007. Parliament of New South Wales . Retrieved 4 May 2020.
  49. Green, Antony. "1973 Illawarra". New South Wales Election Results 1856-2007. Parliament of New South Wales . Retrieved 4 May 2020.
  50. Green, Antony. "1973 Kirribilli". New South Wales Election Results 1856-2007. Parliament of New South Wales . Retrieved 4 May 2020.
  51. Green, Antony. "1973 Kogarah". New South Wales Election Results 1856-2007. Parliament of New South Wales . Retrieved 4 May 2020.
  52. Green, Antony. "1973 Kuringgai". New South Wales Election Results 1856-2007. Parliament of New South Wales . Retrieved 4 May 2020.
  53. Green, Antony. "1973 Lake Macquarie". New South Wales Election Results 1856-2007. Parliament of New South Wales . Retrieved 4 May 2020.
  54. Green, Antony. "1973 Lakemba". New South Wales Election Results 1856-2007. Parliament of New South Wales . Retrieved 4 May 2020.
  55. Green, Antony. "1973 Lane Cove". New South Wales Election Results 1856-2007. Parliament of New South Wales . Retrieved 4 May 2020.
  56. Green, Antony. "1973 Lismore". New South Wales Election Results 1856-2007. Parliament of New South Wales . Retrieved 4 May 2020.
  57. Green, Antony. "1973 Liverpool". New South Wales Election Results 1856-2007. Parliament of New South Wales . Retrieved 4 May 2020.
  58. Green, Antony. "1973 Maitland". New South Wales Election Results 1856-2007. Parliament of New South Wales . Retrieved 4 May 2020.
  59. Green, Antony. "1973 Manly". New South Wales Election Results 1856-2007. Parliament of New South Wales . Retrieved 4 May 2020.
  60. Green, Antony. "1973 Maroubra". New South Wales Election Results 1856-2007. Parliament of New South Wales . Retrieved 4 May 2020.
  61. Green, Antony. "1973 Marrickville". New South Wales Election Results 1856-2007. Parliament of New South Wales . Retrieved 4 May 2020.
  62. Green, Antony. "1973 Merrylands". New South Wales Election Results 1856-2007. Parliament of New South Wales . Retrieved 4 May 2020.
  63. Green, Antony. "1973 Miranda". New South Wales Election Results 1856-2007. Parliament of New South Wales . Retrieved 4 May 2020.
  64. Green, Antony. "1973 Monaro". New South Wales Election Results 1856-2007. Parliament of New South Wales . Retrieved 4 May 2020.
  65. Green, Antony. "1973 Mosman". New South Wales Election Results 1856-2007. Parliament of New South Wales . Retrieved 4 May 2020.
  66. Green, Antony. "1973 Mount Druitt". New South Wales Election Results 1856-2007. Parliament of New South Wales . Retrieved 4 May 2020.
  67. Green, Antony. "1973 Munmorah". New South Wales Election Results 1856-2007. Parliament of New South Wales . Retrieved 4 May 2020.
  68. Green, Antony. "1973 Murray". New South Wales Election Results 1856-2007. Parliament of New South Wales . Retrieved 4 May 2020.
  69. Green, Antony. "1973 Murrumbidgee". New South Wales Election Results 1856-2007. Parliament of New South Wales . Retrieved 4 May 2020.
  70. Green, Antony. "1973 Nepean". New South Wales Election Results 1856-2007. Parliament of New South Wales . Retrieved 4 May 2020.
  71. Green, Antony. "1973 Newcastle". New South Wales Election Results 1856-2007. Parliament of New South Wales . Retrieved 4 May 2020.
  72. Green, Antony. "1973 Northcott". New South Wales Election Results 1856-2007. Parliament of New South Wales . Retrieved 4 May 2020.
  73. Green, Antony. "1973 Orange". New South Wales Election Results 1856-2007. Parliament of New South Wales . Retrieved 4 May 2020.
  74. Green, Antony. "1973 Oxley". New South Wales Election Results 1856-2007. Parliament of New South Wales . Retrieved 4 May 2020.
  75. Green, Antony. "1973 Parramatta". New South Wales Election Results 1856-2007. Parliament of New South Wales . Retrieved 4 May 2020.
  76. Green, Antony. "1973 Peats". New South Wales Election Results 1856-2007. Parliament of New South Wales . Retrieved 4 May 2020.
  77. Green, Antony. "1973 Penrith". New South Wales Election Results 1856-2007. Parliament of New South Wales . Retrieved 4 May 2020.
  78. Green, Antony. "1973 Phillip". New South Wales Election Results 1856-2007. Parliament of New South Wales . Retrieved 4 May 2020.
  79. Green, Antony. "1973 Pittwater". New South Wales Election Results 1856-2007. Parliament of New South Wales . Retrieved 4 May 2020.
  80. Green, Antony. "1973 Raleigh". New South Wales Election Results 1856-2007. Parliament of New South Wales . Retrieved 4 May 2020.
  81. Green, Antony. "1973 Rockdale". New South Wales Election Results 1856-2007. Parliament of New South Wales . Retrieved 4 May 2020.
  82. 1 2 Green, Antony. "1973 South Coast". New South Wales Election Results 1856-2007. Parliament of New South Wales . Retrieved 4 May 2020.
  83. Green, Antony. "1973 Sturt". New South Wales Election Results 1856-2007. Parliament of New South Wales . Retrieved 4 May 2020.
  84. Green, Antony. "1973 Tamworth". New South Wales Election Results 1856-2007. Parliament of New South Wales . Retrieved 4 May 2020.
  85. Green, Antony. "1973 Temora". New South Wales Election Results 1856-2007. Parliament of New South Wales . Retrieved 4 May 2020.
  86. Green, Antony. "1973 Tenterfield". New South Wales Election Results 1856-2007. Parliament of New South Wales . Retrieved 4 May 2020.
  87. Green, Antony. "1973 The Hills". New South Wales Election Results 1856-2007. Parliament of New South Wales . Retrieved 4 May 2020.
  88. Green, Antony. "1973 Upper Hunter". New South Wales Election Results 1856-2007. Parliament of New South Wales . Retrieved 4 May 2020.
  89. Green, Antony. "1973 Vaucluse". New South Wales Election Results 1856-2007. Parliament of New South Wales . Retrieved 4 May 2020.
  90. Green, Antony. "1973 Wagga Wagga". New South Wales Election Results 1856-2007. Parliament of New South Wales . Retrieved 4 May 2020.
  91. Green, Antony. "1973 Wakehurst". New South Wales Election Results 1856-2007. Parliament of New South Wales . Retrieved 4 May 2020.
  92. Green, Antony. "1973 Wallsend". New South Wales Election Results 1856-2007. Parliament of New South Wales . Retrieved 4 May 2020.
  93. Green, Antony. "1973 Waratah". New South Wales Election Results 1856-2007. Parliament of New South Wales . Retrieved 4 May 2020.
  94. Green, Antony. "1973 Waverley". New South Wales Election Results 1856-2007. Parliament of New South Wales . Retrieved 4 May 2020.
  95. Green, Antony. "1973 Wentworthville". New South Wales Election Results 1856-2007. Parliament of New South Wales . Retrieved 4 May 2020.
  96. Green, Antony. "1973 Willoughby". New South Wales Election Results 1856-2007. Parliament of New South Wales . Retrieved 4 May 2020.
  97. Green, Antony. "1973 Wollondilly". New South Wales Election Results 1856-2007. Parliament of New South Wales . Retrieved 4 May 2020.
  98. Green, Antony. "1973 Wollongong". New South Wales Election Results 1856-2007. Parliament of New South Wales . Retrieved 4 May 2020.
  99. Green, Antony. "1973 Woronora". New South Wales Election Results 1856-2007. Parliament of New South Wales . Retrieved 4 May 2020.
  100. Green, Antony. "1973 Yaralla". New South Wales Election Results 1856-2007. Parliament of New South Wales . Retrieved 4 May 2020.
  101. Green, Antony. "1973 Young". New South Wales Election Results 1856-2007. Parliament of New South Wales . Retrieved 4 May 2020.