Tabogon Last updated February 01, 2026 Municipality in Cebu, Philippines
Municipality in Central Visayas, Philippines
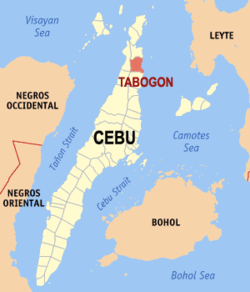
Tabogon , officially the Municipality of Tabogon (Cebuano : Lungsod sa Tabogon Tagalog : Bayan ng Tabogon municipality in the province of Cebu , Philippines . According to the 2024 census, it has a population of 42,066 people. [ 5]
Etymology Tabogon may come from the archaic Visayan word tabog , which means "busy", in reference to the bustling farm fields that dotted this place during the olden times; hence tabogon would mean a busy place of work. [ 6]
Geography Tabogon is bordered on the north by the city of Bogo , to the west by the town of San Remigio , on the east by the Camotes Sea , and on the south by the town of Borbon .
Barangays Tabogon is politically subdivided into 25 barangays. Each barangay consists of puroks and some have sitios .
PSGC Barangay Population ±% p.a. 2024 [ 7] 2010 [ 8] 072248001 Alang‑ alang 1.7% 731 664 ▴ 0.70% 072248002 Caduawan 6.6% 2,786 2,221 ▴ 1.66% 072248004 Camoboan 4.4% 1,842 1,490 ▴ 1.55% 072248005 Canaocanao 4.4% 1,861 1,693 ▴ 0.69% 072248006 Combado 1.5% 617 418 ▴ 2.87% 072248007 Daantabogon 2.9% 1,229 1,413 ▾ −1.01% 072248008 Ilihan 10.1% 4,262 3,280 ▴ 1.92% 072248003 Kal‑ anan 1.9% 815 851 ▾ −0.31% 072248009 Labangon 4.6% 1,952 1,752 ▴ 0.79% 072248010 Libjo 6.5% 2,736 2,338 ▴ 1.15% 072248011 Loong 2.9% 1,211 1,080 ▴ 0.84% 072248012 Mabuli 4.1% 1,713 1,538 ▴ 0.79% 072248013 Managase 3.5% 1,467 1,225 ▴ 1.32% 072248014 Manlagtang 3.1% 1,299 1,192 ▴ 0.63% 072248015 Maslog 2.9% 1,239 1,094 ▴ 0.91% 072248016 Muabog 5.5% 2,330 2,042 ▴ 0.96% 072248017 Pio 1.9% 814 686 ▴ 1.25% 072248018 Poblacion 3.3% 1,387 1,228 ▴ 0.89% 072248019 Salag 3.5% 1,474 1,084 ▴ 2.26% 072248020 Sambag 2.1% 899 746 ▴ 1.37% 072248021 San Isidro 1.6% 669 616 ▴ 0.60% 072248022 San Vicente 1.9% 820 562 ▴ 2.78% 072248023 Somosa 5.7% 2,406 1,830 ▴ 2.01% 072248024 Taba‑ ao 2.8% 1,177 1,003 ▴ 1.17% 072248025 Tapul 3.0% 1,277 978 ▴ 1.96% Total 42,066 33,024 ▴ 1.77%
Climate Climate data for Tabogon, Cebu Month Jan Feb Mar Apr May Jun Jul Aug Sep Oct Nov Dec Year Mean daily maximum °C (°F) 28 29 29 30 30 30 29 29 29 29 29 29 29 Mean daily minimum °C (°F) 22 22 22 23 25 25 25 25 25 24 24 23 24 Average precipitation mm (inches) 78 57 84 79 118 181 178 169 172 180 174 128 1,598 Average rainy days 16.7 13.8 17.3 18.5 23.2 26.5 27.1 26.0 26.4 27.5 24.6 21.0 268.6 Source: Meteoblue [ 9]
Demographics Population census of Tabogon Year ±% p.a. 1903 9,308 — 1918 17,781 +4.41% 1939 20,201 +0.61% 1948 17,227 −1.75% 1960 20,219 +1.34% 1970 20,148 −0.04% 1975 20,198 +0.05% 1980 21,840 +1.57% 1990 24,945 +1.34% 1995 27,735 +2.01% 2000 27,827 +0.07% 2007 31,942 +1.92% 2010 33,024 +1.22% 2015 39,013 +3.22% 2020 41,432 +1.27% 2024 42,066 +0.37% Source: Philippine Statistics Authority [ 10] [ 11] [ 8] [ 12] [ 13]
References ↑ Municipality of Tabogon | (DILG) ↑ "2015 Census of Population, Report No. 3 – Population, Land Area, and Population Density" (PDF) . Philippine Statistics Authority . Quezon City, Philippines. August 2016. ISSN 0117-1453 . Archived (PDF) from the original on May 25, 2021. Retrieved July 16, 2021 . ↑ "2024 Census of Population (POPCEN) Population Counts Declared Official by the President" . Philippine Statistics Authority. 17 July 2025. Retrieved 18 July 2025 . ↑ "PSA Releases the 2021 City and Municipal Level Poverty Estimates" . Philippine Statistics Authority. 2 April 2024. Retrieved 28 April 2024 . ↑ "2024 Census of Population (POPCEN) Population Counts Declared Official by the President" . Philippine Statistics Authority. 17 July 2025. Retrieved 18 July 2025 . ↑ English to Binisaya - Cebuano Dictionary and Thesaurus ↑ Census of Population (2020). "Region VII (Central Visayas)" . Total Population by Province, City, Municipality and Barangay . Philippine Statistics Authority . Retrieved 8 July 2021 . 1 2 Census of Population and Housing (2010). "Region VII (Central Visayas)" (PDF) . Total Population by Province, City, Municipality and Barangay . National Statistics Office . Retrieved 29 June 2016 . ↑ "Tabogon: Average Temperatures and Rainfall" . Meteoblue. Retrieved 10 May 2020 . ↑ "2024 Census of Population (POPCEN) Population Counts Declared Official by the President" . Philippine Statistics Authority. 17 July 2025. Retrieved 18 July 2025 . ↑ Census of Population (2015). "Region VII (Central Visayas)" . Total Population by Province, City, Municipality and Barangay . Philippine Statistics Authority . Retrieved 20 June 2016 . ↑ Censuses of Population (1903–2007). "Region VII (Central Visayas)" . Table 1. Population Enumerated in Various Censuses by Province/Highly Urbanized City: 1903 to 2007 National Statistics Office . ↑ "Province of Cebu" . Municipality Population Data . Local Water Utilities Administration Research Division. Retrieved 17 December 2016 . ↑ "Poverty incidence (PI):" . Philippine Statistics Authority. Retrieved December 28, 2020 . ↑ "Estimation of Local Poverty in the Philippines" (PDF) . Philippine Statistics Authority. 29 November 2005. ↑ "2003 City and Municipal Level Poverty Estimates" (PDF) . Philippine Statistics Authority. 23 March 2009. ↑ "City and Municipal Level Poverty Estimates; 2006 and 2009" (PDF) . Philippine Statistics Authority. 3 August 2012. ↑ "2012 Municipal and City Level Poverty Estimates" (PDF) . Philippine Statistics Authority. 31 May 2016. ↑ "Municipal and City Level Small Area Poverty Estimates; 2009, 2012 and 2015" . Philippine Statistics Authority. 10 July 2019. ↑ "PSA Releases the 2018 Municipal and City Level Poverty Estimates" . Philippine Statistics Authority. 15 December 2021. Retrieved 22 January 2022 . ↑ "PSA Releases the 2021 City and Municipal Level Poverty Estimates" . Philippine Statistics Authority. 2 April 2024. Retrieved 28 April 2024 . External links Media related to Tabogon at Wikimedia Commons
Places adjacent to Tabogon
This page is based on this
Wikipedia article Text is available under the
CC BY-SA 4.0 license; additional terms may apply.
Images, videos and audio are available under their respective licenses.