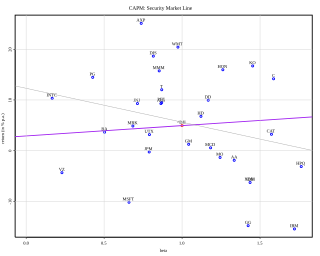
In finance, the capital asset pricing model (CAPM) is a model used to determine a theoretically appropriate required rate of return of an asset, to make decisions about adding assets to a well-diversified portfolio.
In financial markets, stock valuation is the method of calculating theoretical values of companies and their stocks. The main use of these methods is to predict future market prices, or more generally, potential market prices, and thus to profit from price movement – stocks that are judged undervalued are bought, while stocks that are judged overvalued are sold, in the expectation that undervalued stocks will overall rise in value, while overvalued stocks will generally decrease in value. A target price is a price at which an analyst believes a stock to be fairly valued relative to its projected and historical earnings.
Bond valuation is the process by which an investor arrives at an estimate of the theoretical fair value, or intrinsic worth, of a bond. As with any security or capital investment, the theoretical fair value of a bond is the present value of the stream of cash flows it is expected to generate. Hence, the value of a bond is obtained by discounting the bond's expected cash flows to the present using an appropriate discount rate.
In finance, the duration of a financial asset that consists of fixed cash flows, such as a bond, is the weighted average of the times until those fixed cash flows are received. When the price of an asset is considered as a function of yield, duration also measures the price sensitivity to yield, the rate of change of price with respect to yield, or the percentage change in price for a parallel shift in yields.
In finance, the beta is a statistic that measures the expected increase or decrease of an individual stock price in proportion to movements of the stock market as a whole. Beta can be used to indicate the contribution of an individual asset to the market risk of a portfolio when it is added in small quantity. It is referred to as an asset's non-diversifiable risk, systematic risk, or market risk. Beta is not a measure of idiosyncratic risk.
In finance, the Sharpe ratio measures the performance of an investment such as a security or portfolio compared to a risk-free asset, after adjusting for its risk. It is defined as the difference between the returns of the investment and the risk-free return, divided by the standard deviation of the investment returns. It represents the additional amount of return that an investor receives per unit of increase in risk.
The Sortino ratio measures the risk-adjusted return of an investment asset, portfolio, or strategy. It is a modification of the Sharpe ratio but penalizes only those returns falling below a user-specified target or required rate of return, while the Sharpe ratio penalizes both upside and downside volatility equally. Though both ratios measure an investment's risk-adjusted return, they do so in significantly different ways that will frequently lead to differing conclusions as to the true nature of the investment's return-generating efficiency.
Tobin's q, is the ratio between a physical asset's market value and its replacement value. It was first introduced by Nicholas Kaldor in 1966 in his paper: Marginal Productivity and the Macro-Economic Theories of Distribution: Comment on Samuelson and Modigliani. It was popularised a decade later by James Tobin, who in 1970, described its two quantities as:
One, the numerator, is the market valuation: the going price in the market for exchanging existing assets. The other, the denominator, is the replacement or reproduction cost: the price in the market for newly produced commodities. We believe that this ratio has considerable macroeconomic significance and usefulness, as the nexus between financial markets and markets for goods and services.
The Treynor reward to volatility model, named after Jack L. Treynor, is a measurement of the returns earned in excess of that which could have been earned on an investment that has no diversifiable risk, per unit of market risk assumed.
The drawdown is the measure of the decline from a historical peak in some variable.

In probability theory, the Kelly criterion is a formula for sizing a bet. The Kelly bet size is found by maximizing the expected value of the logarithm of wealth, which is equivalent to maximizing the expected geometric growth rate. It assumes that the expected returns are known and is optimal for a bettor who values their wealth logarithmically. J. L. Kelly Jr, a researcher at Bell Labs, described the criterion in 1956. Under the stated assumptions, the Kelly criterion leads to higher wealth than any other strategy in the long run.
The information ratio measures and compares the active return of an investment compared to a benchmark index relative to the volatility of the active return. It is defined as the active return divided by the tracking error. It represents the additional amount of return that an investor receives per unit of increase in risk. The information ratio is simply the ratio of the active return of the portfolio divided by the tracking error of its return, with both components measured relative to the performance of the agreed-on benchmark.
In finance, tracking error or active risk is a measure of the risk in an investment portfolio that is due to active management decisions made by the portfolio manager; it indicates how closely a portfolio follows the index to which it is benchmarked. The best measure is the standard deviation of the difference between the portfolio and index returns.
The ulcer index is a stock market risk measure or technical analysis indicator devised by Peter Martin in 1987, and published by him and Byron McCann in their 1989 book The Investors Guide to Fidelity Funds. It is a measure of downwards volatility, the amount of drawdown or retracement over a period.
An inverse exchange-traded fund is an exchange-traded fund (ETF), traded on a public stock market, which is designed to perform as the inverse of whatever index or benchmark it is designed to track. These funds work by using short selling, trading derivatives such as futures contracts, and other leveraged investment techniques.
The Sterling ratio (SR) is a measure of the risk-adjusted return of an investment portfolio.
The Penalized Present Value (PPV) is a method of capital budgeting under risk, where the value of the investment is "penalized" as a function of its risk. It was developed by Fernando Gómez-Bezares in the 1980s.
Modigliani risk-adjusted performance (also known as M2, M2, Modigliani–Modigliani measure or RAP) is a measure of the risk-adjusted returns of some investment portfolio. It measures the returns of the portfolio, adjusted for the risk of the portfolio relative to that of some benchmark (e.g., the market). We can interpret the measure as the difference between the scaled excess return of our portfolio P and that of the market, where the scaled portfolio has the same volatility as the market. It is derived from the widely used Sharpe ratio, but it has the significant advantage of being in units of percent return (as opposed to the Sharpe ratio – an abstract, dimensionless ratio of limited utility to most investors), which makes it dramatically more intuitive to interpret.
The public market equivalent (PME) is a collection of performance measures developed to assess private equity funds and to overcome the limitations of the internal rate of return and multiple on invested capital measurements. While the calculations differ, they all attempt to measure the return from deploying a private equity fund's cash flows into a stock market index.
The Rachev Ratio is a risk-return performance measure of an investment asset, portfolio, or strategy. It was devised by Dr. Svetlozar Rachev and has been extensively studied in quantitative finance. Unlike the reward-to-variability ratios, such as Sharpe ratio and Sortino ratio, the Rachev ratio is a reward-to-risk ratio, which is designed to measure the right tail reward potential relative to the left tail risk in a non-Gaussian setting. Intuitively, it represents the potential for extreme positive returns compared to the risk of extreme losses, at a rarity frequency q defined by the user.


