West Nova

Last updated

West Nova
Flag of Nova Scotia.svg Nova Scotia electoral district
West nova map.png
West Nova in relation to the other Nova Scotia federal electoral districts
Coordinates: 44°27′N65°35′W / 44.450°N 65.583°W / 44.450; -65.583
Federal electoral district
Legislature House of Commons
MP


Chris d'Entremont
Conservative
District created1966
First contested 1968
Last contested 2021
District webpage profile, map
Demographics
Population (2021) [1] 83,571
Electors (2021)70,479
Area (km²) [1] 8,885
Pop. density (per km²)9.4
Census division(s) Annapolis, Digby, Kings, Yarmouth
Census subdivision(s) Annapolis Royal, Berwick, Bridgetown, Digby, Middleton, Yarmouth

West Nova (French : Nova-Ouest) is a federal electoral district in Nova Scotia, Canada, that has been represented in the House of Commons of Canada since 1968.

Contents

South Western Nova and South West Nova were ridings that covered roughly the same geographic area and were represented in the House of Commons from 1968 to 1979 and 1979 to 1997, respectively.

Following the 2022 Canadian federal electoral redistribution, this riding will be renamed Acadie—Annapolis at the first election held after approximately April 2024. It will lose some territory (Berwick area) in Kings County to Kings—Hants. [2]

The district is rural with a few small towns and communities located along the coast. The riding has been called a microcosm of rural Canada because it includes fishing, farming, tourism, small business and an English-French mix. [3]

History

The electoral district was created in 1966 from Digby—Annapolis—Kings and Shelburne—Yarmouth—Clare ridings. In 1996, Seal Island was added and the name was changed from South West Nova to West Nova. In 2004, 20 percent of Kings—Hants was added to the district. The boundaries remained unchanged as per the 2012 federal electoral redistribution. From 1968 until 2004, the Riding was notable for never having elected a single person to a second consecutive term until Robert Thibault won in 2004.

Demographics

Historical population
YearPop.±%
2001 88,257    
2006 86,393−2.1%
2011 83,654−3.2%
2016 82,026−1.9%
2021 83,571+1.9%

From the 2021 census [4]

Ethnic groups:

Mother tongue language:

Religions:

Education:

Income:

Median age:

Unemployment:

Geography

It reaches from Berwick in Kings County (it only includes the western part of Kings County) down through Annapolis County, Digby County and Yarmouth County, ending at the Yarmouth-Shelburne border.

Members of Parliament

This riding has elected the following members of Parliament:

ParliamentYearsMemberParty
South Western Nova
Riding created from Digby—Annapolis—Kings
and Shelburne—Yarmouth—Clare
28th  1968–1972   Louis-Roland Comeau Progressive Conservative
29th  1972–1974 Charles Haliburton
30th  1974–1979   Coline Campbell Liberal
South West Nova
31st  1979–1980   Charles Haliburton Progressive Conservative
32nd  1980–1984   Coline Campbell Liberal
33rd  1984–1988   Gerald Comeau Progressive Conservative
34th  1988–1993   Coline Campbell Liberal
35th  1993–1997 Harry Verran
West Nova
36th  1997–2000   Mark Muise Progressive Conservative
37th  2000–2004   Robert Thibault Liberal
38th  2004–2006
39th  2006–2008
40th  2008–2011   Greg Kerr Conservative
41st  2011–2015
42nd  2015–2019   Colin Fraser Liberal
43rd  2019–2021   Chris d'Entremont Conservative
44th  2021–present

Election results

Graph of election results in South Western Nova, South West Nova, and West Nova (minor parties that never got 2% of the vote or didn't run consistently are omitted)

West Nova

Graph of election results in West Nova (minor parties that never got 2% of the vote or didn't run consistently are omitted)

2021

2021 Canadian federal election
PartyCandidateVotes%±%Expenditures
Conservative Chris d'Entremont 22,10450.38+11.08$84,677.20
Liberal Alxys Chamberlain13,73231.30-5.06$58,947.58
New Democratic Cheryl Burbidge5,64512.87+2.17$2,097.31
People's Scott Spidle2,3905.45$977.39
Total valid votes/expense limit43,871$111,398.28
Total rejected ballots284
Turnout44,15562.65-4.80
Registered voters70,479
Conservative hold Swing +8.03
Source: Elections Canada [5]
2021 federal election redistributed results [6]
PartyVote %
  Conservative 20,63451.31
  Liberal 12,34230.69
  New Democratic 5,10412.69
  People's 2,1335.30

2019

2019 Canadian federal election
PartyCandidateVotes%±%Expenditures
Conservative Chris d'Entremont 18,39039.30+13.21$72,015.22
Liberal Jason Deveau17,02536.38−26.61$53,630.92
Green Judy N. Green 5,93912.69+8.52$12,854.70
New Democratic Matthew Dubois5,01010.71+3.96$6,668.83
Veterans Coalition Gloria Jane Cook4340.93Newnone listed
Total valid votes/expense limit46,79898.92 $105,785.41
Total rejected ballots5121.08+0.49
Turnout47,31067.45−1.34
Eligible voters70,143
Conservative gain from Liberal Swing +19.91
Source: Elections Canada [7]

2015

2015 Canadian federal election
PartyCandidateVotes%±%Expenditures
Liberal Colin Fraser 28,77562.99+26.60$87,337.64
Conservative Arnold LeBlanc11,91626.09–20.95$41,005.69
New Democratic Greg Foster3,0846.75–6.36$25,617.41
Green Clark Walton1,9044.17+0.71$2,291.24
Total valid votes/expense limit45,679100.00 $210,111.37
Total rejected ballots2710.59
Turnout45,95068.79
Eligible voters66,796
Liberal gain from Conservative Swing +23.78
Source: Elections Canada [8] [9]

2011

2011 Canadian federal election
PartyCandidateVotes%±%Expenditures
Conservative Greg Kerr 20,20447.04+7.10$82,563.21
Liberal Robert Thibault 15,63236.39+0.24$62,177.30
New Democratic George Barron5,63113.11-3.78$12,244.90
Green Ross Johnson1,4873.46-1.55none listed
Total valid votes/expense limit42,954100.0   $86,810.95
Total rejected, unmarked and declined ballots3560.82+0.10
Turnout43,31063.75+1.27
Eligible voters67,938
Conservative hold Swing +3.43
Sources: [10] [11]

2008

2008 Canadian federal election
PartyCandidateVotes%±%Expenditures
Conservative Greg Kerr 16,77939.94+1.83$69,467.56
Liberal Robert Thibault 15,18536.15-3.09$57,096.02
New Democratic George Barron7,09716.89-1.95$12,741.38
Green Ronald Mills2,1065.01+2.71$123.04
Independent Cindy M. Nesbitt8442.01$10,570.22
Total valid votes/expense limit42,011100.0   $83,932
Total rejected, unmarked and declined ballots3040.72+0.12
Turnout42,31562.48-1.20
Eligible voters67,722
Conservative gain from Liberal Swing +2.46

2006

2006 Canadian federal election
PartyCandidateVotes%±%Expenditures
Liberal Robert Thibault 17,73439.24-3.42$53,606.19
Conservative Greg Kerr 17,22238.11+5.06$54,945.96
New Democratic Arthur Bull8,51218.84-2.29$25,148.83
Green Matthew Granger1,0402.30-0.92$74.10
Independent Ken Griffiths6811.51$2,576.48
Total valid votes/expense limit45,190100.0   $79,451
Total rejected, unmarked and declined ballots2740.60-0.21
Turnout45,46463.68-2.26
Eligible voters71,393
Liberal hold Swing -4.24

2004

2004 Canadian federal election
PartyCandidateVotes%±%Expenditures
Liberal Robert Thibault 18,34342.66+8.06$48,703.53
Conservative Jon Charles Carey14,20933.05-20.44$70,393.83
New Democratic Arthur Bull9,08621.13+9.67$24,310.23
Green Matthew Granger1,3853.22none listed
Total valid votes/expense limit42,996100.0   $76,207
Total rejected, unmarked and declined ballots3520.81
Turnout43,34865.94+1.04
Eligible voters65,736
Liberal notional gain from Progressive Conservative Swing +14.25
Changes from 2000 are based on redistributed results. Change for the Conservative Party is based on the combined totals of the Progressive Conservative Party and the Canadian Alliance.
2000 federal election redistributed results
PartyVote %
  Progressive Conservative 15,15435.52
  Liberal 14,76034.60
  Alliance 7,66717.97
  New Democratic 4,88711.46
 Others1930.45

2000

2000 Canadian federal election
PartyCandidateVotes%±%Expenditures
Liberal Robert Thibault 12,78336.09+10.39$57,653
Progressive Conservative Mark Muise 12,08034.11-0.20$34,692
Alliance Mike Donaldson6,58118.58-0.23$32,417
New Democratic Phil Roberts3,97611.23-9.23$14,118
Total valid votes 35,420 100.00

Results for the Canadian Alliance from 1997 are based on the results of its predecessor, the Reform Party.

1997

1997 Canadian federal election
PartyCandidateVotes%±%Expenditures
Progressive Conservative Mark Muise 13,18734.31+11.64$37,592
Liberal Harry Verran 9,87725.70-29.19$47,082
New Democratic Brian Noble7,86220.46+14.87$4,426
Reform Betty Cox7,22918.81+3.66$25,210
Natural Law Neeraj Lakhanpal2750.72-0.98$0.00
Total valid votes 38,430100.00

South West Nova

Graph of election results in South West Nova (minor parties that never got 2% of the vote or didn't run consistently are omitted)

1993

1993 Canadian federal election
PartyCandidateVotes%±%
Liberal Harry Verran 20,53054.89+4.88
Progressive Conservative Yvon Joseph Thibault8,47822.67-18.84
Reform Louis Mason5,66715.15
New Democratic Peter Zavitz2,0905.59-0.10
Natural Law Gregg Murphy6361.70
Total valid votes 37,401100.00

1988

1988 Canadian federal election
PartyCandidateVotes%±%
Liberal Coline Campbell 21,06250.01+8.16
Progressive Conservative Gerald Comeau 17,48241.51-9.08
New Democratic Peter Zavitz2,3965.69-1.86
Christian Heritage Angus M. McLean1,1722.78
Total valid votes 42,112 100.00

1984

1984 Canadian federal election
PartyCandidateVotes%±%
Progressive Conservative Gerald Comeau 20,60450.59+13.78
Liberal Coline Campbell 17,04441.85-7.97
New Democratic Bob Ritchie3,0767.55-5.25
Total valid votes 40,724 100.00

1980

1980 Canadian federal election
PartyCandidateVotes%±%
Liberal Coline Campbell 19,15149.82+5.65
Progressive Conservative Charles Haliburton 14,15136.81-7.66
New Democratic John Lee4,92212.80+1.44
Independent Anne Trudell2160.56
Total valid votes 38,440100.00

1979

1979 Canadian federal election
PartyCandidateVotes%±%
Progressive Conservative Charles Haliburton 16,51244.47-0.64
Liberal Coline Campbell 16,39844.17-4.93
New Democratic Ian MacPherson4,21711.36+6.11
Total valid votes 37,127100.00

South Western Nova

Graph of election results in South Western Nova (minor parties that never got 2% of the vote or didn't run consistently are omitted)

1974

1974 Canadian federal election
PartyCandidateVotes%±%
Liberal Coline Campbell 15,06649.107.49
Progressive Conservative Charles Haliburton 13,84145.11-5.07
New Democratic Yvonne Coe1,6105.25-1.77
Social Credit Cecilia Zwicker1640.53-0.67
Total valid votes 30,681100.00

1972

1972 Canadian federal election
PartyCandidateVotes%±%
Progressive Conservative Charles Haliburton 15,03950.18-2.15
Liberal Fulton Logan12,47141.61-2.61
New Democratic Lawrence Meuse2,1047.02+4.66
Social Credit Charles Paddock3591.20
Total valid votes 29,973100.00

1968

1968 Canadian federal election
PartyCandidateVotes%
Progressive Conservative Louis-Roland Comeau 14,54352.33
Liberal John Stewart12,29044.22
New Democratic Rae Gilman6552.36
Independent PCN. Evan Atkinson2931.05
Total valid votes 27,791100.00

See also

Related Research Articles

<span class="mw-page-title-main">Kings—Hants</span> Federal electoral district in Nova Scotia, Canada

Kings—Hants is a federal electoral district in Nova Scotia, Canada, that has been represented in the House of Commons of Canada since 1968.

<span class="mw-page-title-main">Dartmouth—Cole Harbour</span> Federal electoral district in Nova Scotia, Canada

Dartmouth—Cole Harbour is a federal electoral district in Nova Scotia, Canada, that has been represented in the House of Commons of Canada since 2004.

<span class="mw-page-title-main">Halifax West</span> Federal electoral district in Nova Scotia, Canada

Halifax West is a federal electoral district in Nova Scotia, Canada, that has been represented in the House of Commons of Canada since 1979. Its population in 2021 was 111,944.

<span class="mw-page-title-main">Cumberland—Colchester</span> Federal electoral district in Nova Scotia, Canada

Cumberland—Colchester is a federal electoral district in Nova Scotia, Canada, that has been represented in the House of Commons of Canada since 2004.

<span class="mw-page-title-main">Sackville—Preston—Chezzetcook</span> Federal electoral district in Nova Scotia, Canada

Sackville—Preston—Chezzetcook is a federal electoral district in Halifax, Nova Scotia, Canada, that has been represented in the House of Commons of Canada since 1997.

<span class="mw-page-title-main">South Shore—St. Margarets</span> Federal electoral district in Nova Scotia, Canada

South Shore—St. Margarets is a federal electoral district in Nova Scotia, Canada, that has been represented in the House of Commons of Canada since 1968. It covers the South Shore region of Nova Scotia.

Annapolis was a federal electoral district in Nova Scotia, Canada, that was represented in the House of Commons of Canada from 1867 to 1917. The district was created in the British North America Act, 1867. It was abolished in 1914 when it was redistributed into Digby and Annapolis. It consisted of Annapolis County, Nova Scotia.

Digby was a federal electoral district in Nova Scotia, Canada, that was represented in the House of Commons of Canada from 1867 to 1917. It was created as part of the British North America Act, 1867, and was abolished in 1914 when it was redistributed into Digby and Annapolis and Yarmouth and Clare ridings.

Shelburne and Queen's was a federal electoral district in the province of Nova Scotia, Canada, that was represented in the House of Commons of Canada from 1896 to 1925.

Digby and Annapolis was a federal electoral district in the province of Nova Scotia, Canada, that was represented in the House of Commons of Canada from 1917 to 1935.

Yarmouth and Clare was a federal electoral district in Nova Scotia, Canada, that was represented in the House of Commons of Canada from 1917 to 1925. This riding was created in 1914 from Digby and Yarmouth ridings. It consisted of the County of Yarmouth and the municipality of Clare. It was abolished in 1924 when it was redistributed into Digby and Annapolis and Shelburne—Yarmouth ridings.

Hants—Kings was a federal electoral district in the province of Nova Scotia, Canada, that was represented in the House of Commons of Canada from 1925 to 1935.

Colchester—Hants was a federal electoral district in Nova Scotia, Canada, that was represented in the House of Commons of Canada from 1935 to 1968.

Digby—Annapolis—Kings was a federal electoral district in the province of Nova Scotia, Canada, that was represented in the House of Commons of Canada from 1935 to 1949, and from 1953 to 1968.

Shelburne—Yarmouth—Clare was a federal electoral district in the province of Nova Scotia, Canada, that was represented in the House of Commons of Canada from 1935 to 1949 and from 1953 to 1968.

Annapolis—Kings was a federal electoral district in the province of Nova Scotia, Canada, that was represented in the House of Commons of Canada from 1949 to 1953.

Digby—Yarmouth was a federal electoral district in the province of Nova Scotia, Canada, that was represented in the House of Commons of Canada from 1949 to 1953.

Halifax—East Hants was a federal electoral district in the province of Nova Scotia, Canada, that was represented in the House of Commons of Canada from 1968 to 1979. The riding was created in 1966 from parts of Colchester—Hants riding. It consisted of the Municipality of East Hants in the county of Hants, and parts of the county of Halifax and the city of Halifax.

Hiram Thomas was a Canadian politician. He represented the electoral district of Kings West in the Nova Scotia House of Assembly from 1956 to 1960. He was a member of the Progressive Conservative Party of Nova Scotia.

<span class="mw-page-title-main">Administrative divisions of Nova Scotia</span> Local governance within Nova Scotia

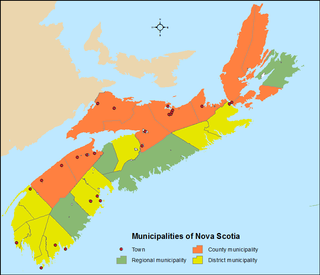
The Canadian province of Nova Scotia is divided into 49 municipalities, of which there are three types: regional (4), town (25), and county or district municipality (20).

References

  1. 1 2 Statistics Canada: 2012
  2. "New Federal Electoral Map for Nova Scotia". Federal Electoral Districts Redistribution 2022. April 26, 2023. Retrieved April 27, 2023.
  3. CBC riding profile
  4. West Nova's census profile Statistics Canada
  5. "September 20, 2021 General Election Election Results". Elections Canada. Retrieved September 22, 2021.
  6. "Transposition of Votes from the 44th General Election to the 2023 Representation Orders". Elections Canada . Retrieved April 9, 2024.
  7. "Official Voting Results". Elections Canada. Retrieved September 22, 2021.
  8. "October 19, 2015 Election Results — West Nova (Validated results)". Elections Canada. October 22, 2015. Retrieved October 24, 2015.
  9. "Elections Canada – Preliminary Election Expenses Limits for Candidates". Archived from the original on March 4, 2016. Retrieved November 10, 2018.
  10. Elections Canada – Official voting results, Forty-first general election, 2011
  11. Elections Canada – Candidate's electoral campaign return, 41st general election

Sources