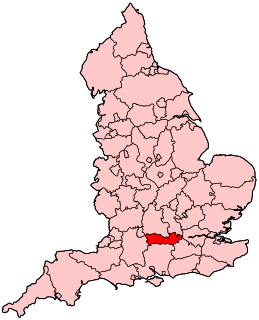
The 2003 Windsor and Maidenhead Borough Council election took place on 1 May 2003 to elect members of Windsor and Maidenhead Unitary Council in Berkshire, England. The whole council was up for election with boundary changes since the last election in 2000 reducing the number of seats by 1. [1] The Liberal Democrats gained overall control of the council from no overall control. [2]
The Royal Borough of Windsor and Maidenhead is a Royal Borough of Berkshire, in South East England. Its nearest border to London, being Maidenhead is approx 30 miles. It is home to Windsor Castle, Eton College, Legoland Windsor and Ascot Racecourse. It is one of four boroughs entitled to be prefixed Royal and is one of six unitary authorities in its county which has Historic and Lieutenancy county status.
A unitary authority is a type of local authority that has a single tier and is responsible for all local government functions within its area or performs additional functions which elsewhere in the relevant country are usually performed by national government or a higher level of sub-national government.
Berkshire is one of the home counties in England. It was recognised by the Queen as the Royal County of Berkshire in 1957 because of the presence of Windsor Castle, and letters patent were issued in 1974. Berkshire is a county of historic origin, a ceremonial county and a non-metropolitan county without a county council. The county town is Reading.
Windsor and Maidenhead council was a top target for the Liberal Democrats in the 2003 local elections. [3] The party had come close to taking the Maidenhead parliamentary constituency at the last general election in 2001 and were optimistic of taking control of the council. [4] [5] The Liberal Democrats were expected to benefit from the support of the estimated 3,000 Muslims who lived in the council area due to the party's opposition to the Iraq War. [4] The issue of a proposed extension to a local mosque was also used for the Liberal Democrats, [4] but the Conservatives accused them of pandering to the Muslim community. [6]
Maidenhead is a constituency in Berkshire represented in the House of Commons of the UK Parliament. It has been represented by Theresa May since it was created in 1997. May succeeded David Cameron as UK Prime Minister and Leader of the Conservative Party on 13 July 2016. Prior to becoming Prime Minister, May served as Home Secretary from 2010–2016.
The council had been controlled by the Conservatives since the 2000 election in an alliance with 2 of the independent councillors. [7] However the Liberal Democrats attacked the council for having raised council tax by 9.3% in the last year and by 20% over the 3 years since the last election. [7] They also criticised the council for its plans to demolish the town hall and pointed to a weak rating for the council by the Audit Commission. [7] However the Conservatives said Windsor and Maidenhead's council tax was still one of the lowest in the southeast and that if the Liberal Democrats implemented the policies in their manifesto it would mean a 27% increase in council tax. [7]
A Councillor is a member of a local government council.
The Audit Commission was a statutory corporation in the United Kingdom. The Commission’s primary objective was to appoint auditors to a range of local public bodies in England, set the standards for auditors and oversee their work. The Commission closed on 31 March 2015, with its functions being transferred to the voluntary, not-for-profit or private sector.
Boundary changes which reduced the number of seats by 1, meant both the Conservatives and Liberal Democrats needed 1 less seat to take control of the council. [6] With the election important to both parties, the Conservative party chairman and local MP Theresa May and the Liberal Democrat leader Charles Kennedy both campaigned in the area. [6]
The Chairman of the Conservative Party in the United Kingdom is responsible for party administration, overseeing the Conservative Campaign Headquarters. When the Conservatives are in government, the Chairman is usually a member of the Cabinet holding a sinecure position such as Minister without Portfolio. Deputy or vice-chairmen may also be appointed, with responsibility for specific aspects of the Conservative Party. When a woman holds the office, such as Theresa May and Dame Caroline Spelman, the office is titled Chairwoman of the Conservative Party. The Conservative Party is currently chaired by Brandon Lewis, who was appointed January 8th, 2018, with James Cleverly who served as his deputy from 2018 to 2019.
Theresa Mary May is a British politician serving as Prime Minister of the United Kingdom and Leader of the Conservative Party since 2016. She served as Home Secretary from 2010 to 2016. May was first elected Member of Parliament (MP) for Maidenhead in 1997. Ideologically, she identifies herself as a one-nation conservative.
Charles Peter Kennedy was a British Liberal Democrat politician who was Leader of the Liberal Democrats from 1999 to 2006, and a Member of Parliament (MP) from 1983 to 2015, latterly for the Ross, Skye and Lochaber constituency.
The council again used a mobile polling station to go to railway stations and supermarkets in an attempt to increase turnout. [8]
Voter turnout is the percentage of eligible voters who cast a ballot in an election. Eligibility varies by country, and the voting-eligible population should not be confused with the total adult population. Age and citizenship status are often among the criteria used to determine eligibility, but some countries further restrict eligibility based on sex, race, or religion.
The results saw the Liberal Democrats take control of the council, [9] after gaining 13 seats. [10] The election results were seen as giving the Liberal Democrats hope for the next general election in the Maidenhead constituency after the party won 61% of the vote in wards within the constituency against 33.6% for the Conservatives. [10]
Party | Seats | Gains | Losses | Net gain/loss | Seats % | Votes % | Votes | +/− | |
---|---|---|---|---|---|---|---|---|---|
Liberal Democrat | 34 | +13 | 59.6 | 49.0 | 46,098 | ||||
Conservative | 15 | -14 | 26.3 | 37.8 | 35,585 | ||||
Independent | 5 | +5 | 8.8 | 4.8 | 4,540 | ||||
Old Windsor Residents' & Ratepayers Association | 2 | 0 | 3.5 | 1.8 | 1,732 | ||||
Labour | 1 | 0 | 1.8 | 6.0 | 5,617 | ||||
Green | 0 | 0 | 0 | 0.5 | 464 | ||||
Residents | 0 | -5 | 0 | 0 | 0 |
Party | Candidate | Votes | % | ± | |
---|---|---|---|---|---|
Conservative | David Hilton | 775 | |||
Conservative | Peter Spooner | 708 | |||
Liberal Democrat | Jonathan Pope | 229 | |||
Liberal Democrat | Geoffrey Taylor | 214 | |||
Green | Stephen Young | 120 | |||
Turnout | 2,046 | 30.3 |
Party | Candidate | Votes | % | ± | |
---|---|---|---|---|---|
Liberal Democrat | Michael Bruton | 1,524 | |||
Liberal Democrat | Clive Baskerville | 1,406 | |||
Liberal Democrat | David Mackay | 1,364 | |||
Conservative | Philip Love | 752 | |||
Conservative | Iain Buchanan | 712 | |||
Conservative | Asghar Majeed | 638 | |||
Labour | Patricia Shenstone | 147 | |||
Turnout | 6,543 | 39.1 |
Party | Candidate | Votes | % | ± | |
---|---|---|---|---|---|
Liberal Democrat | Mohinder Brar | 1,196 | |||
Liberal Democrat | David Ricardo | 1,090 | |||
Liberal Democrat | Margaret Cubley | 1,000 | |||
Conservative | Alan Jay | 968 | |||
Conservative | Michael Lawrence | 964 | |||
Conservative | Chester Denniford | 936 | |||
Labour | Judith Percival | 144 | |||
Labour | Paul Percival | 105 | |||
Turnout | 6,403 | 40.9 |
Party | Candidate | Votes | % | ± | |
---|---|---|---|---|---|
Liberal Democrat | Michael Holness | 1,297 | |||
Liberal Democrat | Margaret Hyde | 1,235 | |||
Liberal Democrat | David Howes | 1,215 | |||
Conservative | Yames Bragg | 643 | |||
Conservative | Howard McBrien | 641 | |||
Conservative | Arshad Hussain | 606 | |||
Green | Ann Hay | 113 | |||
Labour | Robert Barclay | 81 | |||
Labour | Jennifer Cooper | 81 | |||
Turnout | 5,912 | 36.7 |
Party | Candidate | Votes | % | ± | |
---|---|---|---|---|---|
Conservative | Leo Walters | 1,028 | |||
Conservative | Barry Thompson | 986 | |||
Conservative | David Burbage | 982 | |||
Liberal Democrat | Peter Janikoun | 509 | |||
Liberal Democrat | Heather Elliot | 460 | |||
Liberal Democrat | Nigel Shurben | 396 | |||
Labour | Alan Wellstead | 147 | |||
Turnout | 4,508 | 28.4 |
Party | Candidate | Votes | % | ± | |
---|---|---|---|---|---|
Liberal Democrat | David Eglise | 962 | |||
Liberal Democrat | Bryan Hedley | 962 | |||
Liberal Democrat | Martin Pritchett | 959 | |||
Conservative | George Bathurst | 444 | |||
Conservative | Catherine Lavender | 429 | |||
Conservative | David Coppinger | 399 | |||
Labour | Margaret Atwell | 136 | |||
Labour | Janet Milward | 132 | |||
Turnout | 4,423 | 31.4 |
Party | Candidate | Votes | % | ± | |
---|---|---|---|---|---|
Liberal Democrat | Mary Gliksten | 655 | |||
Liberal Democrat | Lee Hibbard | 640 | |||
Conservative | Keith Evans | 553 | |||
Conservative | Eileen Quick | 541 | |||
Labour | Andrew Gittins | 120 | |||
Turnout | 2,509 | 38.1 |
Party | Candidate | Votes | % | ± | |
---|---|---|---|---|---|
Independent | Cynthia Endacott | 967 | |||
Independent | Eileen Penfold | 914 | |||
Independent | Geoffrey Fido | 883 | |||
Conservative | Peter Smith | 457 | |||
Conservative | James Richards | 452 | |||
Conservative | Wesley Richards | 430 | |||
Liberal Democrat | John Foster | 274 | |||
Labour | Ann Matthews | 265 | |||
Labour | Andrew Foakes | 250 | |||
Liberal Democrat | Nicola Shurben | 249 | |||
Labour | Antony Matthews | 245 | |||
Liberal Democrat | Gary Wilson | 227 | |||
Turnout | 5,613 | 31.6 |
Party | Candidate | Votes | % | ± | |
---|---|---|---|---|---|
Liberal Democrat | Richard Fagence | 742 | |||
Liberal Democrat | Antony Wood | 706 | |||
Conservative | Jennifer Heaven | 232 | |||
Conservative | Victor Chukwuemeka | 207 | |||
Labour | Linda Ayres | 89 | |||
Labour | Kenneth Coles | 87 | |||
Turnout | 2,063 | 27.6 |
Party | Candidate | Votes | % | ± | |
---|---|---|---|---|---|
Liberal Democrat | Victoria Howes | 1,332 | |||
Liberal Democrat | Bruce Adams | 1,320 | |||
Liberal Democrat | Emrys Richards | 1,295 | |||
Conservative | Paul Digby | 529 | |||
Conservative | Maureen Mallet | 493 | |||
Conservative | Charles Horder | 490 | |||
Labour | Ian Harvey | 132 | |||
Labour | Robert Horner | 121 | |||
Labour | Mohammed Shafiq | 90 | |||
Turnout | 5,802 | 34.3 |
Party | Candidate | Votes | % | ± | |
---|---|---|---|---|---|
Conservative | Jesse Grey | 613 | |||
Conservative | Elizabeth Hawkes | 610 | |||
Liberal Democrat | Timothy O'Flynn | 438 | |||
Independent | Ewan Larcombe | 264 | |||
Labour | Peter Ward | 129 | |||
Turnout | 2,054 | 29.7 |
Party | Candidate | Votes | % | ± | |
---|---|---|---|---|---|
Liberal Democrat | Richard Pratt | 309 | 58.3 | ||
Conservative | Gwyn Collier | 180 | 34.0 | ||
Labour | Jennifer Ward | 41 | 7.7 | ||
Majority | 129 | 24.3 | |||
Turnout | 530 | 29.7 |
Party | Candidate | Votes | % | ± | |
---|---|---|---|---|---|
Labour | Mark Olney | 484 | 62.9 | ||
Conservative | Stephen Smith | 286 | 37.1 | ||
Majority | 198 | 25.7 | |||
Turnout | 770 | 42.0 |
Party | Candidate | Votes | % | ± | |
---|---|---|---|---|---|
Liberal Democrat | Mary Stock | 1,459 | |||
Liberal Democrat | Cynthia Pitteway | 1,411 | |||
Liberal Democrat | Humaira Javed | 1,377 | |||
Conservative | Clifford Baker | 613 | |||
Conservative | Penelope Baker | 590 | |||
Conservative | Anthony Willis | 566 | |||
Labour | Katherine Holder | 117 | |||
Turnout | 6,133 | 37.7 |
Party | Candidate | Votes | % | ± | |
---|---|---|---|---|---|
Independent | Donald Gregory | 790 | |||
Independent | Richard Bertram | 722 | |||
Conservative | Duncan Parker | 516 | |||
Conservative | David Martin | 474 | |||
Labour | Paul Rae | 69 | |||
Turnout | 2,571 | 34.7 |
Party | Candidate | Votes | % | ± | |
---|---|---|---|---|---|
Liberal Democrat | John Iles | 1,166 | |||
Liberal Democrat | Jeremy Hyde | 1,154 | |||
Liberal Democrat | Anthony Langdown | 1,118 | |||
Conservative | David Penfold | 639 | |||
Conservative | Philip Watss | 580 | |||
Conservative | Justin List | 563 | |||
Labour | Patrick McDonald | 295 | |||
Labour | Kelly Dale | 272 | |||
Labour | Kevin Webb | 261 | |||
Turnout | 6,048 | 44.0 |
Party | Candidate | Votes | % | ± | |
---|---|---|---|---|---|
Liberal Democrat | Pamela Proctor | 1,374 | |||
Liberal Democrat | Peter Herlinger | 1,341 | |||
Liberal Democrat | Alison Napier | 1,294 | |||
Conservative | Andrew Jenner | 877 | |||
Conservative | Catherine Hollingsworth | 784 | |||
Conservative | Jennifer Spear | 723 | |||
Labour | Pamela Kennedy | 117 | |||
Green | Craig McDermott | 86 | |||
Turnout | 6,596 | 41.8 |
Party | Candidate | Votes | % | ± | |
---|---|---|---|---|---|
Old Windsor Residents' and Ratepayers' Association | Malcolm Beer | 906 | |||
Old Windsor Residents' and Ratepayers' Association | Eric Wiles | 826 | |||
Conservative | Christopher Hawkes | 173 | |||
Conservative | James Belsey | 161 | |||
Labour | Roy Reeves | 125 | |||
Labour | Ahamed Mashoor | 103 | |||
Turnout | 2,294 | 30.5 |
Party | Candidate | Votes | % | ± | |
---|---|---|---|---|---|
Conservative | Derek Wilson | 729 | |||
Conservative | Dorothy Kemp | 725 | |||
Conservative | Gillian Moore | 713 | |||
Liberal Democrat | Barbara Dorrington | 640 | |||
Liberal Democrat | Michael Bartley | 622 | |||
Liberal Democrat | Robert Hill | 608 | |||
Labour | Kathleen Cutting | 293 | |||
Labour | Anthony Randall | 217 | |||
Labour | Nigel Smith | 193 | |||
Turnout | 4,740 | 28.3 |
Party | Candidate | Votes | % | ± | |
---|---|---|---|---|---|
Liberal Democrat | Michael Scott | 854 | |||
Liberal Democrat | Beverley Green | 835 | |||
Conservative | Anthony Cross | 640 | |||
Conservative | John Henson | 634 | |||
Labour | Brent Curless | 77 | |||
Labour | Annemarie Price | 67 | |||
Turnout | 3,107 | 37.3 |
Party | Candidate | Votes | % | ± | |
---|---|---|---|---|---|
Liberal Democrat | Kathryn Newbound | 1,480 | |||
Liberal Democrat | Simon Werner | 1,360 | |||
Liberal Democrat | Wilson Hendry | 1,341 | |||
Conservative | Charles Hollingsworth | 603 | |||
Conservative | Brian Webster | 598 | |||
Conservative | Jacqueline Porter | 581 | |||
Labour | Margaret Horner | 127 | |||
Turnout | 6,090 | 38.9 |
Party | Candidate | Votes | % | ± | |
---|---|---|---|---|---|
Conservative | Christine Bateson | 858 | |||
Conservative | John Webb | 847 | |||
Liberal Democrat | Elizabeth Herbert-Brown | 212 | |||
Liberal Democrat | Peter Cross | 185 | |||
Labour | Kevin Cochrane | 122 | |||
Turnout | 2,224 | 31.8 |
Party | Candidate | Votes | % | ± | |
---|---|---|---|---|---|
Conservative | Brian Birkhead | 914 | |||
Conservative | Alison Knight | 904 | |||
Conservative | Lynda Yong | 896 | |||
Liberal Democrat | Enid Cross | 698 | |||
Liberal Democrat | Charmian Hopkins | 686 | |||
Liberal Democrat | Christopher Bushill | 678 | |||
Green | Stephen Shaw | 145 | |||
Labour | Elizabeth Yates | 136 | |||
Turnout | 5,057 | 34.4 |
Local government elections took place in England (only) on Thursday 4 May 2006. Polling stations were open between 7:00 and 22:00.
The 2000 St Helens Metropolitan Borough Council election took place on 4 May 2000 to elect members of St Helens Metropolitan Borough Council in Merseyside, England. One third of the council was up for election and the Labour party stayed in overall control of the council.
The 2008 Tandridge District Council election took place on 1 May 2008 to elect members of Tandridge District Council in Surrey, England. One third of the council was up for election and the Conservative party stayed in overall control of the council.
The 2002 Worthing Borough Council election took place on 2 May 2002 to elect members of Worthing Borough Council in West Sussex, England. One third of the council was up for election and the Liberal Democrats gained overall control of the council from the Conservative party. Overall turnout was 30.67%.
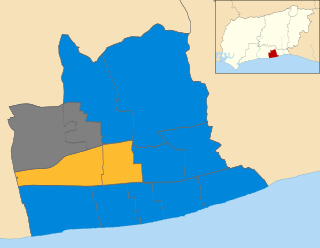
The 2007 Worthing Borough Council election took place on 3 May 2007 to elect members of Worthing Borough Council in West Sussex, England. One third of the council was up for election and the Conservative party stayed in overall control of the council.
The 2008 Wokingham Borough Council election took place on 1 May 2008 to elect members of Wokingham Unitary Council in Berkshire, England. One third of the council was up for election and the Conservative party stayed in overall control of the council.
The 2006 South Tyneside Metropolitan Borough Council election took place on 4 May 2006 to elect members of South Tyneside Metropolitan Borough Council in Tyne and Wear, England. One third of the council was up for election and the Labour party stayed in overall control of the council.
The 2003 Stratford-on-Avon District Council election took place on 1 May 2003 to elect members of Stratford-on-Avon District Council in Warwickshire, England. One third of the council was up for election and the Conservative party gained overall control of the council from no overall control.
The 2008 Rushmoor Council election took place on 1 May 2008 to elect members of Rushmoor Borough Council in Hampshire, England. One third of the council was up for election and the Conservative party stayed in overall control of the council.
The 2007 Windsor and Maidenhead Borough Council election took place on 3 May 2007 to elect members of Windsor and Maidenhead Unitary Council in Berkshire, England. The whole council was up for election and the Conservative party gained overall control of the council from the Liberal Democrats.
The 2003 Harrogate Council election took place on 1 May 2003 to elect members of Harrogate Borough Council in North Yorkshire, England. One third of the council was up for election and the council stayed under no overall control.
The 2007 Pendle Borough Council election took place on 3 May 2007 to elect members of Pendle Borough Council in Lancashire, England. One third of the council was up for election and the Liberal Democrats stayed in overall control of the council.
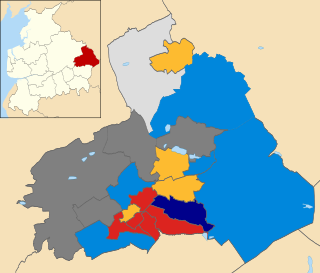
The 2008 Pendle Borough Council election took place on 1 May 2008 to elect members of Pendle Borough Council in Lancashire, England. One third of the council was up for election and the Liberal Democrats lost overall control of the council to no overall control.
The 2010 Woking Council election took place on 1 May 2010, on the same day as the 2010 general election, to elect members of Woking Borough Council in Surrey, England. One third of the council was up for election and the council stayed under no overall control.
The 2002 Eastbourne Borough Council election took place on 2 May 2002 to elect members of Eastbourne Borough Council in East Sussex, England. The whole council was up for election with boundary changes since the last election in 2000 reducing the number of seats by 3. The Liberal Democrats gained overall control of the council from the Conservative party.
The 2003 Eastbourne Borough Council election took place on 1 May 2003 to elect members of Eastbourne Borough Council in East Sussex, England. One third of the council was up for election and the Liberal Democrats stayed in overall control of the council.
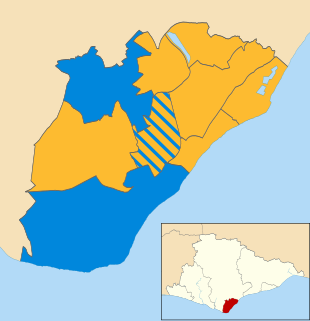
The 2007 Eastbourne Borough Council election took place on 3 May 2007 to elect members of Eastbourne Borough Council in East Sussex, England. The whole council was up for election and the Liberal Democrats gained overall control of the council from the Conservative party.
The 2004 Colchester Borough Council election took place on 10 June 2004 to elect members of Colchester Borough Council in Essex, England. This was the same day as the other 2004 United Kingdom local elections and as the 2004 European Parliament Elections. One third of the seats were up for election and the council stayed under no overall control.
The 2008 Colchester Borough Council election took place on 1 May 2008 to elect members of Colchester Borough Council in Essex, England. One third of the council was up for election and the Conservative party lost overall control of the council to no overall control.
The 2015 Christchurch Borough Council election took place on 7 May 2015 to elect members of Christchurch Borough Council in Dorset, England. The whole council was up for election and the Conservative party stayed in overall control of the council.