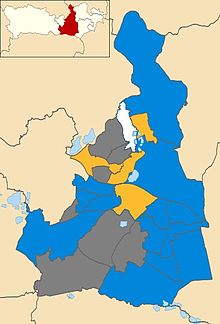
The 2012 Wokingham Borough Council election took place on Thursday 3 May 2012, the same day as other United Kingdom local elections, 2012, to elect members of Wokingham Unitary Council in Berkshire, England. One third of the council was up for election and the Conservative party stayed in overall control of the council. [1]
A unitary authority is a type of local authority that has a single tier and is responsible for all local government functions within its area or performs additional functions which elsewhere in the relevant country are usually performed by national government or a higher level of sub-national government.
Berkshire is one of the home counties in England. It was recognised by the Queen as the Royal County of Berkshire in 1957 because of the presence of Windsor Castle, and letters patent were issued in 1974. Berkshire is a county of historic origin, a ceremonial county and a non-metropolitan county without a county council. The county town is Reading.
After the election, the composition of the council was
The Conservative Party, officially the Conservative and Unionist Party, is a centre-right political party in the United Kingdom. The governing party since 2010, it is the largest in the House of Commons, with 313 Members of Parliament, and also has 249 members of the House of Lords, 18 members of the European Parliament, 31 Members of the Scottish Parliament, 12 members of the Welsh Assembly, eight members of the London Assembly and 8,916 local councillors.
The Liberal Democrats are a centrist, liberal political party in the United Kingdom. It is currently led by Vince Cable. It has 11 Members of Parliament in the House of Commons, 96 members of the House of Lords, one member of the European Parliament, five Members of the Scottish Parliament and one member in the Welsh Assembly and London Assembly. At the height of its influence, the party served as junior partners in a coalition government with the Conservative Party from 2010 to 2015.
A total of 74 candidates contested the 18 seats which were up for election. [3] These included 18 Conservative, 18 Liberal Democrat, 14 Labour, 14 Green Party, 8 United Kingdom Independence Party and 3 independent candidates.
The Labour Party is a centre-left political party in the United Kingdom that has been described as an alliance of social democrats, democratic socialists and trade unionists. The party's platform emphasises greater state intervention, social justice and strengthening workers' rights.
The Green Party of England and Wales is a green, left-wing political party in England and Wales. Headquartered in London, since September 2018, its co-leaders are Siân Berry and Jonathan Bartley. The Green Party has one representative in the House of Commons, one in the House of Lords, and three in the European Parliament. In addition, it has various councillors in UK local government and two members of the London Assembly.
Issues in the election included:
The Conservatives retained control of the council despite losing 2 seats: 1 to the Liberal Democrats in Winnersh, and Charvil to an Independent. [4] The Liberal Democrats held the 3 seats they defended in Bulmershe and Whitegates, Twyford and Loddon. However their gain in Winnersh was cancelled out a few hours later when Sue Smith resigned from the Liberal Democrats to finish her term as an Independent. [5] [6]
Party | Seats | Gains | Losses | Net gain/loss | Seats % | Votes % | Votes | +/− | |
---|---|---|---|---|---|---|---|---|---|
Conservative | 13 | 0 | 2 | -2 | 72.2 | 48.4 | 15,345 | -4.0% | |
Liberal Democrat | 4 | 1 | 0 | +1 | 22.2 | 24.1 | 7,643 | -1.5% | |
Labour | 0 | 0 | 0 | 0 | 0 | 12.2 | 3,862 | -1.1% | |
Green | 0 | 0 | 0 | 0 | 0 | 7.5 | 2,378 | +3.2% | |
UKIP | 0 | 0 | 0 | 0 | 0 | 5.4 | 1,733 | +1.5% | |
Independent | 1 | 1 | 0 | +1 | 5.5 | 1.5 | 496 | +0.9% | |
There were a total of 31,640 votes cast, including 183 spoiled ballots.
Party | Candidate | Votes | % | ± | |
---|---|---|---|---|---|
Liberal Democrat | Lesley Hayward | 976 | 37.1 | +3.9 | |
Conservative | Mohammed Parvaiz | 660 | 25.1 | -11.4 | |
Labour | Greg Bello | 750 | 28.5 | +7.6 | |
UKIP | Billy Khan | 137 | 5.2 | -0.4 | |
Green | Adrian Windisch | 106 | 4.0 | +0.2 | |
Majority | 226 | 8.6 | +5.3 | ||
Turnout | 2641 | 40 | |||
Liberal Democrat hold | Swing | +3.9 | |||
Party | Candidate | Votes | % | ± | |
---|---|---|---|---|---|
Liberal Democrat | Malcolm Storry | 42 | 4.8 | -23.2 | |
Conservative | Emma Hobbs | 382 | 43.2 | -22.6 | |
Green | James O'Callaghan | 44 | 5.0 | +5.0 | |
Independent | Nick Ray | 414 | 46.8 | 46.8 | |
Majority | 32 | 3.6 | |||
Turnout | 884 | 38 | |||
Independent gain from Conservative | Swing | +46.8 | |||
Party | Candidate | Votes | % | ± | |
---|---|---|---|---|---|
Conservative | Ullakarin Clark | 1202 | 55.9 | -0.2 | |
Liberal Democrat | Suresh Jeganathan | 291 | 13.5 | -8.8 | |
UKIP | Steven McMillan | 330 | 15.3 | +7.1 | |
Labour | Paul Sharples | 313 | 14.6 | +1.2 | |
Majority | 872 | 40.6 | |||
Turnout | 2151 | 33 | |||
Conservative hold | Swing | -0.2 | |||
Party | Candidate | Votes | % | ± | |
---|---|---|---|---|---|
Conservative | Dianne King | 967 | 50.2 | -5.9 | |
Liberal Democrat | Steven Scarrott | 388 | 20.1 | -2.1 | |
UKIP | Mike Spencer | 278 | 14.4 | +6.2 | |
Labour | Anthony Skuse | 286 | 14.8 | +1.8 | |
Majority | 579 | 30.1 | |||
Turnout | 1927 | 28 | |||
Conservative hold | Swing | -5.9 | |||
Party | Candidate | Votes | % | ± | |
---|---|---|---|---|---|
Conservative | Mike Gore | 1038 | 69.9 | +1.7 | |
Liberal Democrat | Roy Neall | 121 | 8.2 | -23.6 | |
Labour | Tim Jinkerson | 193 | 13.0 | +13.0 | |
Green | Martyn Foss | 124 | 8.4 | +8.4 | |
Majority | 845 | 56.9 | |||
Turnout | 1484 | 34 | |||
Conservative hold | Swing | +1.7 | |||
Party | Candidate | Votes | % | ± | |
---|---|---|---|---|---|
Conservative | Ian Pittock | 843 | 58.3 | -9.9 | |
Liberal Democrat | Roland Cundy | 345 | 23.8 | -2.4 | |
Green | Matthew Valler | 241 | 16.7 | +16.7 | |
Majority | 498 | 34.4 | |||
Turnout | 1447 | 33 | |||
Conservative hold | Swing | -7.3 | |||
Party | Candidate | Votes | % | ± | |
---|---|---|---|---|---|
Conservative | Guy Grandison | 688 | 42.8 | -12.8 | |
Liberal Democrat | Anthony Vick | 402 | 25.0 | -2.3 | |
UKIP | Peter Jackson | 142 | 8.8 | +8.8 | |
Labour | Neville Waites | 278 | 17.3 | +0.2 | |
Green | John Prior | 97 | 6.0 | +6.0 | |
Majority | 286 | 17.8 | |||
Turnout | 1609 | 23 | |||
Conservative hold | Swing | -12.8 | |||
Party | Candidate | Votes | % | ± | |
---|---|---|---|---|---|
Conservative | Pauline Jorgensen | 1062 | 50.5 | -7.5 | |
Liberal Democrat | Keith Yabsley | 465 | 22.1 | +4.6 | |
Labour | David Sharp | 317 | 15.1 | -0.7 | |
Green | Helene Cherry | 241 | 11.4 | +2.2 | |
Majority | 597 | 28.3 | |||
Turnout | 2105 | 31 | |||
Conservative hold | Swing | -7.5 | |||
Party | Candidate | Votes | % | ± | |
---|---|---|---|---|---|
Conservative | Wayne Smith | 562 | 71.2 | -4.2 | |
Liberal Democrat | Paul Trott | 83 | 10.5 | -4.2 | |
Labour | Umesh Ummat | 62 | 7.8 | +2.1 | |
Green | Paula Montie | 79 | 10 | N/A | |
Majority | 224 | 28.5 | -32.2 | ||
Turnout | 789 | 36 | |||
Conservative hold | Swing | -4.2 | |||
Party | Candidate | Votes | % | ± | |
---|---|---|---|---|---|
Liberal Democrat | Tom McCann | 846 | 41.4 | +6.8 | |
Conservative | Bill Soane | 751 | 36.7 | -8.8 | |
Labour | Tom Clark | 303 | 14.8 | +1.5 | |
Green | Julia Titus | 132 | 6.4 | +0.1 | |
Majority | 95 | 4.6 | |||
Turnout | 2042 | 30 | |||
Liberal Democrat hold | Swing | +6.8 | |||
Party | Candidate | Votes | % | ± | |
---|---|---|---|---|---|
Conservative | Ken Miall | 966 | 45.5 | -4.9 | |
Liberal Democrat | David Hare | 528 | 24.9 | +2.4 | |
Labour | Jacqueline Rupert | 373 | 17.6 | -0.4 | |
Green | Nicholas Marshall | 238 | 11.2 | +2.1 | |
Majority | 438 | 20.6 | |||
Turnout | 2119 | 30 | |||
Conservative hold | Swing | -4.9 | |||
Party | Candidate | Votes | % | ± | |
---|---|---|---|---|---|
Conservative | Malcolm Llewellyn Richards | 959 | 48.8 | -4.6 | |
Liberal Democrat | John Charles Bray | 268 | 13.6 | -1.3 | |
UKIP | Keith John Knight | 212 | 10.7 | +3.2 | |
Labour | Mary Gascoyne | 315 | 16.0 | +1.2 | |
Green | Emma-Louise Hamilton | 120 | 6.1 | N/A | |
Independent | Robin Smith | 82 | 4.1 | -5.2 | |
Majority | 644 | 32.7 | -5.8 | ||
Turnout | 1965 | 29 | |||
Conservative hold | Swing | -4.6 | |||
Party | Candidate | Votes | % | ± | |
---|---|---|---|---|---|
Conservative | John Anthony Sydney Halsall | 937 | 68.5 | -3.0 | |
Liberal Democrat | Martin George Alder | 248 | 18.1 | -2.8 | |
Labour | Matthew Stephen Dent | 172 | 12.5 | +5.3 | |
Majority | 689 | 50.4 | |||
Turnout | 1367 | 31 | |||
Conservative hold | Swing | +0.2 | |||
Party | Candidate | Votes | % | ± | |
---|---|---|---|---|---|
Conservative | Charlotte Jacqueline Louise Haitham-Taylor | 893 | 58.6 | -3.4 | |
Liberal Democrat | Imogen Shepherd-DuBey | 141 | 9.2 | -4.5 | |
Green | Marjory Diane Bisset | 473 | 31.1 | +6.8 | |
Majority | 420 | 26.8 | -11.0 | ||
Turnout | 1567 | 29 | |||
Conservative hold | Swing | -3.4 | |||
Party | Candidate | Votes | % | ± | |
---|---|---|---|---|---|
Liberal Democrat | Lindsay Ferris | 1,011 | 55.2 | +3.5 | |
Conservative | Sam Hawkins | 527 | 28.8 | -6.5 | |
Labour | Richard Fort | 159 | 8.6 | +0.4 | |
Green | James Ewan | 118 | 6.4 | N/A | |
Majority | 484 | 26.4 | +10.0 | ||
Turnout | 1829 | 40 | |||
Liberal Democrat hold | Swing | +3.5 | |||
Party | Candidate | Votes | % | ± | |
---|---|---|---|---|---|
Green | Kazek Lokuciewski | 187 | 14.0 | +7.5 | |
Liberal Democrat | James Leask | 158 | 11.8 | -8.8 | |
UKIP | Stella Howell | 135 | 10.1 | +4.4 | |
Labour | John Woodward | 166 | 12.4 | -0.5 | |
Conservative | Bob Wyatt | 679 | 51.0 | -4.3 | |
Majority | 492 | 36.9 | +3.2 | ||
Turnout | 1331 | 31 | |||
Conservative hold | Swing | -3.3 | |||
Party | Candidate | Votes | % | ± | |
---|---|---|---|---|---|
Conservative | Mark Ashwell | 961 | 38.2 | -4.1 | |
Liberal Democrat | Rachelle Shepherd-Dubey | 1,183 | 47.0 | +7.0 | |
UKIP | Tony Pollock | 183 | 7.2 | -1.4 | |
Labour | John Baker | 175 | 6.9 | -2.6 | |
Majority | 222 | 8.8 | |||
Turnout | 2513 | 35 | |||
Liberal Democrat gain from Conservative | Swing | +7.0 | |||
Party | Candidate | Votes | % | ± | |
---|---|---|---|---|---|
Conservative | Pauline Helliar-Symons | 1,268 | 66.0 | -2.6 | |
Liberal Democrat | Elaine Spratling | 147 | 7.6 | -4.5 | |
Green | Thomas Blomley | 178 | 9.2 | +9.2 | |
UKIP | Graham Widdows | 316 | 16.4 | +8.3 | |
Majority | 652 | 33.9 | -22.7 | ||
Turnout | 1920 | 31 | |||
Conservative hold | Swing | -2.6 | |||
The 2006 Barnet Council election took place on 4 May 2006 to elect members of Barnet London Borough Council in London, England. The whole council was up for election and the Conservative party stayed in overall control of the council.
The 2011 Babergh Council election took place on 5 May 2011 to elect members of Babergh District Council in Suffolk, England. The whole council was up for election and the council stayed under no overall control.
The 2002 Wokingham District Council election took place on 2 May 2002 to elect members of Wokingham Unitary Council in Berkshire, England. One third of the council was up for election and the Conservative party gained overall control of the council from no overall control.
The 2004 Wokingham District Council election took place on 10 June 2004 to elect members of Wokingham Unitary Council in Berkshire, England. The whole council was up for election with boundary changes since the last election in 2003. The Conservative party stayed in overall control of the council.
The 2006 Wokingham District Council election took place on 4 May 2006 to elect members of Wokingham Unitary Council in Berkshire, England. One third of the council was up for election and the Conservative party stayed in overall control of the council.
The 2007 Wokingham District Council election took place on 3 May 2007 to elect members of Wokingham Unitary Council in Berkshire, England. One third of the council was up for election and the Conservative party stayed in overall control of the council.
The 2008 Wokingham Borough Council election took place on 1 May 2008 to elect members of Wokingham Unitary Council in Berkshire, England. One third of the council was up for election and the Conservative party stayed in overall control of the council.
The 2007 Rushmoor Council election took place on 3 May 2007 to elect members of Rushmoor Borough Council in Hampshire, England. One third of the council was up for election and the Conservative party stayed in overall control of the council.
The 2007 Harrogate Council election took place on 3 May 2007 to elect members of Harrogate Borough Council in North Yorkshire, England. One third of the council was up for election and the council stayed under no overall control.
The 2004 Pendle Borough Council election took place on 10 June 2004 to elect members of Pendle Borough Council in Lancashire, England. One third of the council was up for election and the Liberal Democrats gained overall control of the council from no overall control.
The 2007 Pendle Borough Council election took place on 3 May 2007 to elect members of Pendle Borough Council in Lancashire, England. One third of the council was up for election and the Liberal Democrats stayed in overall control of the council.
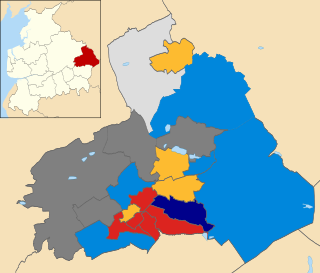
The 2008 Pendle Borough Council election took place on 1 May 2008 to elect members of Pendle Borough Council in Lancashire, England. One third of the council was up for election and the Liberal Democrats lost overall control of the council to no overall control.
The 2006 Maidstone Borough Council election took place on 4 May 2006 to elect members of Maidstone Borough Council in Kent, England. One third of the council was up for election and the council stayed under no overall control.
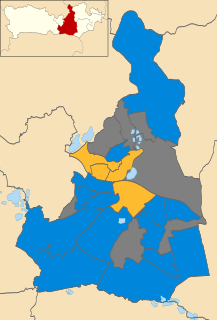
The 2010 Wokingham Borough Council election took place on 6 May 2010 to elect members of Wokingham Unitary Council in Berkshire, England. One third of the council was up for election and the Conservative party stayed in overall control of the council.
The 2011 Wokingham Borough Council election took place on 5 May 2011 to elect members of Wokingham Unitary Council in Berkshire, England. One third of the council was up for election and the Conservative party stayed in overall control of the council.
The 2011 Fenland District Council election took place on 5 May 2011 to elect members of Fenland District Council in Cambridgeshire, England. The whole council was up for election and the Conservative party stayed in overall control of the council.
The 2007 Redcar and Cleveland Borough Council election took place on 3 May 2007 to elect members of Redcar and Cleveland Unitary Council in England. The whole council was up for election and the council stayed under no overall control.
The 2014 United Kingdom local elections were held on 22 May 2014. Usually these elections are held on the first Thursday in May but were postponed to coincide with the 2014 European Parliament Elections. Direct elections were held for all 32 London boroughs, all 36 metropolitan boroughs, 74 district/borough councils, 20 unitary authorities and various mayoral posts in England and elections to the new councils in Northern Ireland.
The 2014 Wokingham Borough Council election took place on Thursday 22 May 2014. That was the same day as other United Kingdom local elections in order to elect members of Wokingham Unitary Council in Berkshire, England. One third of the council was up for election and the Conservative party stayed comfortably in overall control of the council.
The 2018 Wokingham Borough Council election took place on Thursday 3 May 2018. That was the same day as other United Kingdom local elections in order to elect members of Wokingham Unitary Council in Berkshire, England. One third of the council was up for election and the Conservative party stayed comfortably in overall control of the council.