The 64 counties of the US State of Colorado. |
This list of the 64 counties of the US State of Colorado by socioeconomic factors is taken from the "Quick Facts" web pages of the United States Census Bureau and the Population Health Institute of the University of Wisconsin. All data listed is for 2020, unless otherwise stated.
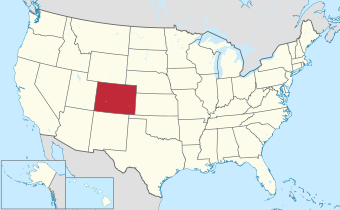
By comparison with the United States as a whole, the statistics in the following table show that Colorado has a higher per capita and household income than the national average. The state has a higher rate of population growth, a better educated population as measured by the percentage of people with bachelor's or higher degrees compared to the national average, and lower rates of people in poverty and people without health insurance than the U.S. as a whole. Colorado's population has a higher percentage of non-Hispanic whites in its population than the national average, although two Colorado counties have a majority of Hispanics. The state's vote in the 2020 presidential election was greater for the Democratic candidate than the Republican candidate.
Colorado has a longer life expectancy that the United States as a whole. In 2014, a study by the Institute for Health Metrics and Evaluation concluded that the residents of Summit, Pitkin, and Eagle counties in the high-elevation Rocky Mountains enjoyed the longest life expectancy of any counties in the United States. The three counties are noted for their ski resorts, respectively Breckenridge, Aspen, and Vail. [1] [2] Factors contributing to their lengthy life expectancy were "high education, high income, high access to medical care, the people are physically active, obesity is lower than anywhere else" said Dr. Ali Mokdad, one of the study's co-authors. [3]
Along with some Colorado counties which exceed the U.S. average in positive socioeconomic factors, a sizeable number of Colorado counties are also below the U.S. average.
The 2020 census is a snapshot of Colorado's population. Depending upon the methodology used and the time of measurement, socioeconomic statistics cited may vary from year to year, especially in counties with small populations where, for example, the gain or loss of a major employer may result in a sizeable change in measurements of poverty, population growth, income, and others.
Per capita income | Median household income | Population 2020 | Population growth rate 2010–2020 | Racial characteristics of population | Life expectancy in years 2022 | % of people in poverty | % of 25+ year old people with bachelor or higher degrees | % of people without health insurance | % vote for Biden in 2020 election [4] [5] [6] | |
---|---|---|---|---|---|---|---|---|---|---|
United States | $37,638 | $69,201 | 331,449,520 | 7.4% | 59.3% non-Hispanic white | 78.5 | 11.6% | 33.7% | 9.8% | 51.3% |
Colorado | $42,807 | $80,184 | 5,773,714 | 14.8% | 67.0 non-Hispanic white | 80.0 | 9.7% | 42.8% | 9.3% | 55.4% |
COUNTY | ||||||||||
Adams | $33,571 | $58,304 | 519,572 | 17.7% | 47.8% non-Hispanic white | 78.6 | 10.0% | 26.4% | 12.5% | 56.7% |
Alamosa | $25,249 | $46,217 | 16,376 | 6.0% | 46.4% non-Hispanic white | 75.1 | 18.3% | 25.6% | 14.7% | 48.1% |
Arapahoe | $45,046 | $84,947 | 655,070 | 14.5% | 58.1% non-Hispanic white | 80.6 | 8.6% | 44.5% | 10.0% | 61.0% |
Archuleta | $43,394 | $62,907 | 13,359 | 7.0% | 76.1% non-Hispanic white | 82.6 | 11.4% | 39.9% | 15.6% | 40.9% |
Baca | $26,220 | $39,891 | 3,506 | −7.4% | 82.0% non-Hispanic white | 76.4 | 20.3% | 23.8% | 11.8% | 14.3% |
Bent | $16,557 | $40,972 | 5,650 | −13.1% | 56.1% non-Hispanic white | 74.0 | 30.0% | 14.2% | 6.6% | 32.2% |
Boulder | $52,401 | $92,466 | 330,758 | 12.3% | 77.3% non-Hispanic white | 82.6 | 10.7% | 62.9% | 7.1% | 77.2% |
Broomfield | $55,176 | $107,570 | 74,112 | 32.6% | 75.1% non-Hispanic white | 81.8 | 4.9% | 57.8% | 5.9% | 62.4% |
Chaffee | $34,290 | $61,216 | 19,476 | 9.4% | 84.7% non-Hispanic white | 81.9 | 10.4% | 39.4% | 12.2% | 52.2% |
Cheyenne | $34,055 | $69,063 | 1,748 | −4.8% | 81.5% non-Hispanic white | 79.0 | 12.9% | 22.8% | 12.8% | 11.5% |
Clear Creek | $52,364 | 76,313 | 9,397 | 3.4% | 87.5% non-Hispanic white | 83.5 | 7.6% | 53.6% | 8.3% | 55.0% |
Conejos | $22,345 | $38,536 | 7,461 | −9.6% | 50.9% Hispanic | 75.4 | 16.7% | 24.5% | 11.7% | 45.2% |
Costilla | $23,442 | $35,000 | 3,499 | −0.7% | 58.5% Hispanic | 77.2 | 23.1% | 24.4% | 14.6% | 62.6% |
Crowley | $15,037 [lower-alpha 1] | $37,870 | 5,922 | 1.7% | 52.5% non-Hispanic white | 77.2 | 37.8% | 9.2% | 7.9% | 25.0% |
Custer | $35,255 | $59,877 | 4,704 | 10.5% | 88.7% non-Hispanic white | 79.0 | 10.5% | 38.7% | 11.5% | 30.6% |
Delta | $30,551 | $51,803 | 31,196 | 0.8% | 80.7% non-Hispanic white | 77.1 | 13.9% | 22.9% | 13.2% | 30.4% |
Denver | $50,642 | $78,177 | 715,522 | 19.2% | 55.0 non-Hispanic white | 78.9 | 11.7% | 52.5% | 12.0% | 79.6% |
Dolores | $36,003 | $62,500 | 2,326 | 12.7% | 86.6% non-Hispanic white | 75.7 | 13.9% | 26.5% | 10.7% | 23.5% |
Douglas | $57,481 | $127,443 | 37,978 | 25.4% | 80.0% non-Hispanic white | 83.4 | 2.9% | 59.2% | 4.8% | 45.2% |
Eagle | $49,010 | $91,338 | 55,371 | 6.1% | 66.9% non-Hispanic white | 91.4 [lower-alpha 2] | 7.1% | 50.9% | 16.9% | 63.8% |
Elbert | $50,147 | $114,904 | 26,062 | 12.9% | 86.5% non-Hispanic white | 82.4 | 5.4% | 39.3% | 5.4% | 23.7% |
El Paso | $37,619 | $75,909 | 730,695 | 17.4% | 67.7% non-Hispanic white | 78.1 | 9.6% | 39.5% | 8.7% | 42.8% |
Fremont | $25,371 | $53,411 | 48,939 | 4.5% | 78.6% non-Hispanic white | 76.9 | 9.6% | 18.6% | 9.5% | 28.8% |
Garfield | $35,608 | $77,212 | 61,685 | 8.9% | 66.5% non-Hispanic white | 80.6 | 9.2% | 32.9% | 18.8% | 49.9% |
Gilpin | $66,627 | $96,784 | 5,808 | 6.7% | 85.8% non-Hispanic white | 82.5 | 6.9% | 48.8% | 4.9% | 53.1% |
Grand | $39,337 | $69,353 | 15,717 | 5.9% | 86.5% non-Hispanic white | 86.6 | 7.2% | 37.7% | 14.0% | 47.7% |
Gunnison | $37,642 | $63,341 | 16,918 | 10.4% | 86.3% non-Hispanic white | 83.9 | 12.3 | 56.7% | 11.8% | 63.7% |
Hinsdale | $39,213 | $45,714 | 788 | −6.5% | 88.5% non-Hispanic white | n/a | 7.6% | 46.8% | 16.7% | 40.4% |
Huerfano | $26,111 | $45,724 | 6,820 | 1.6% | 62.5% non-Hispanic white | 75.7 | 18.6% | 25.3% | 7.7% | 47.1% |
Jackson | $28,619 | $44,667 | 1,379 | −1.1% | 84.2% non-Hispanic white | n/a | 14.8% | 27.2% | 19.3% | 20.0% |
Jefferson | $49,212 | $93,933 | 582,910 | 9.0% | 77.2% non-Hispanic white | 80.3 | 7.3% | 47.9% | 6.8% | 57.9% |
Kiowa | $26,540 | $45,476 | 1,446 | 3.4% | 87.0% non-Hispanic white | n/a | 12.5% | 20.3% | 8.3% | 10.9% |
Kit Carson | $33,007 | $52,917 | 7,087 | −14.3% | 77.7% non-Hispanic white | 78.1 | 12.1% | 18.2% | 16.0% | 17.1% |
Lake | $37,837 | $73,099 | 7,436 | 1.7% | 60.7% non-Hispanic white | 86.5 | 11.3% | 36.0% | 20.8% | 58.1% |
La Plata | $40,529 | $75,089 | 55,368 | 8.4% | 78.2% non-Hispanic white | 82.0 | 10.1% | 47.0% | 12.0% | 57.6% |
Larimer | $42,596 | $80,664 | 359,066 | 19.8% | 81.4% non-Hispanic white | 81.7 | 11.2% | 49.4% | 7.8% | 56.2% |
Las Animas | $26,521 | $45,118 | 14,555 | −6.1% | 53.2 non-Hispanic white | 76.0 | 21.0% | 18.7% | 13.1% | 43.9% |
Lincoln | $19,758 | $46,894 | 5,675 | 3.8% | 74.8% non-Hispanic white | 79.2 | 14.9% | 16.7% | 10.2% | 17.7% |
Logan | $27,849 | $50,998 | 21,528 | −5.2% | 74.8% non-Hispanic white | 77.7 | 16.4% | 20.3% | 12.2% | 21.1% |
Mesa | $33,073 | $62,127 | 155,703 | 6.1% | 80.4% non-Hispanic white | 78.3 | 10.6% | 29.3% | 12.1% | 34.8% |
Mineral | $33,849 | $55,536 | 865 | 13.1% | 90.2% non-Hispanic white | n/a | 9.6% | 56.3% | 12.8% | 41.9% |
Moffat | $29,451 | $58,383 | 13,292 | 3.6% | 78.9% non-Hispanic white | 76.9 | 10.8% | 18.8% | 13.5% | 17.1% |
Montezuma | $28,520 | $58,335 | 25,849 | 1.2% | 71.1% non-Hispanic white | 77.0 | 15.2% | 30.0% | 15.4% | 37.7% |
Montrose | $31,403 | $57,225 | 42,679 | 3.4% | 75.4% non-Hispanic white | 80.6 | 12.5% | 26.5% | 14.4% | 30.8% |
Morgan | $26,919 | $62,914 | 29,111 | 3.4% | 56.6% non-Hispanic white | 77.0 | 12.4% | 17.5% | 16.3% | 28.2% |
Otero | $23,869 | $45,826 | 18,690 | −0.7 | 52.8% non-Hispanic white | 72.1 | 19.7% | 19.0% | 12.3% | 37.7% |
Ouray | $42,317 | $67,228 | 4,874 | 9.9% | 89.6% non-Hispanic white | 85.7 | 6.4% | 46.2% | 10.7% | 58.8% |
Park | $39,975 | $77,775 | 17,390 | 7.3% | 88.1% non-Hispanic white | 85.6 | 11.9% | 33.1% | 9.2% | 39.9% |
Phillips | $32,223 | $50,951 | 4,530 | 2.0% | 73.4% non-Hispanic white | 77.5 | 11.9% | 26.0% | 16.8% | 19.6% |
Pitkin | $76,883 | $92,708 | 17,358 | 1.2% | 84.2% non-Hispanic white | 92.5 [lower-alpha 2] | 6.7% | 62.3% | 9.4% | 75.2% |
Prowers | $24,281 | $44,984 | 11,999 | 4.4% | 56.4% non-Hispanic white | 76.2 | 19.2% | 16.9% | 15.5% | 26.2% |
Pueblo | $28,540 | $53,430 | 168,162 | 5.7% | 51.0% non-Hispanic white | 75.1 | 16.2% | 23.7% | 9.4% | 49.6% |
Rio Blanco | $28,139 | $58,229 | 6,529 | −2.2% | 83.6% non-Hispanic white | 79.5 | 10.2% | 23.9% | 11.2% | 15.2% |
Rio Grande | $30,215 | $50,287 | 11,539 | −3.7% | 51.8% non-Hispanic white | 76.0 | 14.4% | 28.9% | 14.9% | 39.6% |
Routt | $50,571 | $83,725 | 24,829 | 5.6% | 89.5% non-Hispanic white | 84.1 | 6.0% | 50.8% | 11.1% | 62.7% |
Saguache | $29,805 | $48,413 | 6,368 | 4.4% | 59.0% non-Hispanic white | 78.8 | 21.6% | 25.5% | 15.6% | 55.6% |
San Juan | $40,019 | $63,333 | 705 | 0.9% | 81.6% non-Hispanic white | n/a | 13.8% | 42.2% | 17.4% | 60.9% |
San Miguel | $51,725 | $70,965 | 8,072 | 9.7% | 84.4% non-Hispanic white | 93.6 [lower-alpha 2] | 9.0% | 22.4% | 13.6% | 76.2% |
Sedgwick | $28,922 | $44,405 | 2,404 | 1.1% | 78.7% non-Hispanic white | 76.8 | 14.2% | 22.4% | 13.6% | 20.8% |
Summit | $48,488 | $93,505 | 31,055 | 10.9% | 80.7% non-Hispanic white | 93.5 [lower-alpha 2] | 6.7% | 52.8% | 15.2% | 68.4% |
Teller | $38,556 | $68,677 | 24,710 | 5.8% | 86.5% non-Hispanic white | 81.5 | 7.9% | 37.0% | 8.4% | 31.2% |
Washington | $29,814 | $54,141 | 4,817 | 0.1% | 85.3% non-Hispanic white | 76.7 | 11.6% | 22.1% | 9.9% | 12.3% |
Weld | $35,507 | $80,843 | 328,981 | 30.1% | 63.9% non-Hispanic white | 80.3 | 9.3% | 29.5% | 11.8% | 39.6% |
Yuma | $29,600 | $56,327 | 9,988 | −0.5% | 71.3% non-Hispanic white | 79.7 | 13.5% | 23.5% | 17.7% | 15.8% |
Sources: , "Quick Facts", U.S. Census Bureau, accessed April 12, 2023. Search counties, each of which has a page with the above data, by name and state. , "County Health Rankings & Roadmaps," Population Health Institute, University of Wisconsin, accessed April 12, 2023. Life expectancy found under heading of "Additional Health Outcomes" for each county.
Summit County is a county located in the U.S. state of Colorado. As of the 2020 census, the population was 31,055. The county seat and largest town is Breckenridge.
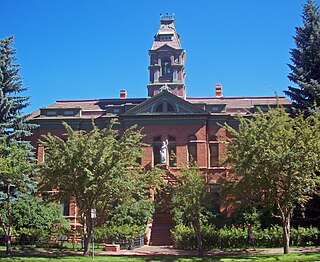
Pitkin County is a county in the U.S. state of Colorado. As of the 2020 census, the population was 17,358. The county seat and largest city is Aspen. The county is named for Colorado Governor Frederick Walker Pitkin. Pitkin County has the seventh-highest per capita income of any U.S. county. Measured by mean income of the top 5% of earners, it is the wealthiest U.S. county.
Eagle County is a county located in the U.S. state of Colorado. As of the 2020 census, the population was 55,731. The county seat is the Town of Eagle and the most populous community is Edwards. The county is named for the Eagle River.
The South Central Colorado Urban Area comprises the Colorado Springs Metropolitan Statistical Area, the Pueblo Metropolitan Statistical Area, and the Cañon City Micropolitan Statistical Area in the central and south central region of the State of Colorado. With the exception of northern Teller County and small portions of northern El Paso County, the entire South Central Colorado Urban Area is drained by the Arkansas River and its tributaries. The South Central Colorado Urban Area is the southernmost of the three primary subregions of the Front Range Urban Corridor.
This list of sports in the U.S. State of Colorado includes professional teams, college sports, and individual sports from the Denver Metropolitan Area and other cities.