List of Colorado counties by population

Last updated
The location of the State of Colorado in the United States of America. Colorado in United States.svg
The location of the State of Colorado in the United States of America .
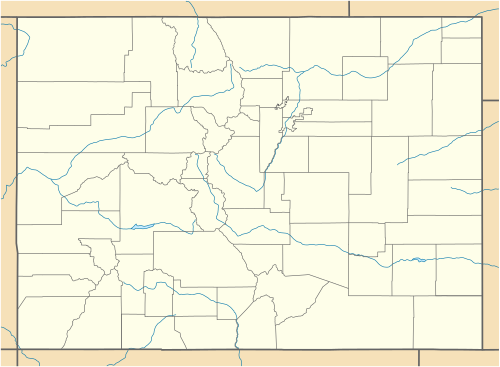
The 64 counties of the U.S. State of Colorado.

This list ranks the 64 counties of the U.S. State of Colorado [1] by population as of July 1, 2023, as estimated by the United States Census Bureau. [lower-alpha 1] This list also details the county population changes since the 2000 United States Census. [3]

Contents

El Paso County with a 2023 population estimate of 744,215 remains the most populous county in Colorado, while Hinsdale County with a 2023 population of 765 is now the least populous county. Five of the 64 Colorado counties have more than 500,000 residents, while 12 have fewer than 5,000 residents. [lower-alpha 1]

Counties

Select the OpenStreetMap link at the right to view the location of the 64 counties.

The 64 Counties of the State of Colorado

County [1] Population [3] County website CDOT county mapCoordinates [lower-alpha 2]
2023 rank2023 estimates [lower-alpha 1] Change 2020 Census Change 2010 Census Change 2000 Census
El Paso County 1744,215+1.89%730,395+17.38%622,263+20.38%516,934 El Paso County map
City and County of Denver 2716,577+0.15%715,522+19.22%600,158+8.37%553,805 City and County of Denver map
Arapahoe County 3656,061+0.15%655,070+14.52%572,003+17.01%488,829 Arapahoe County map
Jefferson County 4576,366−1.12%582,910+9.05%534,543+1.73%525,449 Jefferson County map
Adams County 5533,365+2.65%519,572+17.66%441,603+26.87%348,076 Adams County map
Douglas County 6383,906+7.24%357,978+25.40%285,465+62.44%175,732 Douglas County map
Larimer County 7370,771+3.26%359,066+19.84%299,630+19.14%251,494 Larimer County map
Weld County 8359,442+9.26%328,981+30.12%252,825+39.86%180,766 Weld County map
Boulder County 9326,831−1.19%330,758+12.29%294,567+9.19%269,784 Boulder County map
Pueblo County 10169,422+0.75%168,162+5.72%159,063+12.42%141,490 Pueblo County map
Mesa County 11159,681+2.55%155,703+6.12%146,723+25.47%116,939 Mesa County map
City and County of Broomfield 1276,860+3.71%74,112+32.61%55,889+42.57%39,202 City and County of Broomfield map
Garfield County 1362,707+1.66%61,685+9.39%56,389+28.78%43,786 Garfield County map
La Plata County 1456,407+1.38%55,638+8.38%51,334+16.78%43,957 La Plata County map
Eagle County 1554,381−2.42%55,731+6.77%52,197+25.40%41,623 Eagle County map
Fremont County 1650,318+2.82%48,939+4.52%46,824+1.48%46,140 Fremont County map
Montrose County 1744,156+3.46%42,679+3.40%41,276+23.44%33,438 Montrose County map
Delta County 1831,746+1.76%31,196+0.79%30,952+11.24%27,824 Delta County map
Summit County 1930,465−1.90%31,055+10.93%27,994+18.82%23,560 Summit County map
Morgan County 2029,524+1.42%29,111+3.38%28,159+3.63%27,172 Morgan County map
Elbert County 2128,806+10.53%26,062+12.89%23,086+16.27%19,855 Elbert County map
Montezuma County 2226,531+2.64%25,849+1.23%25,535+7.19%23,822 Montezuma County map
Routt County 2325,064+0.95%24,829+5.61%23,509+19.46%19,679 Routt County map
Teller County 2424,617−0.38%24,710+5.82%23,350+13.68%20,541 Teller County map
Logan County 2520,619−4.22%21,528−5.20%22,709+10.42%20,566 Logan County map
Chaffee County 2620,617+5.86%19,476+9.36%17,809+9.59%16,250 Chaffee County map
Otero County 2718,136−2.96%18,690−0.75%18,831−7.29%20,311 Otero County map
Park County 2818,117+4.18%17,390+7.31%16,206+11.62%14,519 Park County map
Gunnison County 2917,321+2.38%16,918+10.40%15,324+9.46%14,000 Gunnison County map
Alamosa County 3016,655+1.70%16,376+6.03%15,445+3.21%14,965 Alamosa County map
Pitkin County 3116,640−4.14%17,358+1.22%17,148+15.17%14,889 Pitkin County map
Grand County 3215,935+1.39%15,717+5.89%14,843+19.38%12,433 Grand County map
Las Animas County 3314,348−1.42%14,555−6.14%15,507+1.94%15,212 Las Animas County map
Archuleta County 3414,189+6.21%13,359+10.55%12,084+22.13%9,894 Archuleta County map
Moffat County 3513,327+0.26%13,292−3.65%13,795+4.68%13,178 Moffat County map
Prowers County 3611,751−2.07%11,999−4.40%12,551−13.34%14,483 Prowers County map
Rio Grande County 3711,188−3.04%11,539−3.70%11,982−3.57%12,425 Rio Grande County map
Yuma County 389,862−1.26%9,988−0.55%10,043+2.00%9,846 Yuma County map
Clear Creek County 399,147−2.66%9,397+3.40%9,088−1.89%9,263 Clear Creek County map
San Miguel County 407,868−2.53%8,072+9.69%7,359+11.62%6,593 San Miguel County map
Conejos County 417,521+0.80%7,461−9.63%8,256−1.71%8,400 Conejos County map
Lake County 427,365−0.95%7,436+1.72%7,310−6.45%7,814 Lake County map
Huerfano County 437,055+3.45%6,820+1.62%6,711−14.61%7,859 Huerfano County map
Kit Carson County 446,994−1.31%7,087−14.30%8,270+3.21%8,013 Kit Carson County map
Saguache County 456,688+5.03%6,368+4.26%6,108+3.46%5,904 Saguache County map
Rio Blanco County 466,569+0.61%6,529−2.06%6,666+11.25%5,992 Rio Blanco County map
Gilpin County 475,926+2.03%5,808+6.75%5,441+14.64%4,746 Gilpin County map
Bent County 485,681+0.55%5,650−13.06%6,499+8.39%5,996 Bent County map
Crowley County 495,636−4.83%5,922+1.70%5,823+5.60%5,514 Crowley County map
Custer County 505,534+17.64%4,704+10.55%4,255+21.29%3,508 Custer County map
Lincoln County 515,480−3.44%5,675+3.80%5,467−10.22%6,089 Lincoln County map
Ouray County 525,176+6.20%4,874+9.87%4,436+18.39%3,747 Ouray County map
Washington County 534,855+0.79%4,817+0.06%4,814−2.19%4,922 Washington County map
Phillips County 544,476−1.19%4,530+1.98%4,442−0.96%4,485 Phillips County map
Costilla County 553,628+3.69%3,499−0.71%3,524−3.74%3,661 Costilla County map
Baca County 563,344−4.62%3,506−7.44%3,788−16.14%4,517 Baca County map
Dolores County 572,513+8.04%2,326+12.69%2,064+11.93%1,844 Dolores County map
Sedgwick County 582,299−4.37%2,404+1.05%2,379−13.40%2,747 Sedgwick County map
Cheyenne County 591,727−1.20%1,748−4.79%1,836−17.63%2,229 Cheyenne County map
Kiowa County 601,384−4.29%1,446+3.43%1,398−13.81%1,622 Kiowa County map
Jackson County 611,309−5.08%1,379−1.08%1,394−11.60%1,577 Jackson County map
Mineral County 62944+9.13%865+21.49%712−14.32%831 Mineral County map
San Juan County 63802+13.76%705+0.86%699+25.27%558 San Juan County map
Hinsdale County 64765−2.92%788−6.52%843+6.44%792 Hinsdale County map
State of Colorado State5,877,610+1.80%5,773,714+14.80%5,029,196+16.92%4,301,262 State of Colorado map

See also

Outline of Colorado

Notes

  1. 1 2 3 United States Census Bureau estimates of county population as of July 1, 2023, [2]
  2. The centroid geographic coordinates of the county as determined by the United States Census Bureau. [4]

Related Research Articles

<span class="mw-page-title-main">National Register of Historic Places listings in Colorado</span> List of National Register of Historic Places in the U.S. State of Colorado

There are more than 1,500 properties and historic districts in the U.S. State of Colorado listed on the National Register of Historic Places. They are distributed over 63 of Colorado's 64 counties; only the City and County of Broomfield currently has none.

<span class="mw-page-title-main">North Central Colorado Urban Area</span> Metropolitan area of Colorado

The North Central Colorado Urban Area comprises the four contiguous metropolitan statistical areas in the north central region of the State of Colorado: the Denver–Aurora Metropolitan Statistical Area, the Boulder Metropolitan Statistical Area, the Fort Collins-Loveland Metropolitan Statistical Area, and the Greeley Metropolitan Statistical Area. With the exception of southeastern Elbert County, southeastern Park County, and tiny portions of southern Douglas County, the entire North Central Colorado Urban Area is drained by the South Platte River and its tributaries. The North Central Colorado Urban Area is the central, and the most populous, of the three primary subregions of the Front Range Urban Corridor.

<span class="mw-page-title-main">Population history of Colorado census-designated places</span> Population history of the census-designated places in the U.S. state of Colorado

This is a population history of the 210 census-designated places in the US state of Colorado since the 2000 United States census. The United States Census Bureau defines certain unincorporated communities as census-designated places (CDPs) for enumeration in each decennial census. The Census Bureau defined 85 CDPs in Colorado for the 2000 Census, 187 CDPs for the 2010 Census, and 210 CDPs for the 2020 Census.

References

  1. 1 2 "Colorado Counties". Colorado Department of Local Affairs. 2021. Retrieved November 13, 2021.
  2. "Annual Estimates of the Resident Population for Counties in Colorado: April 1, 2020 to July 1, 2023 (CO-EST2023-POP-08)". United States Census Bureau, United States Department of Commerce. March 2024. Retrieved March 20, 2024.
  3. 1 2 "QuickFacts for Colorado". United States Census Bureau . Retrieved September 19, 2022.
  4. "State of Colorado Counties – Current/TAB20 – Data as of January 1, 2020". United States Census Bureau. January 1, 2020. Retrieved September 29, 2022.

38°59′50″N105°32′52″W / 38.9972°N 105.5478°W / 38.9972; -105.5478 (State of Colorado)