
In probability theory and statistics, the exponential distribution or negative exponential distribution is the probability distribution of the time between events in a Poisson point process, i.e., a process in which events occur continuously and independently at a constant average rate. It is a particular case of the gamma distribution. It is the continuous analogue of the geometric distribution, and it has the key property of being memoryless. In addition to being used for the analysis of Poisson point processes it is found in various other contexts.
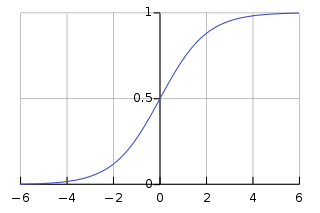
A sigmoid function is a mathematical function having a characteristic "S"-shaped curve or sigmoid curve.
In mathematical physics, n-dimensional de Sitter space is a maximally symmetric Lorentzian manifold with constant positive scalar curvature. It is the Lorentzian analogue of an n-sphere.
In mathematics, the classical orthogonal polynomials are the most widely used orthogonal polynomials: the Hermite polynomials, Laguerre polynomials, Jacobi polynomials.
In probability theory, a compound Poisson distribution is the probability distribution of the sum of a number of independent identically-distributed random variables, where the number of terms to be added is itself a Poisson-distributed variable. The result can be either a continuous or a discrete distribution.

The Pearson distribution is a family of continuous probability distributions. It was first published by Karl Pearson in 1895 and subsequently extended by him in 1901 and 1916 in a series of articles on biostatistics.
In statistics and information theory, a maximum entropy probability distribution has entropy that is at least as great as that of all other members of a specified class of probability distributions. According to the principle of maximum entropy, if nothing is known about a distribution except that it belongs to a certain class, then the distribution with the largest entropy should be chosen as the least-informative default. The motivation is twofold: first, maximizing entropy minimizes the amount of prior information built into the distribution; second, many physical systems tend to move towards maximal entropy configurations over time.

In probability theory and statistics, the noncentral chi-squared distribution is a noncentral generalization of the chi-squared distribution. It often arises in the power analysis of statistical tests in which the null distribution is a chi-squared distribution; important examples of such tests are the likelihood-ratio tests.
In mathematics, a logarithm of a matrix is another matrix such that the matrix exponential of the latter matrix equals the original matrix. It is thus a generalization of the scalar logarithm and in some sense an inverse function of the matrix exponential. Not all matrices have a logarithm and those matrices that do have a logarithm may have more than one logarithm. The study of logarithms of matrices leads to Lie theory since when a matrix has a logarithm then it is in an element of a Lie group and the logarithm is the corresponding element of the vector space of the Lie algebra.
In probability theory, the inverse Gaussian distribution is a two-parameter family of continuous probability distributions with support on (0,∞).
A ratio distribution is a probability distribution constructed as the distribution of the ratio of random variables having two other known distributions. Given two random variables X and Y, the distribution of the random variable Z that is formed as the ratio Z = X/Y is a ratio distribution.

In probability theory, statistics and econometrics, the Burr Type XII distribution or simply the Burr distribution is a continuous probability distribution for a non-negative random variable. It is also known as the Singh–Maddala distribution and is one of a number of different distributions sometimes called the "generalized log-logistic distribution". It is most commonly used to model household income, see for example: Household income in the U.S. and compare to magenta graph at right.

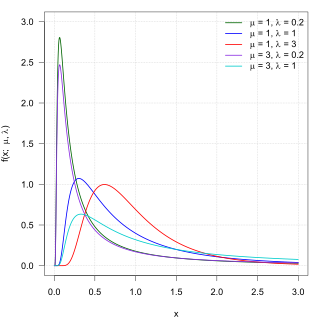
In probability and statistics, the log-logistic distribution is a continuous probability distribution for a non-negative random variable. It is used in survival analysis as a parametric model for events whose rate increases initially and decreases later, as, for example, mortality rate from cancer following diagnosis or treatment. It has also been used in hydrology to model stream flow and precipitation, in economics as a simple model of the distribution of wealth or income, and in networking to model the transmission times of data considering both the network and the software.
In mathematics, the Plancherel theorem for spherical functions is an important result in the representation theory of semisimple Lie groups, due in its final form to Harish-Chandra. It is a natural generalisation in non-commutative harmonic analysis of the Plancherel formula and Fourier inversion formula in the representation theory of the group of real numbers in classical harmonic analysis and has a similarly close interconnection with the theory of differential equations. It is the special case for zonal spherical functions of the general Plancherel theorem for semisimple Lie groups, also proved by Harish-Chandra. The Plancherel theorem gives the eigenfunction expansion of radial functions for the Laplacian operator on the associated symmetric space X; it also gives the direct integral decomposition into irreducible representations of the regular representation on L2(X). In the case of hyperbolic space, these expansions were known from prior results of Mehler, Weyl and Fock.

In probability theory and statistics, the Poisson distribution is a discrete probability distribution that expresses the probability of a given number of events occurring in a fixed interval of time or space if these events occur with a known constant mean rate and independently of the time since the last event. It is named after French mathematician Siméon Denis Poisson. The Poisson distribution can also be used for the number of events in other specified interval types such as distance, area, or volume.
In statistics, the generalized Marcum Q-function of order is defined as

The Lomax distribution, conditionally also called the Pareto Type II distribution, is a heavy-tail probability distribution used in business, economics, actuarial science, queueing theory and Internet traffic modeling. It is named after K. S. Lomax. It is essentially a Pareto distribution that has been shifted so that its support begins at zero.
In probability theory and statistics, the noncentral beta distribution is a continuous probability distribution that is a noncentral generalization of the (central) beta distribution.

The Kaniadakis Logistic distribution is a generalized version of the Logistic distribution associated with the Kaniadakis statistics. It is one example of a Kaniadakis distribution. The κ-Logistic probability distribution describes the population kinetics behavior of bosonic or fermionic character.


